Creativity, Culture & Education
The Costs and Benefits of Creative Partnerships
This report has been prepared solely for the use of Creativity, Culture & Education. No responsibility to any third party is accepted as the report has not been prepared for, and is not intended for any other purpose.
© 2010 PricewaterhouseCoopers LLP. All rights reserved. 'PricewaterhouseCoopers' refers to the PricewaterhouseCoopers LLP (a limited liability partnership in the United Kingdom) or, as the context requires, other member firms of PricewaterhouseCoopers International Limited, each of which is a separate and independent legal entity.
Executive Summary
3
1
Introduction
6
2
Background to Creative Partnerships
8
3
Approach
18
4
Costs
23
5
Benefits
26
6
Net impacts
38
Appendix A
Points score threshold for obtaining 5 ‘good’ GCSEs
41
Contents
Introduction
Creativity, Culture and Education (CCE) is a national organisation which aims to transform the lives of children and families by harnessing the potential of creative learning and cultural opportunity to enhance their aspirations, achievements and skills. It currently manages two programmes: Creative Partnerships, which is the flagship creative learning programme designed to foster long-term partnerships between schools and creative professionals to inspire, open minds and harness the potential of creative learning; and Prevent, which brings together creative agents, cultural practitioners and schools in key geographical areas to channel the expression of young people through filmmaking, poetry and writing in order to challenge extreme ideologies.
PricewaterhouseCoopers LLP (PwC) was commissioned by CCE to prepare a report that analyses the economic costs and benefits of Creative Partnerships. The analysis is focussed on assessing the costs of delivering the programme and the benefits accruing to two distinct groups: learners and their parents; and schools and the teachers within them.
Approach
The approach used to estimate the economic costs and benefits of Creative Partnerships is based on the development and application of a logic model, which is a high level map of the transmission mechanism through which inputs to the programme deliver impacts to each of the potential beneficiaries (learners and their parents; and schools and their teachers). Among other things, the logic model shows that key impacts accrue to learners, in terms of higher lifetime earnings that arise as a result of improved educational attainment; to the wider society, through reductions in exclusion and the social implications that this has; and to teachers and schools, through improved teacher morale and reduced recruitment and retention costs.
As far as possible, within the constraints of the available data, the approach we have used is consistent with the requirements of HM Treasury Green Book1, the
Government’s guide to evaluation and appraisal. To that end, the benefits are measured in incremental terms and at the whole economy level.
Key findings
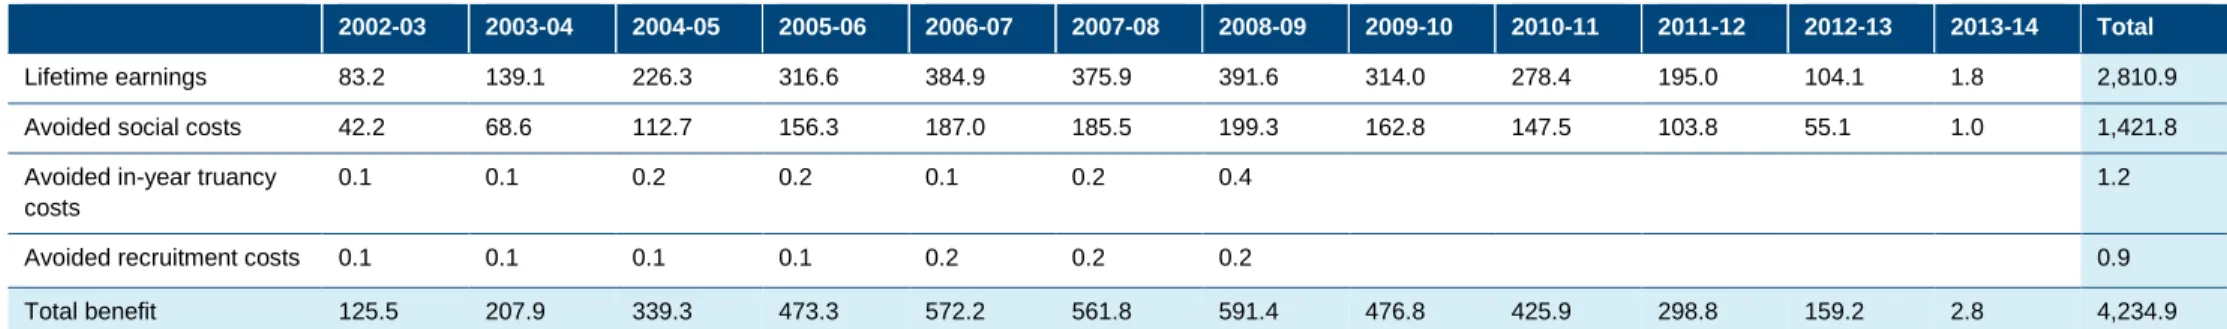
Table 1 shows the estimated costs and benefits of Creative Partnerships. Overall, Creative Partnerships is estimated to have generated or is expected to generate a net positive economic benefit of just under £4bn. Expressed as a ratio of the benefits to the costs, we estimate that every £1 invested in the programme delivers
£15.302worth of benefits.
1
HM Treasury, “The Green Book – Appraisal and Evaluation in Central Government”http://www.hm-treasury.gov.uk/d/green_book_complete.pdf
2
To 2 decimal places
Table 1: Net impacts of Creative Partnerships (£m) 2002-03 2003-04 2004-05 2005-06 2006-07 2007-08 2008-09 2009-10 2010-11 2011-12 2012-13 2013-14 Total Benefits 125.5 207.9 339.3 473.3 572.2 561.8 591.4 476.8 425.9 298.8 159.2 2.8 4,234.9 Costs 9.7 31.6 36.7 44.0 51.5 47.3 55.3 276.0 Net benefit 115.8 176.3 302.6 429.3 520.7 514.5 536.1 476.8 425.9 298.8 159.2 2.8 3,958.8 Source: PwC analysis Where:
Just under 800,000 learners in over 2000 schools are estimated to have been exposed to Creative Partnerships;
Learner benefits are the single largest contributor to total benefits, accounting for two-thirds of the total benefit. Wider benefits are the second highest
contributor, accounting for almost a third of the total. School and teacher benefits, however, are estimated to account for less than 1% of the total; and
Learner benefits have been derived using a National Foundation for Educational Research (NFER) study, which found that young people who have attended
Creative Partnerships activities made, on average, the equivalent of 2.5 grades better progress at GCSE than similar young people in other schools3. This
finding has then been used to estimate the number of learners achieving 5 ‘good’ GCSEs who would not have done so in the absence of Creative Partnerships.
Sensitivity analysis
We have tested the sensitivity of these estimates to some of the key assumptions we have used. Table 2 summarises the overall results.
Including impacts on further and higher education: the base case assumes that there is no additional benefit, in terms of lifetime earnings, beyond that achieved
by attaining 5 ‘good’ GCSE results at KS4. There is, however, evidence that suggests learners who achieve these qualifications at KS4 are more likely to proceed to further education and higher education. Based on previous PwC analysis, we assume that 87% of learners who obtain 5 ‘good’ GCSEs progress to
further education and of them, 50% advance to higher education4. Using DfE estimates of the lifetime earning premia of further and higher education, we
estimate that total net benefits of Creative Partnerships are just under £8bn.
3
Kendall, L., Morrison, J., Sharp, C. and Yeshanew, T. “The longer-term impact of Creative Partnerships on the attainment of young people: Results from 2005 and 2006”(2008), NFER pp17-19
4
Assuming benefits only accrue to learners in Years 10 and 11: the NFER analysis used to underpin the estimate of the attainment impact of Creative
Partnerships only considered the early years of the programme and only included learners who were close to KS4. Our base case assumes that this effect is replicated across all secondary school learners exposed to the programme. Although the NFER analysis also suggests that the programme has a positive impact on learners at KS3, we have assessed the impact as if the only learner beneficiaries are those in Years 10 and 11 when the Creative Partnerships intervention was delivered. This reduces the central estimate of the net benefit by over £3bn to just under £900m.
Including benefits to all secondary and primary school learners exposed to Creative Partnerships: although the NFER analysis finds no statistically significant
impact on attainment of Creative Partnerships at KS2, it is possible that KS2 tests do not test for the types of skills that learners typically acquire as a result of exposure to the programme. We have, therefore, assessed a scenario where primary school learners are also seen to benefit from the programme in the same way as their secondary school counterparts. Allowing for the potential of double counting in this scenario, as it is highly likely that some learners who are impacted in primary school will be impacted again in secondary and so already be accounted for in the base case, the net economic benefit of the programme increases by £1.9bn to £5.8bn.
Table 2: Sensitivity analysis
Base case Total £m
Including benefits
from HE/FE earnings Change to base case
Excluding years 7-9
from the analysis Change to base case
Including primary
school learners Change to base case
Lifetime earnings 2,810.9 6,732.6 3,921.6 776.0 -2,035.0 4,017.7 1,206.8
Avoided social costs 1,421.7 1,421.7 - 385.4 -1,036.3 2,084.3 662.5
Total benefit 4,234.8 8,156.4 3,921.6 1,163.5 -3,071.3 6,104.1 1,869.3
Total cost 276.0 276.0 - 276.0 - 276.0
-Net benefit 3,958.8 7,880.4 3,921.6 887.5 -3,071.3 5,828.1 1,869.3
Benefit / Cost Ratio 15.30 29.20 13.90 4.20 -11.10 21.90 6.60
1.1 Background
Creativity, Culture and Education (CCE) is a national organisation which aims to transform the lives of children and families by harnessing the potential of creative learning and cultural opportunity to enhance their aspirations, achievements and skills.
CCE currently manages two programmes:
Creative Partnerships – this flagship creative learning programme fosters long-term partnerships between schools and creative professionals to inspire, open
minds and harness the potential of creative learning. It is estimated that the programme has worked with more than 1 million children and 90,000 teachers in more than 8,000 projects in England since 2002; and
Prevent – this programme brings together creative agents, cultural practitioners and schools in key geographical areas to channel the expression of young
people through filmmaking, poetry and writing in order to challenge extreme ideologies.
These programmes offer learners the opportunity to engage in creative learning by exposing them to culture and the arts. In doing so, they are intended to help to transform the aspirations and attainment of learners, while providing them with the sorts of skills attractive to employers. The potential benefits from these
programmes are, however, not restricted to young people: parents, teachers and schools can also benefit.
1.2 Objectives of this research
PricewaterhouseCoopers LLP (PwC) was commissioned by CCE to prepare a report that estimates the economic benefits of CCE’s flagship programme, Creative Partnerships.
An assessment of the economic benefits of Creative Partnerships has been done in terms of the benefits accruing to two distinct groups:
Learners and parents; and
Schools and teachers.
By comparing the costs of administering the programme, as well as any other resources leveraged into it, with the estimated benefits to the two beneficiary groups, this report estimates the net impact on the UK economy of Creative Partnerships.
1.3 Report structure
The remaining five sections of this report are structured as follows:
Section 2 provides an introduction to Creative Partnerships;
Section 3 explains the approach we have used to estimate the costs and benefits;
Section 4 analyses the costs of Creative Partnerships;
Section 5 analyses the benefits of Creative Partnerships; and
Section 6 compares the costs and benefits to assess the overall net impacts of Creative Partnerships, compares these results to those of other government
2.1 Introduction
In this section, we start by giving an overview of the rationale for creative education in the UK. This is followed by a more detailed examination of Creative Partnerships, how the programme is structured and how it has changed over time.
The section ends with an analysis of the profile of Creative Partnerships participants, from learner, project and school perspectives.
2.2 Background
The rationale for creative education in schools
A general basis for the role of creative education in schools can be found in the Education Reform Act5(1988) which requires schools to provide a curriculum which:
is balanced and broadly based;
promotes the spiritual, moral, cultural, mental and physical development of learners at school and of society; and
prepares young people for the opportunities, responsibilities and experiences of adult and working life.
The role for creative education in helping to deliver these aims was not clearly articulated, however, until 1998 and the formation of the National Advisory Committee
on Creative and Cultural Education (NACCCE).Their 1999 report entitled “All Our Futures: Creativity, Culture and Education”6set out an explicit agenda for the
development of creative and cultural education in schools.
The report concluded that whereas historically the dominant global companies were concerned with industry and manufacturing, key corporations were increasingly being found in the fields of communications, information, entertainment, science and technology. The report added that many businesses were paying for their staff to participate in courses to promote creative abilities, and to teach the skills and attitudes considered essential for economic success in the creative industries but
which the education system was not designed to promote7.
Given the importance of creativity in the workplace, and with the Education Reform Act emphasising the role for education in equipping young people for working life, the report concluded that developing creative abilities could benefit all young people and should, therefore, be seen as a general function of education.
5
Education Reform Act (1988) Part I Preliminary “Duties with respect to the curriculum”
6
National Advisory Committee on Creative and Cultural Education, “All Our Futures: Creativity, Culture and Education” (1999)http://www.cypni.org.uk/downloads/alloutfutures.pdf
7
Ibid. p14
2.3 Creative Partnerships
Background to Creative Partnerships
Creative Partnerships was first established as a two-year pilot scheme in 2002 in 16 local areas, and was rolled out nationally from 2004. By pairing the skills of creative
practitioners, such as artists, performers and architects, with teachers, Creative Partnerships aims to help to make the curriculum more accessible to young people by providing alternative, more creative ways for learners to engage with it while increasing their motivation for learning.8
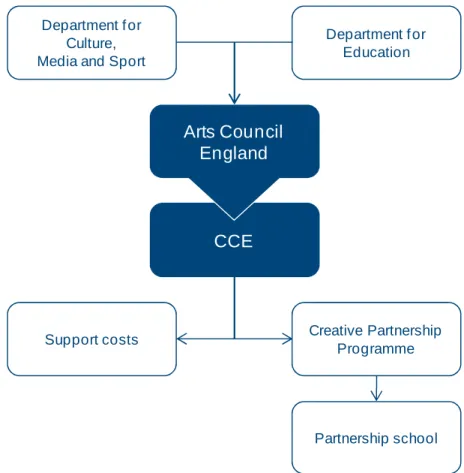
Funded mainly by the Department for Culture, Media and Sport (DCMS) but also by the Department for Education (DfE), the scheme was led by the Arts Council England (ACE). Since 2009, leadership for running the programme has rested with CCE.
Figure 1 shows the relationships between the various bodies responsible for bearing the programme’s costs.
Figure 1: Creative Partnerships funding relationships
CCE
Department f or Culture, Media and Sport
Department f or Education
Arts Council
England
Support costs Creative Partnership Programme
Partnership school
8
The programme uses a matched funding model, where participating schools are required to contribute towards the costs of running individual programmes. In terms of how Creative Partnerships actually works in schools, all individual programmes are designed to broker relationships between creative practitioners, schools and early years settings, particularly in deprived areas.
In schools, the starting point is to use the school’s own ‘School Improvement Plan’ (SIP) or ‘School Development Plan’ (SDP), to inform how the programme is to be developed, and what the needs of the school are in terms of the most appropriate creative association. Creative professionals then come in to the school, or learners undertake activities either inside or outside of the classroom.
The aim of each programme is to transform teaching and learning into a more creative process, and not to facilitate one-off events or extra-curricular activities. Creative Partnerships also supports Initial Teacher Training and training for in-service staff, focusing on the development of more creative teaching methods and increasing the capacity of teaching staff to liaise with creative professionals.
The structure of Creative Partnerships
Since its inception in 2002/3, there has been two significant changes to the programme – one to the structure of Creative Partnerships, occurring in 2007/8, and the other in the administration of the programme. In terms of the programmes structure, pre-2007/8 the participating schools fell into five categories:
Level 1 schools – comprising of between 15 and 25 ‘core’ schools, selected at the start of the programme, these schools received significant investment in
projects. Initially, these school programmes hosted a broad range of projects designed to explore learning needs, capabilities and overall ambitions. In many cases these developed into whole school approaches, with a high level of senior management engagement, considerable Continuous Professional Development (CPD) training and reaching most, if not all, young people in the school. Many ‘core’ schools were developed as ‘exemplars’ and became advocates for Creative
Partnerships work across the school and cultural sectors, and continued to encourage good practice after the Creative Partnerships has ceased to be active9.
Level 2 schools – these schools, which worked closely with Level 1 schools, often in formal pairings or clusters, enjoyed high levels of CPD training, hosted a
number of projects, inputted to and/or presented at conferences and developed long term relationships with the Creative Partnerships area office. Some of
these schools also assumed responsibility for disseminating good practice to other schools in their areas after Creative Partnerships had ceased to be active10.
9
Creative Partnerships exciting minds, “Creative Partnerships Five Levels of Engagement”
10
Levels 3 to 5 schools – these schools had only very light interaction with Creative Partnerships, such as teachers benefitting from CPD plans designed by
Creative Partnerships, or learners attending, participating or contributing to projects from one or more of the core schools11.
This structure changed in 2007/8 in favour of a more streamlined, three-strand model.
Schools of Creativity (SoC) – this is focused on a relatively small number of schools that already have strong creative practices. Building on what those schools
have already achieved, the programme allows these schools to be trailblazers in approaches to creative learning on a local level, and allows them to invest in cutting edge research and innovative ways of outreach with the wider school community. At a national level, SoCs play a leading role in the strategic leadership of Creative Partnerships. SoCs receive a £20,000 grant, which includes £15,000 towards the programmes costs and £5,000 towards the creative agents’ fees.
To receive this, the school is required to make a cash contribution of £5,000. This takes the total annual budget to £25,00012.
Change Schools – this is aimed at bringing sustainable change to schools in areas facing significant challenges. Schools that apply to be Change Schools need
to show a commitment to making creative learning central to their development plans. This intensive programme can last between one and three years, and supports creative development of the whole school. Creative Partnerships provides 75% of the cost of programmes run in each Change School which amounts
to approximately £15,000 per year, therefore requiring a £5,000 contribution from individual schools. Funding is available for a maximum of three years13.
Enquiry Schools – this is for schools at the ‘entry level’ of creative learning. The Enquiry Schools programme allows school to engage in a one year programme
targeted at specific learners and teachers. Creative Partnerships provides 75% of the project costs (approximately £3,000) and schools contribute £1,00014..
Finally, in terms of programme administration, in April 2009 Arts Council England demerged Creative Partnerships and set up a new organisation, CCE, to run the programme on its behalf. In addition to administration, CCE is responsible for the actual delivery of some individual school programmes, however in the majority of cases delivery responsibilities rest with a network of 25 organisations, some public sector and others private sector, known as Area Delivery Organisations (ADOs) which are directly funded by CCE. In the Change and Enquiry School programmes, an ADO will work with the local authority to shape their eligibility and selection
criteria in a way that targets specific indices of deprivation or other local issues15. These criteria, detailed in the programme application form16, must then be approved
by CCE before they can be used. At the school level, the overall process covering application, selection, planning and evaluation, (including the Creative School
11
Ibid
12
Creativity Culture and Education, “Schools of Creativity Handbook – a practical guide to running your Schools of Creativity programme” http://www.creative-partnerships.com/data/files/schools-of-creativity-handbook-240.pdf
13
Culture Creativity and Education, “Change Schools – Prospectus for Schools” (2010)http://www.creative-partnerships.com/data/files/change-schools-prospectus-for-schools-75.pdf
14
Culture Creativity and Education, “Enquiry Schools – Prospectus for Schools” (2010)http://www.creative-partnerships.com/data/files/enquiry-schools-prospectus-for-schools-78-78.pdf
15
Prior to the three-strand model, local Creative Partnership schools were selected to cover particular local authorities based on indices of deprivation.
16
Development Framework), again, is designed specifically for Creative Partnerships to work with schools, identify the issues they needed to address, and target resources accordingly.
Profile of Creative Partnerships participants
Table 3 shows the number of schools that are involved in each of the programmes that make up Creative Partnerships, and Table 4 shows the number of
programmes by type of school. These tables, however, are not without exception. Owing to limitations in pre-2008 data around Level 2 data17, it has been
necessary to remove these schools from these and all subsequent tables. Level 2 schools are, therefore, also omitted from the cost benefit analysis. Additionally, Levels 3 to 5 schools are also excluded from the analysis because of the lack of evidence around the impact of these interventions on attainment.
All tables cover the period between 2002/03 and 2008/09. At this point it is important to note that the data and analysis in these tables and throughout the report are based on information provided by CCE in their capacity as sole owners of the data. PwC have therefore not undertaken any verification of this data.
Table 3: Number of schools involved in Creative Partnerships by type of school
Creative Partnerships Nursery Schools Primary Schools Secondary Schools Other institutions Total
Level 1 schools 20 494 235 85 834
Schools of Creativity 3 24 24 5 5618
Change Schools 9 283 147 30 469
Enquiry Schools 12 627 136 14 789
Total 44 1,428 542 134 2,148
Source: CEE management information
As Table 3 shows, Primary schools make up more than half of all schools that have been involved in Creative Partnerships. ‘Other institutions’ refers to Learner Referral Units, Special schools, newly formed schools, community schools, etc.
17
There appeared to be irreconcilable differences when trying to comparing Level 2 data with other schools data, such as the schools census. For example, numbers of learners exposed in some schools appeared significantly different to total number of learners according to the schools census.
18
Table 4: Number of projects by type of school
Creative Partnerships Nursery Schools Primary Schools Secondary Schools Other institutions Total
Level 1 258 5,174 3,053 917 9,402
Schools of Creativity19 N/A N/A N/A N/A N/A
Change Schools 10 325 155 59 549
Enquiry Schools 13 640 137 87 877
Total 281 6,139 3,345 1,063 10,828
Source: CCE management information
As one would expect given the profile of school involved, the majority of school-level projects are focused on primary school learners.
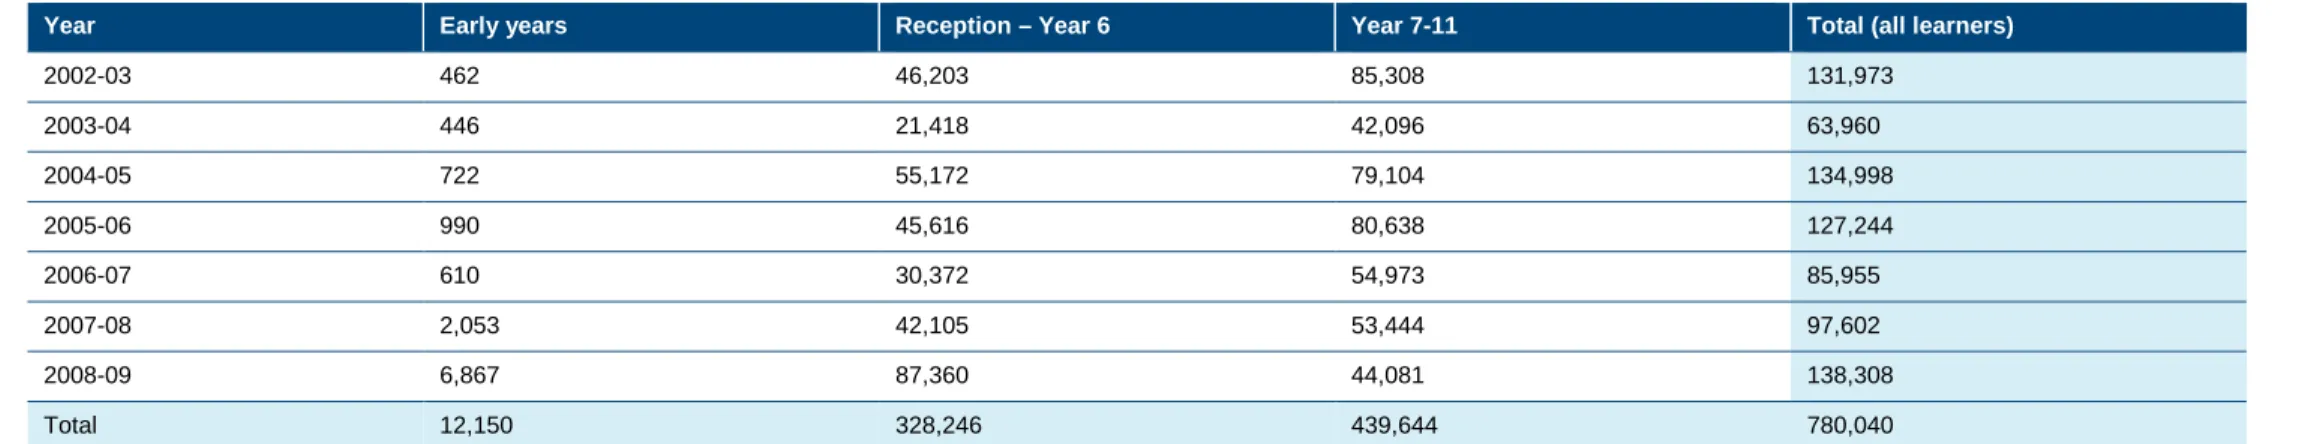
Table 5 and Table 6 show the number of learners by the different programmes and by academic year respectively. The column headings are different from earlier tables to reflect the fact that some primary schools will have nursery school learners and some secondary schools will have primary school learners.
Table 5: Number of learners by Creative Partnerships and type of school
Creative Partnerships Early years Reception – Year 6 Year 7-9 Year 10-11 Total (all learners) Total (year 7-11)
Level 1 3,761 213,083 269,377 101,084 587,305 370,461
Schools of Creativity 405 8,594 17,366 8,683 35,048 26,050
Change Schools 5,815 56,867 27,363 5,948 95,993 33,311
Enquiry Schools 2,978 58,422 9,446 2,244 73,090 11,690
Total 12,959 336,966 323,552 117,959 791,436 441,511
Source: CCE management information
The bulk of learners exposed to Creative Partnerships are between Reception and Year 9. There are two drivers of this finding. The first is that, as seen in the previous table, the majority of projects are aimed at primary school learners, so one would expect to see a large number of learners between Reception and Year 6 exposed to Creative Partnerships. However, secondary schools typically have more learners than primary schools. So the second driver of the finding is that even though fewer projects are aimed at learners in Years 7-9, the number of learners exposed per project is higher in secondary schools than in primary schools. 19
Table 6: Number of learners by academic year20
Year Early years Reception – Year 6 Year 7-11 Total (all learners)
2002-03 462 46,203 85,308 131,973 2003-04 446 21,418 42,096 63,960 2004-05 722 55,172 79,104 134,998 2005-06 990 45,616 80,638 127,244 2006-07 610 30,372 54,973 85,955 2007-08 2,053 42,105 53,444 97,602 2008-09 6,867 87,360 44,081 138,308 Total 12,150 328,246 439,644 780,040
Source: CCE management information
Over time there has been a shift in the focus of Creative Partnerships, from targeting years 7-11 learners in the earlier years of the programme to focusing more on primary school learners in later years.
Finally, Figure 2 and Figure 3 show the spread of Creative Partnerships schools by local authority (the first showing local authorities beginning with the letters A-M and the second N-Z).
20
Figure 2: Percentage of primary and secondary schools involved in Creative Partnerships (A-M) 0% 10% 20% 30% 40% 50% 60% 70% Ba rn sle y Bir mi ng ha m Bla ck bu rn wi th Da rw en Bla ck po ol Bo lto n Br ad for d Br en t Br igh to na nd Ho ve Br ist ol Bu ck ing ha ms hir e Bu ry Ca lde rd ale Co rn wa ll Co ve nt ry Cu mb ria Da rli ng to n De rb y De rb ysh ire De vo n Do nc ast er Do rse t Du dle y Du rh am Ea lin g Ea st Rid ing of Yo rks hir e Ea st Su sse x En fie ld Ess ex Ga te sh ea d Gl ou ce ste rsh ire Gl ou ce ste rsh ire Gr ee nw ich Ha ck ne y Ha lto n Ha mm er sm ith & Fu lha m Ha mp sh ire Ha rin ge y Ha rin ge y Ha rtl ep oo l Isl eo fW igh t Isl ing to n Ke nt Kin gst on -up on -H ull Kir kle es Kn ow sle y La mb et h La nc ash ire Le ed s Le ice ste r Le ice ste rsh ire Le wi sh am Lin co lns hir e Liv er po ol Ma nc he ste r Me dw ay Mi dd les br ou gh Mi lto nK ey ne s % LEA Primary Secondary
Figure 3: Percentage of primary and secondary schools involved in Creative Partnerships (N-Z) 0% 10% 20% 30% 40% 50% 60% 70% 80% Ne wh am No rfo lk No rth Ea st Lin cs No rth Lin co lns hir e No rth Lin co lns hir e No rth Ty ne sid e No rth am pt on sh ire No rth um be rla nd No tti ng ha m No tti ng ha ms hir e Ol dh am Ox for ds hir e Ply mo ut h Po rts mo ut h Re ad ing Re db rid ge Re dc ar & Cle ve lan d Ro ch da le Ro th er ha m Ru tla nd Sa lfo rd Sa nd we ll Se fto n Sh eff iel d Sh ro ps hir e Slo ug h So lih ull So me rse t So ut hG lou ce ste rsh ire So ut hT yn es ide So ut ha mp to n So ut he nd So ut hw ark St He len s Sta ffo rd sh ire Sto ck po rt Sto ck to n-o n-T ee s Sto ke -on -Tr en t Su nd er lan d Su nd er lan d Su rre y Sw ind on Ta me sid e Te lfo rd & W re kin Th ur ro ck To we rH am let s Tra ffo rd W ak efi eld W als all W alt ha m Fo re st W arw ick sh ire W es tB er ksh ire W es tS us se x W iga n W ind so ra nd M aid en he ad W irr al W olv er ha mp ton W or ce ste rsh ire % LEA Primary Secondary
As Figure 2 and Figure 3 show, Creative Partnerships operates in a large number of local authorities. In the majority of cases, both primary and secondary schools in those areas have been involved in the programme, but there is a noticeable lack of uniformity in the take up of programmes across primary and secondary schools and across the different local authorities.
3.1 Introduction
This section provides an overview of the approach used to estimate the costs and benefits of Creative Partnerships.
Before examining the approach in detail, it is worth noting that this report is based on secondary analysis only, which means that it has been prepared by collating and synthesising existing evidence, either provided by CCE or otherwise, in a coherent economic framework.
3.2 Approach
The approach used to estimate the economic costs and benefits of Creative Partnerships is based on the development and application of a logic model. This provides a high level map of the transmission mechanism through which inputs, stimulated by Creative Partnerships, deliver impacts to each of the potential beneficiaries. This approach has a number of potential advantages:
The way in which an intervention affects its targeted population can be easily followed;
Possible unintentional effects of the programme on certain groups of the population, which may otherwise be overlooked, can be more easily be identified and
captured; and
These high level maps can be a useful guide to the modelling process, by firstly indicating the types of data required to build the model, and secondly providing a
framework on which the data can be overlaid and the model constructed.
As far as possible, within the constraints of the available data, an approach which is consistent with the requirements of HM Treasury Green Book21, the
Government’s guide to evaluation and appraisal, has been used. To that end, the benefits are measured at the whole economy level and, as stated in the Introduction, the principal interest lies in measuring the net impact.
3.3 Methodology
A logic model, or chain, is a systematic way of presenting and sharing understanding of the relationships among the resources operating a programme, the planned activities, and the anticipated changes or result:
21
HM Treasury, “The Green Book – Appraisal and Evaluation in Central Government”http://www.hm-treasury.gov.uk/d/green_book_complete.pdf
Figure 4: Logic chains structure
Impact
Outcomes
Resources/
Inputs
Activities
Outputs
Planned work
Intended results
The planned work describes what resources are needed to implement the programme and what activities are intended:
Resources/inputs – include human, financial, organisational and community resources a programme has available to direct towards doing the work; and
Activities – what the programme does with the resources; the processes, tools, events, technology and actions that are an intentional part of the programme’s
implementation. These interventions are used to bring about intended changes or results. The intended results define the programme’s desired results (outputs, outcomes and impact):
Outputs – direct products of programme activities and may include types, levels and targets of services to be delivered by the programme;
Outcomes – specific changes in programme participants’ behaviour, knowledge, skills, status and level of functioning; and
Impact – the fundamental intended or unintended changes occurring in organisations, communities or systems as a result of programme activities.
The logic chain developed in this report focuses around essentially three main beneficiary groups: learners, parents, and teachers (and by extension schools). However, for reasons that become apparent in the logic chain below, benefits to parents are captured within the learner strand.
Figure 5 shows the logic model that was developed to illustrate the impact of Creative Partnerships, and which is based on an extensive review of the available literature.
Figure 5: Logic chain depicting the impact Creative Partnerships has on stakeholders
Impact
Outcome
Inputs / activities
Output
Wider economic benefit of more highly skilled
workforce Pupils can demonstrate
independent learning skills
Creative Partnerships
Improvement in pupils’ ability to understand and
retain information
Increased lifetime earnings for pupil Pupils attain higher KS2
/ GCSE results Increased skills in
independent learning
Reduced social cost of truancy Reduction in pupil absence rates Increase in motivation for learning Increase in parental engagement in pupils’ education Increase in CPD for teachers Increased discipline in classrooms Creative Partnerships
P
u
p
il
s
/
P
a
re
n
ts
S
c
h
o
o
ls
/
Te
a
c
h
e
rs
Spillover effect within the same school Increased teacher skills
Improvement in teacher / staff morale Increase in teacher retention rates Recruitment cost saving to schools Source: PwC analysis
Inputs and Activities
The input and activities are both represented by ‘Creative Partnerships‘ to reflect both parts of the programme, its funding (input) and the individual school programmes (activities).
Outputs
Learners and parents – Increased understanding of the curriculum, higher independent learning abilities and better motivations for learning are likely to be the outputs for learners from Creative Partnerships activities. In addition, as a consequence of higher GCSE attainment, Creative Partnerships also raises the likelihood of progression to further and higher education. Increased parental engagement in learner’s education is also likely have a beneficial impact on learner attainment. This is an important point from a modelling perspective because it suggests that, to avoid double counting, parental outputs need only be accounted for in the learner attainment impacts and not separately. For this reason, learner benefits that are measured in Section 4 are implicitly assumed to include the impact of parental engagement.
Schools and teachers – Higher CPD is expected to directly result from Creative Partnerships as teachers learn and apply new teaching techniques. Greater engagement from learners may also results in higher levels of discipline and therefore fewer disruptions in the classroom.
Outcomes
Learners and parents – The result of Creative Partnerships will be to improve attainment at GCSE. The development of more creative thinking, which can result in higher quality employees and employment, can be considered as a benefit to employers but also to wider society to the extent that society benefits from a more highly skilled, engaged population. Following on from parental outputs, outcomes of greater parental involvement will be captured in learner attainment outcomes. Additionally, parental involvement will also play a role in reducing rates of truancy and exclusion.
Schools and teachers – By raising their levels of motivation, teachers will benefit from Creative Partnerships through the uplift in skills that comes from more CPD and a general boost in morale.
Impacts
Learners and parents – Higher attainment will lead to increases in the lifetime earnings potential of learners.
Schools and teachers – Skills development in teachers will feed into wider learner benefits outside directly impacted learners (i.e. spillover effects). Moreover, more motivated teachers are more likely to stay in place longer, which increases retention rates and reduces recruitment costs faced by schools. Additionally, increased parental engagement and the effect it has on truancy reduction will benefit the school in terms of avoided truancy costs.
Society at large will also benefit. With higher engagement and lower truancy will come a lower incidence of exclusion, which means the avoidance of costs associated with exclusion. More educated learners today means a more educated workforce tomorrow which clearly has societal impacts, for example through reduced crime, not to mention the benefit to employers.
But as well as intended impacts there may also be some unintended impacts that should not be ignored in the evidence collection process. For example, a positive unintended consequence could be schools choosing to employ creative professionals outside of the programme and within their own budgets after a Creative Partnerships intervention has finished.
As mentioned previously, logic models provide a useful guide in the modelling process, both in terms of defining the data requirements and in model construction. The costs and benefits in the following two sections have therefore been derived using Figure 5 as a guide.
4.1 Introduction
This section of the report identifies and analyses the annual costs of Creative Partnerships. The costs and benefits estimated in this report occur over a number of years, which means that they cannot be compared on a like-for-like basis. Discounting is a method used by economists to compare costs and benefits that occur in
different time periods, because it converts those costs and benefits into common, ‘present value’ terms22. All discounting adjustments made in this report have been
made using HM Treasury Green Book methodology23.
4.2 Overview of costs
Table 7 shows the overall funding granted to finance Creative Partnerships by central government departments, and how that funding was distributed. Note that all figures presented have been adjusted to reflect 2008/9 prices.
Table 7: Annual financing of Creative Partnerships (£m)
Academic Year
Funding Expenditure Total cost
DCMS DfE
Direct Programme
Expenditure Set up costs
24 Grants to
schools Schools Contribution
Admin costs 25 Undiscounted Discounted to 2008-09 2002 - 03 17.5 0.0 0.0 6.5 0.0 0.0 1.6 8.0 10.0 2003 - 04 17.5 0.0 21.7 0.0 0.0 5.0 26.7 31.9 2004 - 05 32.4 2.8 18.0 5.3 1.8 7.3 32.3 37.3 2005 - 06 35.3 2.7 15.7 13.4 4.5 6.9 40.4 45.0 2006 - 07 35.8 2.6 15.9 18.4 6.1 8.4 48.9 52.5 2007 - 08 35.6 2.6 11.5 20.4 6.8 7.7 46.3 47.9 2008 - 09 39.5 2.5 6.7 32.5 10.8 5.3 55.3 55.3 Total 217.2 10.6 89.4 90.0 30.0 42.1 257.9 279.9 22
Discounting is based on the principle that generally people prefer to receive goods and services now rather than in the future.
23
HM Treasury, “The Green Book – Appraisal and Evaluation in Central Government”http://www.hm-treasury.gov.uk/d/green_book_complete.pdf
24
Estimated assuming firstly that that the difference between funding and administrative costs are set up costs, and secondly that the amount left over in the 1styear is used to fund the overspend in 2003-4
25
Includes training and support costs
Source: Arts Council England Annual Report and PwC analysis
As explained in Section 2, Creative Partnerships uses a matched funding formula where each school that joins the programme makes a contribution to project costs, fixed at a third of the grant provide by Creative Partnerships. At the school level, therefore, 25% of the total costs of each programme is picked up by the
participating school, and has been estimated and reported in the ‘schools contribution’ column on that basis.
To present the costs in present value terms, 2008-09 has been used as the base year. Additionally, the Green Book prescribed annual discount rate of 3.5% has been used, and the discounted costs are reported in the final column. We therefore estimate a total discounted cost of Creative Partnerships of almost £280m. The undiscounted total of just under £260m comprises funding of £30m from Creative Partnerships schools, with the balance from central government sources.
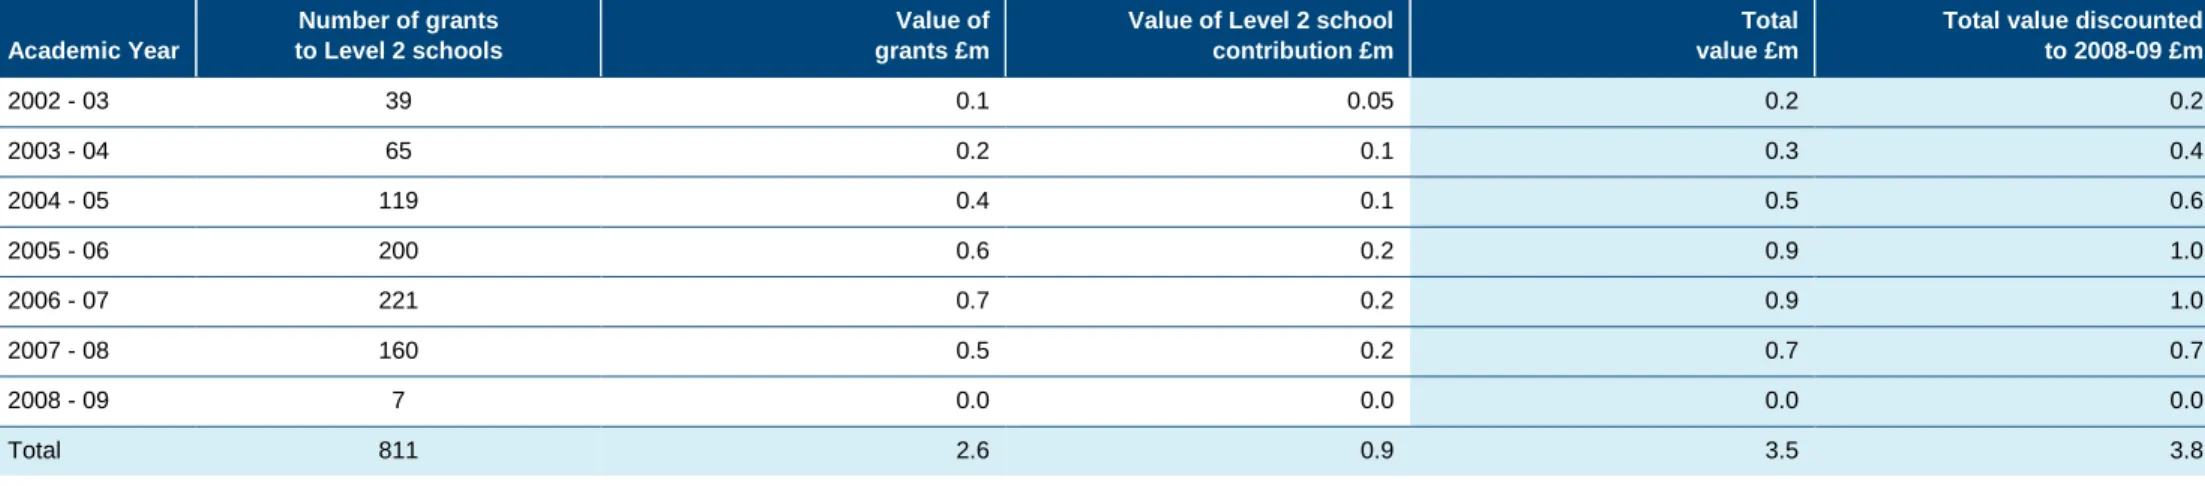
The cost estimates as reported in Table 7 include all schools that participated in Creative Partnerships,includingLevel 2 schools. As discussed in Section 2, data
quality issues require that Level 2 schools be omitted from the analysis. There were a total of 477 Level 2 schools, accounting for 811 grants between 2002 and 2008. The Enquiry School programme was based on the Level 2 school programme, which suggests that for each year the programme was delivered, £1000 was contributed by the Level 2 school, and £3000 was given by Creative Partnerships. Using that ratio, Table 8 shows our estimates of the costs of administering Level
2 of the programme between 2002 and 2008. These costs have then been removed from of the cost estimates26reported in Table 7.
Table 8: Level 2 estimated costs
Academic Year
Number of grants to Level 2 schools
Value of grants £m
Value of Level 2 school contribution £m
Total value £m
Total value discounted to 2008-09 £m 2002 - 03 39 0.1 0.05 0.2 0.2 2003 - 04 65 0.2 0.1 0.3 0.4 2004 - 05 119 0.4 0.1 0.5 0.6 2005 - 06 200 0.6 0.2 0.9 1.0 2006 - 07 221 0.7 0.2 0.9 1.0 2007 - 08 160 0.5 0.2 0.7 0.7 2008 - 09 7 0.0 0.0 0.0 0.0 Total 811 2.6 0.9 3.5 3.8 Source: PwC analysis 26
4.3 Summary
The following table summarises our total cost figures in 2008/9 prices. We estimate the total cost of Creative Partnerships of £276m.
Table 9: Total Costs Creative Partnerships (£m)
Academic Year
Total cost including Level 2 schools
Total cost of grants to Level 2 schools
Total cost discounted to 2008-09 2002 - 03 10.0 0.2 9.7 2003 - 04 31.9 0.4 31.6 2004 - 05 37.3 0.6 36.7 2005 - 06 45.0 1.0 44.0 2006 - 07 52.5 1.0 51.5 2007 - 08 47.9 0.7 47.3 2008 - 09 55.3 0.0 55.3 Total 279.9 3.8 276.0 Source: PwC analysis
5.1 Introduction
In this section, we estimate the potential economic benefits of Creative Partnerships. Of particular relevance is the programme’s impact on education and employment, as these are the areas most likely to provide the greatest scope for financial impact.
Informed by the logic chain, the benefits are estimated with respect to two principal beneficiary groups; learners and parents, and schools and teachers. In practice, the bulk of the benefit is likely to accrue to the first group. Additionally, there are likely to be wider benefits, such as reductions in crime, which we have also tried to estimate.
The section begins with an overview of the available evidence that supports the case for benefits to the two principal beneficiary groups. The report then examines
in turn the benefits to learners and parents27, schools and teachers and any wider benefits. In each case the report covers both how the benefits have been
estimated and the estimates themselves. The individual estimates are then aggregated to give the total benefits of Creative Partnerships.
It is worth highlighting at this point some important considerations before looking in more detail at the evidence and estimates. The first is the general, implicit assumption we have made about the impact of Creative Partnerships. The realisation of benefits will not simply be assured by the provision of creative programmes, but will depend on many other factors such as the type of creative intervention, or the effort individual schools make to effectively integrate programmes into the
curriculum28. However, the modelling process can not cater for such heterogeneity in school approaches or programmes, and instead assumes that each school is
impacted in the same way29. Evidence from Ofsted30, who note the efforts CCE have made to ensure consistency in the way schools integrate programmes into the
curriculum, suggests that this is a reasonable assumption.
The second point is that the evidence on which the impacts are based is assumed to remain relevant. The importance of this assumption will become clearer in the next section.
The final point concerns the importance of recognising the potential lags between delivery of a Creative Partnerships intervention in a school and realisation of the benefits. These lags will depend on the age of the learner when the programme is delivered relative to Key Stage 4 (KS4). Related to this, there will be some beneficiaries who will not yet have reached KS4, but it is necessary to include them because the cost of intervention has already been incurred.
27
Where parental benefits are implicitly captured in learner attainment impacts, as shown in the logic chain
28
OFSTED (2010) “Learning: creative approaches that raise standards”. http://www.ofsted.gov.uk/Ofsted-home/Publications-and-research/Browse-all-by/Documents-by-type/Thematic-reports/Learning-creative-approaches-that-raise-standards/(language)/eng-GB
29
Though its worth noting that Creative Partnerships do recognise the importance of these other factors and, through using instruments like planning and evaluation frameworks, try to ensure that best practice happens more often across the programme
30
OFSTED (2010) “Learning: creative approaches that raise standards”, p40
5.2 Overview of the evidence
Learners and parents
In 2008, the National Foundation for Educational Research (NFER) reported that the academic progress (as measured by performance at KS4 in terms of GCSE grades) of young people attending Creative Partnerships activities was greater than that of other young people in the same schools, as well as similar students from
different schools.31Based on 2002 and 2003 data, the study took account of a variety of control factors such as ethnicity, prior attainment and economic
disadvantage32. A central finding was that young people who have attended Creative Partnerships activities made, on average, the equivalent of 2.5 grades better
progress at GCSE than similar young people in other schools33. This result is instrumental to the way benefits have been estimated in this report, on the assumption
that though based on 2002 and 2003 data, the 2.5 grade impact remains unchanged.
The NFER report also implied a slightly positive indirect impact of Creative Partnerships on learners who have not been impacted directly within the same school34.
This could be through the medium of their teachers becoming exposed to new methods of curriculum delivery, and exporting new practices to other classes.
However, the report does not find this effect to be statistically significant in secondary schools.35
The CASE report36, which looked more generally at the impact of creative education, supports these results. The report rated the NFER study as medium/high
quality, and placed confidence in the interpretation of the differences between exposed and unexposed learners in the study as valid indictors of the effects of Creative Partnerships. The report also found that creative education had a 1-2% positive impact on academic attainment; a 16-19% effect on cognitive ability test scores; and a 10-19% effect on transferable skills test scores.
A further report by NFER (2008) documented the link between the Creative Partnerships and learner behaviour. It analysed two criteria: learner absence (truancy) and exclusion rates. Although a statistically significant relationship was found between Creative Partnerships and reduced learner absence and exclusion rates in
primary schools, no such relationship was found to exist in secondary schools37.
31
Kendall, L., Morrison, J., Sharp, C. and Yeshanew, T. “The longer-term impact of Creative Partnerships on the attainment of young people: Results from 2005 and 2006”, (2008) NFER pp17-19
32 Ibid. p4 33 Ibid. piii 34 Ibid, p14 35 Ibid. p18 36
The Culture and Sport Evidence (CASE) Programme, “Understanding the impact of engagement in culture and sport – a systematic review of the research on the learning outcomes for young people partipating in the arts” (2010) http://www.artscouncil.org.uk/media/uploads/case_systematic_review_arts_participation.pdf
37
Evidence of the qualititative benefits of Creative Partnerships can be found in the 2006 assessment of its impact by Oftsed, where it was found that most of the
programmes were effective in developing learners’ ability to improvise, take risks, show resilience, and collaborate with others38. In some cases, learners
demonstrated a clear understanding of the relevance of teamwork, meeting deadlines and how to resolve the needs of others through negotiation, modification and compromise39, all skills considered valuable to employers40.
The report also documented an anecdotal link between Creative Partnerships and an improvement in learner behaviour and attendance41. It reported that during the
programme, those with usually poor attendance showed a significant improvement and that in a significant proportion of schools, improvements in some learners’ attitudes and behaviour during projects signalled the start of their return to schooling.
There is a considerable body of evidence documenting the value of parental involvement in a child’s learning, and the positive impact this has on the child’s
attainment.42 Further studies extend parental influence to other key factors in academic success, such as better school attendance and fewer behavioural
problems.43 Other research has shown that the child is the primary driver for parental engagement44, and that the more engaged the child is by what takes place
within the classroom, the greater the likelihood of active parental involvement. There is evidence that Creative Partnerships generates opportunities for more active
parent-child communication by providing a more engaging learning experience for students45. In our analysis, we have assumed that this effect is captured by the
learner’s attainment and behaviour, so is not considered separately. From the research above, it is however, reasonable to assume that some of this impact has come indirectly as a result of parental involvement as opposed to directly from Creative Partnerships.
Schools and teachers
OFSTED (2010) point out that good professional development of teaching staff within the school was a key factor in helping teachers to encourage and assess creative approaches to learning and improve their subject knowledge. Externally produced resources and short training courses had limited impact without local
38
OFSTED (2006) “Creative Partnerships: initiative and impact (The impact of sustained partnerships between schools and creative practitioners as a result of Creative Partnerships initiatives)”p6
http://www.creative-partnerships.com/data/files/ofsted-report-25.pdf
39
Ibid. p8
40
Though the report notes that the learners themselves were in many cases unclear about how to apply these skills
41
Ibid. pp9 – 10
42
For example see Fan, X. T., & Chen, M. (2001) “Parental involvement and students' academic achievement: A meta-analysis.” Educational Psychology Review, 13, 1–22
43
Melhuish, E. Sylva, C. Sammons, P. Siraj-Blatchford, I. & Taggart, B. (2001).”Social, behavioural and cognitive development at 3-4 years in relation to family background. The effective provision of pre-school education. EPPE project”. DfEE: London: The Institute of Education
44
Desforges, C. & Abouchaar, A. (2003) “The Impact of Parental Involvement, Parental Support and Family Education on Pupil Achievement and Adjustment: A Literature Review “ London: DfES Research Report 433, 2003
45
training and continuing in-school support46. The report identified the role of Creative Partnerships in encouraging teachers to engage in further CPD, which in turn had a beneficial effect on motivation and retention.
A further NFER report developed an impact typology on teaching staff within a Creative Partnerships school. By surveying staff in different schools, the report presented some qualitative evidence that suggests teachers not only develop their classroom practice and curriculum from working with Creative Partnerships, but
that the impacts extended beyond the immediate focus on creativity to interpersonal and leadership impacts, as well as impacting positively on their careers47. For
example, around one third of teachers said that Creative Partnerships had “enhanced their enthusiasm for their job”48. This has the potential to lead to improved staff
retention rates, which reduces the costs of recruitment for schools.
5.3 Valuation of benefits
Learner benefits
We used a three stage process to derive the learner benefits:
Estimating the percentage of learners achieving 5 ‘good’ GCSE as a result of participation in the Creative Partnerships:
Applying the estimate to the Creative Partnerships population; and
Applying the estimated lifetime earnings premium of qualifications estimates.
Estimating the percentage of learners achieving 5 ‘good’ GCSE as a result of participation in Creative Partnerships
From the evidence section it is clear that Creative Partnerships benefits all learners who are exposed to it. However, to estimate the economic benefits of the programme is it necessary to consider those impacts that are over and above what would have occurred in its absence (i.e. the incremental benefit). Key to this is the 5 ‘good’ GCSEs concept. Essentially, the percentage of learners who, having been impacted by Creative Partnerships, go on to achieve 5 ‘good’ GCSEs is
estimated. However, the crucial condition is that these learners wouldnothave achieved 5 ‘good’ GCSEs in the absence of Creative Partnerships. In effect, the
programme pushes them over that threshold.
46
OFSTED (2010) “Learning: creative approaches that raise standards”, p6
47
Lord, P., Lamont, E., Jeffes, J., Kinder, K. and Springate, S. (2010). “Evaluation of the nature and impact of Creative Partnerships Programme on the Teaching Workforce: Interim Report.” York: NFER. P4
48
Five ‘good’ GCSEs is a significant threshold because DfE analysis49shows that achieving these qualifications leads to higher lifetime earnings, which feeds into the third stage of the valuation methodology.
Calculation of the percentage of learners pushed over the threshold requires data on attainment at the individual learner level. Unfortunately CCE management information is only collected at the school level. This mean we need to look to other sources to get the necessary attainment data. The Pupil Level Annual School Census (PLASC) is such a source. PLASC contains individual level attainment data on all learners who have completed KS4 in state maintained education and, therefore, proved to be the best source of individual level data that we could use.
To estimate the percentages we first needed to link CCE data and PLASC, using the DfE school number and year of intervention, to give us a list of learners we expected to have been impacted by Creative Partnerships. Previous PwC analysis suggests that at a capped point score of 320 and above, learners are likely to
have achieved 5 A*-C GCSEs50. Using this figure together with the NFER result, expressed as 8 addition capped points, we estimated the percentage of Creative
Partnerships impacted learners achieving between 320 and 328 points, i.e. the number of learners achieving 5 ‘good’ GCSEs who would not have done so in the absence of Creative Partnerships. Table 10 shows the results of the analysis by year.
Table 10: Percentage of learners pushed over the 5 ‘good’ GCSE threshold by participation in the Creative Partnerships
Year Creative Partnerships schools Non-Creative Partnerships schools Total PLASC population Adjusted Creative Partnerships schools 2002 – 03 4.4% 5.1% 5.1% 4.4% 2003 – 04 6.3% 5.6% 5.6% 5.9% 2004 – 05 6.6% 5.8% 5.9% 6.4% 2005 – 06 7.2% 6.1% 6.2% 6.9% 2006 – 07 7.4% 6.1% 6.2% 7.4% 2007 – 08 7.0% 6.1% 6.1% 7.0% 2008 – 09 7.5% 6.3% 6.4% 7.5% Source: PwC analysis 49
Internal DfE analysis using LFS 2008/09 data, Mcintosh, S. “A Cost Benefit Analysis of Apprenticeships and other Vocational Qualifications” Research Report No. 834 (2007); and Jenkins, A. Greenwood, C. & Vignoles, A. “The Returns to Qualifications in England: Updating the Evidence Base on Level 2 and Level 3 Vocational Qualifications” Centre for the Economics of Education (2007)
http://www.education.gov.uk/~/media/A6E605E55BFA4B449A6EC9C92DC12660.ashx(p.10)
50
Aside from 2002, where we suspect the significantly smaller sample size may be having an effect, the percentages show a rising incremental impact of Creative Partnerships. However, looking across the non-Creative Partnerships and total PLASC populations, there appears to be a general rise in the percentage of learners achieving between 320 and 328 capped GCSE points. The final column accounts for this general rise over time by deflating the Creative Partnerships effect by the growth rate in non-Creative Partnerships school.
Applying the estimate to the Creative Partnerships population
Having estimated the percentage of learners impacted by Creative Partnerships, the next step was to estimate what that means in terms of the number of learners impacted. This was done by assuming that Creative Partnerships is delivered to all year groups in Level 1 (pre 2008 schools) and in Schools of Creativity. Using School Census data we could then estimate the average size of a school year in a given institution. For Enquiry and Change Schools, we used data from CCE which recorded the year group impacted for each programme.
The next stage was to estimate when each group of learners impacted by Creative Partnerships actually reached Year 11 or could be expected to reach it. This is important because it determines when the benefits start to accrue, or in other words, the point at which the learner has actually achieved 5 ‘good’ GCSEs. For younger learners in earlier year groups of secondary school, this meant projecting the total numbers of them reaching KS4 in future years.
With information on the number of Creative Partnerships impacted learners, when they reach Year 11, and applying the threshold percentages described earlier, we estimated the number of learners we expect will benefit from the Creative Partnerships in terms of getting 5 ‘good’ GCSEs. For future years (i.e. those who have been impacted but are yet to reach Year 11), we applied an average of the percentages found for the period 2002/03 – 2008/09 to estimate the numbers benefitting. An important point to note is that in the central assumption, we are assuming that only secondary school learners benefit from Creative Partnerships. There is as yet no evidence to suggest that Creative Partnerships has a statistically significant attainment impact on primary school learners. On that basis, including them among the attainment beneficiaries cannot be justified.
Applying lifetime earnings premium estimates
DfE analysis suggests that earning 5 ‘good’ GCSEs (a Level 2 (L2) qualification) leads to an extra £93k in earnings over a person’s lifetime51. Applying this estimate
to the number of extra learners estimated to achieve 5 ‘good’ GCSEs as a result of Creative Partnerships allowed us to express the benefits of the programme in monetary terms.
51
Department for Education, “Impact Assessment – Academies Bill’ (2010)http://www.education.gov.uk/~/media/A6E605E55BFA4B449A6EC9C92DC12660.ashx(Taking an average of the £100k impact for men and £85k impact for women)
Limitations
Three limitations are worth bearing in mind before reporting the benefits:
NFER is based on two years worth of data that are relatively old
In estimating the percentage of learners pushed over the threshold, we assume not only that the NFER measured effect continues to hold, but that it applies to all secondary school learners beyond Years 10 and 11 (on whom the study was based). To the extent that Creative Partnerships has learned from best practice, assuming the impact still holds unchanged could be considered to be a cautious assumption. However, until a further NFER-style study is conducted, we suggest maintaining this cautious approach.
What we have been able to do is to test the assumption that the impact does not apply to all secondary school learners, by restricting it to learners in Years 10 and 11 only. The results are reported later in the sensitivity analysis.
Profile of learners facing Enquiry Schools interventions assumed to mirror the rest of the year
An Enquiry School intervention will be focused on a subset of learners within a single year. However, since CCE management information is collected at the school level and not at the individual level, we are unable to identify precisely who these learners are. To link CCE data with PLASC, this forced us to effectively assume that the whole year has been impacted, and in doing so make the implicit assumption that the distribution of GCSE scores within the impacted group is similar to that of the whole year. It is difficult to say what the precise impact of this assumption is, given the lack of learner level information on Enquiry Schools. However,
assuming an ‘average’ distribution, without any evidence to suggest that these learners are sufficiently different from the average, is likely to be the most prudent approach.
Projecting future attainment impacts
Applying the NFER impact on the same basis to future projections is a fairly strong assumption for two reasons. Firstly, any change to the qualification system in the future or the way in which KS4 is assessed may render the projected part of our analysis invalid. Secondly, fluctuations in the percentage of learners being pushed over the threshold suggest that applying an average to these projections could either over or underestimate the true impact.
Results
Table 11 shows the estimated benefits to learners, expressed both in terms of the number of learners we expect to benefit from Creative Partnerships, and the value of those benefits.
Table 11: Number of learners benefitting and estimated value of those benefits
2002-03 2003-04 2004-05 2005-06 2006-07 2007-08 2008-09 2009-10 2010-11 2011-12 2012-13 2013-14 Total
Total number of learners exposed to Creative Partnerships
16,501 21,448 33,282 44,847 52,367 56,026 56,441 54,232 49,831 36,163 20,009 365 441,512
Total number of learners moved across the threshold of 320 capped KS4 points
726 1,259 2,122 3,076 3,875 3,922 4,233 3,518 3,232 2,346 1,298 24 29,631
Total increase in lifetime earnings(£m) 67.2 116.4 196.3 284.5 358.5 362.8 391.6 325.4 299 217 120 2.2 2,740.9 Discounted increase in lifetime earnings(£m) 83.2 139.1 226.3 316.6 384.9 375.9 391.6 314.0 278.4 195.0 104.1 1.8 2,810.93 Source: PwC analysis
Table 11 shows the number of learners completing KS4 between 2002/3 and 2008/9, who we estimate have been exposed to Creative Partnerships. In the second row, we estimate the number of learners achieving 5 ‘good’ GCSEs as a result of their exposure. This has been estimated by applying to the first row the
percentages from the CCE and PLASC analysis. Having estimated the number of learners benefitting from Creative Partnerships, benefits have been monetised by applying the lifetime earnings premium of L2 qualifications. This is reported in the third row. Finally, discounting using 2008/9 as the base and applying the HMT Green Book discount rate of 3.5% gives the discounted learner benefits.
Estimates in the table are projected to 2013/14 to reflect the fact that some learners who are currently being impacted will not sit their GCSE examinations until then. The table also shows that we estimate a total discounted learner benefit of £2.8bn between 2002/3 and 2013/14. As previously mentioned, this estimate of learner benefits assumes that benefits accrue only to those learners that are currently in secondary school. It also does not include learners in Level 2-5 schools pre-2007/8.
Wider benefits
In their 2008 paper52, Feinstein et al found that 1%-point increase in the proportion of the working age population with qualifications equivalent to L2 could reduce the
social costs of crime by up to £320 million per year. We have, therefore, estimated the percentage of learners across the country that Creative Partnerships has impacted annually in raising their attainment to this level. We have applied the value of £320m per 1% to obtain the benefits as shown below. We have assumed that this finding will continue to hold true into the future.
Limitations
As with the learner benefits, we are assuming that these estimates will hold for future cohorts.
Results
Table 12 gives our estimate of wider benefits from the Creative Partnerships.
Table 12: Wider benefits
2002-03 2003-04 2004-05 2005-06 2006-07 2007-08 2008-09 2009-10 2010-11 2011-12 2012-13 2013-14 Total
Number of extra learners achieving 5 ‘good’ GCSEs
726 1,259 2,122 3,076 3,875 3,922 4,233 3,518 3,232 2,346 1,298 24 29,631
Creative Partnerships learners moved across threshold as a percentage of all learners 0.11% 0.18% 0.31% 0.44% 0.54% 0.56% 0.62% 0.53% 0.49% 0.36% 0.20% 0.00% Value of educational attainment to society (£m) 34.1 57.4 97.7 140.5 174.1 179.0 199.3 168.7 158.3 115.5 63.5 1.2 1,389.3 Discounted value(£m) 42.2 68.6 112.7 156.3 187.0 185.5 199.3 162.8 147.5 103.8 55.1 1.0 1,421.8 Source: PwC analysis
The estimates of avoided social costs of crime, a benefit that accrues to wider society, are the second largest contributor to the overall benefit.
52
Feinstein, L., Rudge, D., Vorhaus, J. and Duckworth, K. “The Social and Personal; Benefits of Learning” (2008).
School and teacher benefits
As the logic model shows, we expect schools to benefit through avoiding the cost of recruiting teachers to replace those that leave, and through avoided truancy costs. The NFER teaching workforce report states that a third of teachers would be more likely to remain in their posts as a result of Creative Partnerships.
Assuming a constant teacher/learner ratio of 1/1553and the national average teaching staff churn rate (17.5%54) we have derived an indicative recruitment saving
benefit, further assuming that this NFER finding is accurate. Using the national average of £750 recruitment fee per teacher55, we have estimated the annual
benefits shown in Table 13 below.
To estimate avoided costs of truancy, we used a National Audit Office result which found that a reduction in absence by one day per learner (8 per cent) would
represent an educational loss reduction of around £127 million a year56. This is based on the irrecoverable costs expended on the education of an absentee. NFER
found that Creative Partnerships has a statistically significant impact on primary school attendance but not secondary school, so this estimate has been made using primary school learners only. Starting with the number of primary school learners impacted by the programme, the third row of Table 14 estimates what percentage of all learners this accounts for. Using the improvement attendance result from NFER and combining this with the NAO results, we then estimate the total benefit in terms of educational costs saved. These benefits only apply in the year that the programme is delivered, so we have only estimated the benefits until the year 2008-09, after which we are not considering further additional programme inputs.
Limitations
To estimate recruitment savings, we have assumed a constant teacher/learner ratio of 1/15 and an annual staff churn rate of 17.5%. The benefit value that we have estimated assumes that these will continue to hold true in the future. We have also used qualitative evidence to inform our view of the probability that a member of staff will remain in post as a result of exposure to Creative Partnerships. Qualitative evidence of this nature suffers from the well documented discrepancy between stated and actual behaviour. Even given these limitations, however, the total amount of benefit estimated is so low as to be relatively immaterial to the net result. Our estimate for truancy savings is driven primarily by the NFER research and the NAO finding cited above. Both of these have been used to project future impacts, so there is a risk that they may not continue to hold going forward. As with the recruitment savings however, the total benefit is not large enough to make a material difference to the net impact.
53
DfE School Workforce in England (including pupil:teacher ratios and pupil:adult ratios), January 2010 (Provisional) Table 15http://www.dcsf.gov.uk/rsgateway/DB/SFR/s000927/SFR11_2010.pdf
54
DfE School Workforce in England Survey January 2009 (Final) Table C2http://www.dcsf.gov.uk/rsgateway/DB/SFR/s000874/Addition_C.xls
55
Becta – “Economic Impact of technology in Schools” (2008). PricewaterhouseCoopers
56
Results
Table 13 and Table 14 show our estimate of the avoided recruitment and avoided truancy costs respectively. As the tables clearly indicate, the avoided recruitment and truancy costs savings are greatly overshadowed by the benefits that accrue to learners.
Table 13: Avoided recruitment cost estimates
2002-03 2003-04 2004-05 2005-06 2006-07 2007-08 2008-09 Total
Total number of learners exposed to Creative Partnerships 19,953 24,900 36,773 48,393 54,034 64,167 66,707 314,927
Total number of teachers 1,330 1,660 2,452 3,226 3,602 4,278 4,447 20,995
Total number of teachers who would move positions but for the Creative Partnerships
233 290 429 565 630 749 778 3,674
Total number of teachers who remain in posts as a result of the impact of the Creative Partnerships
77 96 142 186 208 247 257 1,213
Total recruitment cost saving (£m) 0.06 0.07 0.11 0.14 0.16 0.19 0.19 0.90
Total discounted cost saving (£m) 0.07 0.09 0.12 0.16 0.17 0.19 0.19 1.00
Source: PwC analysis
Table 14: Avoided truancy cost estimates
2002-03 2003-04 2004-05 2005-06 2006-07 2007-08 2008-09 Total
Total number of primary school learners with exposure to Creative Partnerships
46,665 21,864 55,893 46,606 30,982 44,836 94,226 341,072
Total number of primary school learners 4,597,335 4,527,947 4,458,109 4,382,663 4,328,125 4,291,153 4,277,761 30,863,093
Total number of primary school learners with exposure to Creative Partnerships as a percentage of all primary school learners
1.02% 0.48% 1.25% 1.06% 0.72% 1.04% 2.20%
Total in-year education cost saving(£m) 0.06 0.05 0.17 0.18 0.12 0.18 0.37 1.1
Total discounted saving(£m) 0.08 0.06 0.20 0.20 0.13 0.18 0.37 1.2