School of Health Sciences
SOCIOECONOMIC STATUS, OVERWEIGHT AND WAIST
CIRCUMFERENCE IN 3-6 YEAR OLD FINNISH PRESCHOOL CHILDREN
Cíara McBride
Master’s thesis
University of Tampere School of Health Sciences (Public Health)
University of Tampere School of Health Sciences
McBride, Cíara: SOCIOECONOMIC STATUS, OVERWEIGHT AND WAIST CIRCUMFERENCE IN 3-6 YEAR OLD FINNISH PRESCHOOL CHILDREN Master’s thesis, 65 pages, 2 appendices
Supervisors: Leena Koivusilta, Reetta Lehto Health Sciences (Public Health)
May 2017
ABSTRACT
Background: A predominantly inverse association between socioeconomic status (SES) and child overweight exists in Europe. In Finland, little is known regarding the socioeconomic gradient of overweight in young children, or the role of gender in this association as overweight prevalence has not been nationally monitored.
Aim: To examine the association between SES, overweight and waist circumference in Finnish preschool children (3-6 years) and explore the role of gender.
Methods: This study is conducted under the Increased Health and Wellbeing in Preschool (DAGIS) project. As part of a cross-sectional study conducted in 2015/2016, anthropometric measurements were taken from 811 preschool children and the SES of these children measured through parent questionnaires. Overweight was calculated according to Cole and Lobstein’s BMI child cut-offs and waist circumference measured. SES was measured through a variety of educational and income variables, including combined SES which comprises of education and income measures. Logistic regression and analysis of covariance were used in the analyses to study differences in overweight (including obesity) and waist circumference between SES groups.
Results: The prevalence of overweight (including obesity) was 12%, 12.9% for girls and 11.1% for boys. Middle highest education was associated with decreased odds of overweight for children when parent BMI was adjusted for (OR=0.5, 95% CI=0.3-0.9). Furthermore, differences were found between girls and boys: for girls and overweight, low household relative net income was associated with lower odds of overweight when parent BMI was adjusted for (OR=0.3, 95% CI=0.1-0.8); and for boys and overweight, middle household relative net income was associated with higher odds of overweight, however, this association was only significant in the crude and adjusted models.
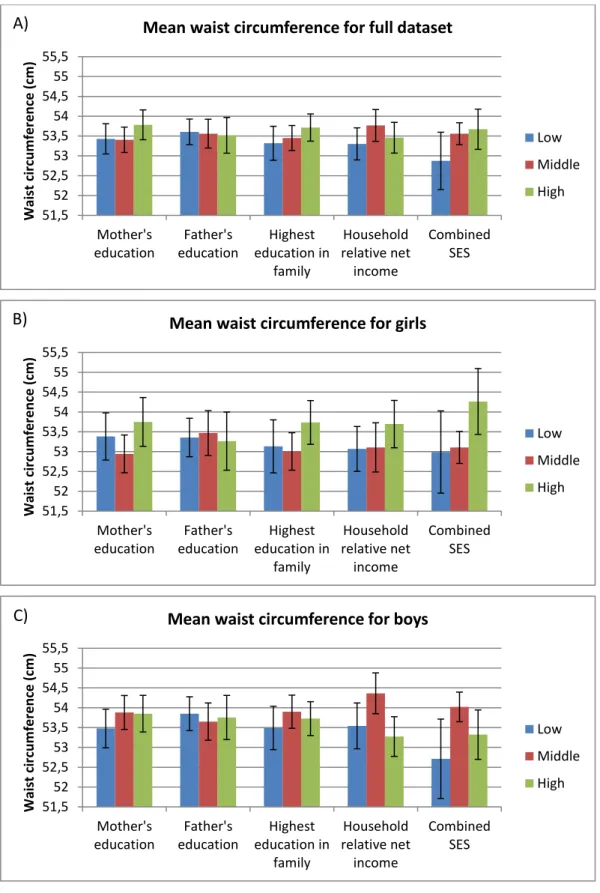
Additionally, overall associations were found, when parent BMI was adjusted for, between waist circumference and combined SES for girls (F(2,3)=5.7, P=0.004), and waist circumference and household relative net income and combined SES for boys (F(2,3)=5.0, P=0.005; F(2,3)=P=0.015, respectively).
Conclusions: The prevalence of overweight was found to be low compared to other European countries. Furthermore, contrary to predominant findings from other Western European countries, no inverse associations were found between SES and child
overweight in this study. Rather, varying associations between some SES indicators and overweight/waist circumference were found and they differed between girls and boys. Keywords: Socioeconomic status, child overweight, waist circumference, preschool children, gender, Finland
TABLE OF CONTENTS
1. INTRODUCTION ... 1
2. LITERATURE REVIEW ... 3
2.1. Socioeconomic status ... 3
2.1.1. An introduction to socioeconomic status... 3
2.1.2. Three key measurements of socioeconomic status: education, income, and employment ... 4
2.1.3. Socioeconomic status and health ... 5
2.1.4. Socioeconomic status and Finland: position and policies ... 8
2.1.5. The Public health significance of socioeconomic status ... 9
2.1.6. Reducing the gap between socioeconomic statuses ... 9
2.2. Child overweight ... 10
2.2.1. Definition of child overweight ... 10
2.2.2. Measurements of child overweight... 10
2.2.3. Prevalence trends of child overweight... 12
2.2.4. The causes of child overweight ... 14
2.2.5. The public health significance of child overweight... 17
2.2.6. Reducing child overweight ... 18
2.3. Socioeconomic status and child overweight ... 19
2.3.1. Socioeconomic status and child overweight trends ... 19
2.3.2. The role of socioeconomic status on child overweight ... 21
2.3.3. The Public health significance of socioeconomic status and child overweight ... 23
2.3.4. Reducing the impact of socioeconomic status on child overweight ... 23
2.4. Research aims ... 24
3. ACKNOWLEDGEMENTS ... 25
4. REFERENCES ... 26
5. ARTICLE ... 42
APPENDIX 1: Extract from the consent form (English) ... 64
ABBREVIATIONS
BMI Body mass index
DAGIS Increased Health and Wellbeing in Preschool
IOTF International Obesity Task Force
SES Socioeconomic status
1 1. INTRODUCTION
A predominantly inverse association persists between socioeconomic status (SES) and child overweight with positive relationships having almost disappeared (Barriuso et al., 2015). This phenomenal disparity is largely owing to poorer knowledge, greater lack of means and exposure to obesogenic environments in low SES groups (World Health Organisation [WHO], 2016a). Overall, in the World Health Organisation (WHO) European region, 20-30% of children (3-17 years) were estimated to be overweight (including obese) between 2003-2008 (Wang & Lim, 2012). Whilst in Finland, the latest data from 2014-2015 indicates that 23% of girls and 24% of boys (2-16 years) are overweight (including obese) (Mäki et al., 2017). SES influences child overweight, which is of utmost importance due to its high prevalence and numerous immediate, intermediate and long-term physical and psychological health consequences (WHO, 2016a). There are multitudinous pathways through which SES can impact child overweight; therefore, it is vital to closer inspect the association between SES and overweight on country and population levels (Wang & Lim, 2012). The burden of SES on the ailments associated with child overweight contribute huge losses to society and costs to healthcare systems, and can indirectly lead to a perpetual cycle of inequality (Lobstein, Baur, & Uauy, 2004). Consequently, the inverse relationship between SES and overweight has long been recognised as a major public health challenge (Ball & Crawford, 2005).
In general, the association between SES on overweight in Finland appears to be similar to the majority of Europe: an inverse relationship (Magnusson, Hejgaard, &
Matthiessen , 2014; Stockmarr, Hejgaard, & Matthiessen, 2016).Nevertheless, research on SES and child overweight in Finland has revealed some heterogeneous findings. One study, on adolescents, found an inverse association for girls, whereas for boys, higher SES was associated with more overweight (Due et al., 2009). These findings illustrate the disparities in the role gender in the association between SES and overweight, in both Finnish and European-based studies alike. Some studies have found differences between girls and boys in the association of SES on overweight (Barriuso et al., 2015;
Magnusson et al., 2014; Wang, & Lim, 2012) and others have found no differences (Barriuso et al., 2015; Lissner et al., 2016; Stockmarr et al., 2016).One of the few studies to describe such trends in younger Finnish children (3-8 years) reports that in
2
girls, SES was not associated with overweight, however in boys, parental education was inversely associated with overweight (Parikka et al., 2015).It must be considered that gender may play an important role in the pattern and susceptibility to certain
environmental and social conditions, and therefore, is an important factor to consider when measuring SES associations.
Finland has one of the most educated populations(Heckmann & Marin, 2013) and some of the smallest income differences (Organisation for Economic Co-operation and Development [OECD], 2008)in Europe. Consequently, Finland is an interesting population to study the association of SES on overweight and waist circumference and to study the role of gender on this association. Despite this, knowledge and comparable evidence on SES inequalities and the risk of overweight in young children is lacking in Finland, as it is across Europe (Cattaneo et al., 2010; Pillas et al., 2014). Also, little is known regarding the mechanisms of gender on the association between SES and child overweight or waist circumference, as gender has often been overlooked in past research (Wisniewski & Chernausek, 2009). This present study serves to examine the relationship between SES and child overweight/waist circumference in Finnish preschool children (3-6 years), specifically investigating how this association is moderated by gender. This thesis is conducted under the Increased Health and
Wellbeing in Preschool (DAGIS) project, a Finnish project which aims to reduce SES inequalities in preschool children’s energy balance-related behaviours (physical activity, sedentary behaviours, dietary behaviours and sleep patterns) and promote healthier lifestyles in Finnish preschool children (Määttä et al., 2015).
3 2. LITERATURE REVIEW
2.1. Socioeconomic status
2.1.1. An introduction to socioeconomic status
SES describes social position; the social and economic factors influencing the relative position of an individual in a social hierarchy, depicted by resource-based (material and social resources, assets) and prestige-based (individual rank or status) measures
(Krieger, Williams, & Moss, 1997). SES and other terms such as socioeconomic position, social class, social status and social stratification are regularly used
interchangeably despite being based on different theoretical bases (Galobardes et al., 2006). SES is primarily measured by education, occupation and income; these are resource-based measures of SES which in turn can influence prestige-based measures (such as consumption and access to goods, services and knowledge) (American Psychological Association [APA], n.d.; Krieger et al., 1997). Low SES is typically associated with lower education, lower income and manual occupations, which are classically related to relative deprivation and low levels of resources: people unable to achieve sufficient conditions relating to diet, amenities, standards and sufficient access to services (Townsend, 1993). High SES is typically associated with higher education, greater wealth, non-manual occupations, as well as privilege, power and control (APA, n.d.).
The SES of children is measured by the SES of their parents. Some evidence indicates that childhood SES, determined by parental SES, is associated with outcomes in later life. Moreover, some research suggests that as children age, the gradient in emotional and social problems associated with low SES becomes steeper, creating a deepening cycle of relative poverty (Power & Matthews, 1997). However, others report SES can be ascribed or achieved; evidence indicates that SES is influential and malleable. Kestilä, Rahkonen, Martelin, Lahti-Koski and Koskinen et al. (2009) reports that the effect of low parental SES can be attenuated by one’s own education, and Huurre, Aro and Rahkonen (2003) found that after controlling for one’s own SES, the effect of parental SES largely diminishes. Numerous other studies suggest current SES may be a
4
stronger determinant of adult health (Lynch et al., 1994; Marmot, Shipley, Brunner, & Hemmingway, 2001; Rahkonen, Lahelma, & Huuhka, 1997). These contrasting findings depict the complexity of SES. Nevertheless, it is largely believed that where free
education is provided along with a comprehensive welfare system, individuals have the opportunity to positively affect their own SES (Esping-Andersen, 1990).
2.1.2. Three key measurements of socioeconomic status: education, income, and employment
The measurement of SES is multidimensional; no single indicator is always suitable nor applicable and each measurement measures related, yet different aspects of SES, this can result in varying gradients with no single measure encompassing the entirety of the impact of SES (Galobardes et al., 2006). Nonetheless, education is a frequently used indicator of SES and viewed largely as one of the most valuable measurements as it not only depicts a status in society, but also knowledge, attitudes and behaviours that are attained with education (Galobardes et al., 2006). A person’s SES can be classified by the level of education they have attained, or the number of years they have studied (Galobardes et al., 2006). Persons of lower SES may have no qualifications or only high school education, this would correlate to lower number of years studied. Meanwhile, higher SES persons may have a Master’s degree or higher and higher number of years studied. Categorisation of education level is country specific as educational systems vary. As an indicator of SES, education is important as it describes long term resources such as material and intellectual resources from both early life and into adulthood (Galobardes et al., 2006). Additionally, education is an important indicator as it is often stable during adult years. Education often determines income and employment,
typically low education leads to lower income and lower labour market position.
Income directly measures material resources; it is reported as the money received by a person including all benefits and wages (Galobardes et al., 2006). Income can be measured in a number of different ways; in the case of measuring a child’s SES household income is commonly measured. One aspect to consider when measuring income is family size and relationships, to take this into consideration, an adjustment of income by family dynamics is often used (relative income). Income is the most
5
important measure of SES as it directly influences material resources including food, housing and access to services (Galobardes et al., 2006). Income also depicts potential stress levels which in turn determine behaviours and outcomes influencing sufficiency to provide adequate essential needs (Cooper & Stewart, 2013).
Occupation is measured by a person’s employment status which is a reflection of societal position, income and intellect (Galobardes et al., 2006). Employment can include current employment status, longest held occupation or labour market position. These measurements range from unemployed to employed and manual (blue-collar) work to non-manual (white collar) work. However, employment status changes frequently during ones’ lifetime and can range from student to maternity leave to retirement. Occupation is still nonetheless an important measure of SES as it is strongly related to income and it reflects social standing, social networks, work related stress, control, autonomy as well as exposure to occupational hazards (Galobardes et al., 2006).
2.1.3. Socioeconomic status and health
SES is essentially one of the most effective determinants of variations in health, relevant to every society globally (WHO, 2008) and it affects health in numerous ways which are outside the control of an individual (WHO, 2017a). Determinants of SES that influence health include: education, income and income distribution, unemployment and employment, job security, work conditions, health services, housing, food security, social safety, social exclusion, early childhood development, gender, race, minority groups, marginalised groups, and disability. These determinants are not all directly relevant to children; however, child SES has the potential to shape these determinants in later life.
A SES gradient in physical and psychological health outcomes is less visible in childhood and adolescence in comparison to later life. Nevertheless, Donkin, Roberts, Tedstone and Marmot (2014) found low SES children have worse health outcomes, partly as a result of the direct impact of poverty on their development and partly due to other household and parental characteristics associated with low SES. Furthermore, some SES differences have been found regarding height, accidents in boys, limiting long-term illness and respiratory function (West, Macintyre, Annandale, & Hunt, 1990).
6
However, in saying this, SES differences amongst young people have often been found to be inconsistent or very small (Ford, Ecob, Hunt, Macintyre, & West, 1994;
Glendinning et al., 1992; Rahkonen, Arber, & Lahelma, 1995; West, 1997; West et al., 1990). Even so, the importance of the effects and consequences of SES during
childhood are maintained and emphasised due to consistent findings that low SES children are less likely to become healthy adults (van de Mheen, Stronks, &
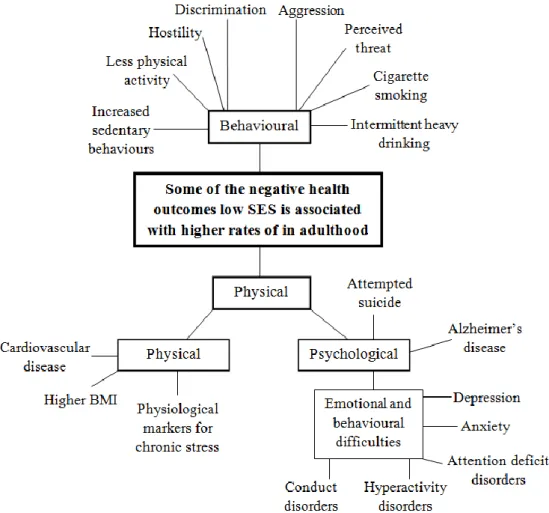
Machenbach, 1998; Pietilä & Järvelin, 1995; Power & Matthews, 1997; Rahkonen et al., 1997). The circumstances of early life can directly affect adult health (Eriksson, Forsen, Tuomileho, Osmond, & Barker, 2001) and also indirectly influence adult circumstances of life such as education, income, employment and social position, in turn affecting health (Cutler & Lleras-Muney, 2006; Marmot et al., 2001). As a consequence of these direct and indirect determinants, experiences and exposure to a wide range of psychosocial and environmental risk factors are influenced, affecting both physical and psychological health outcomes throughout life (House & Williams, 2000).
Figure 1. Some of the negative physical, psychological and behavioural health outcomes low SES is associated with higher rates of in adulthood. Abbreviation: SES, socioeconomic status. (Chen & Paterson, 2006; Fratiglioni, Winblad, & von Strauss, 2007; Goodman, 1999; Molnar et al., 2008; Newacheck, Hung, park, Brindis, & Irwin, 2003; Steptoe & Marmot, 2004.)
7
Low SES is linked to a number of negative physical, psychological and behavioural health outcomes in adulthood (Figure 1). A Finnish study found low SES females had lower esteem and more distress symptoms, and low SES males had lower self-esteem. Low SES was also associated with unhealthier behaviours regarding smoking and physical activity as well as low SES females having higher rates of overweight (Huurre et al., 2003). Associations between SES and depression, health status or prevalence of chronic illness however were not found. Differences in findings suggest potential population specific outcomes which can be observed to some degree by measuring mortality and morbidity.
Mortality and morbidity can be used as crude measures of physical and psychological health. Large differences between SES groups in mortality and morbidity are evident in Finland. An international comparative study revealed that differences in relative
mortality between SES groups are more prominent in Finland than in many other western European countries, especially for men (Mackenbach et al., 2008). A study published in 2011 found highest earning men had a life expectancy of 12.5 years higher than lowest earning men (Tarkiainen, Martikainen, Laaksonen, & Valkonen, 2011). Differences in mortality are also increasing (Mackenbach et al., 2008; Tarkiainen et al., 2011). Similarly, morbidity is greater in low SES groups in Finland: low SES groups are twice as likely to experience long-term illness compared to high SES groups (Palosuo et al., 2009), twice as likely to feel their health is below average and more likely to suffer from chronic illnesses such as type 2 diabetes, coronary heart disease, and musculoskeletal disorders (Rahkonen et al., 2009). SES differences in chronic diseases have stayed somewhat consistent in spite of increased differences in mortality (Koskinen et al., 2009; Rahkonen et al., 2009). This consistency in morbidity raises the question of what has caused the continuously widening gap in mortality between SES groups. To expand on this, it is of importance to investigate childhood SES as this period defines the beginnings of lifetime SES trends, trends which mortality and morbidity can be used to measure the magnitude of SES on health. SES determines many physical and psychological health outcomes through a variety of mechanisms, despite inconclusive direct evidence on SES and child health it is evident that childhood SES does impact adult health.
8
2.1.4. Socioeconomic status and Finland: position and policies
Finland has been successful in preventing profound economic inequalities and deep poverty through its commitment, as a Nordic country, to equally provide basic needs to its residents such as welfare services, basic security, and free education (Mikkonen, 2012). Consequently, Finland is renowned for its highly educated population, secure income and stable job market. Finnish people are more educated than their European counterparts (Heckmann & Marin, 2016) and boast some of the smallest income differences in Europe (OECD, 2008). These achievements are consequences of Finland’s progressive tax system and well established social policies.
Finland has strong social policies founded on universalistic principles which strive to provide social protection against poverty (Kangas & Saari, 2007; Niemelä & Salminen, 2006; Nordic Social Protection Statistics [NOSOSCO], 2011). It is a Finnish
constitution to provide indispensable subsistence and care (Ministry of Justice, 1999), thus, numerous policies have been created to attain such principles. The Health in All Policies approach is strongly advocated in Finland, this approach highlights broader economic and social factors through multidisciplinary actions as important determinants of health (Puska & Ståhl, 2010; Ståhl, Wismar, Ollila, Lahtinen, & Leppo, 2006). Finland has had a multitude of health-related policies in recent years from the Health for all Program in 1986 to Socially Sustainable Finland 2020 (Ministry of Social Affairs and Health, 1987, 2011). Mikkonen (2012) summarises the recent history of Finnish health policies, all of which have heavy emphasis on social equity and reducing inequality.
Reducing inequalities associated with SES has been a long term goal and remained one of the key objectives in the majority of policies made in recent years. Policies have been successful in improving the overall health of the Finnish population, however, despite such focus on the reduction of health inequality differences between SES groups,
inequalities have remained stable or even increased (Koskinen et al., 2009; Mackenbach et al., 2008; Palosuo et al., 2009; Rahkonen et al., 2009; Tarkiainen et al., 2011). The great differences in health between SES groups, despite small educational and income differences, may indicate that policy implication has lacked efficiency and political decisions have not been on the same line as policy programme goals. It has also been
9
suggested that the aim to reduce inequalities in health has been of lower priority than other policy objectives (Mikkonen, 2012).
2.1.5. The Public health significance of socioeconomic status
SES is a crucial determinant of health: SES is associated with a great proportion of the total population disease burden (Goodman, Slap, & Huang, 2003). Systematic health differences exist between SES groups; a socioeconomic gradient persists whereby the most disadvantaged exhibit the worst health. Low SES impacts negatively on health and wellbeing from the onset of life and throughout life (Donkin, Roberts, Tedstone, & Marmot, 2014). Furthermore, whereas overall health is improving, differences between socioeconomic groups are widening (UN, 2016a). This subject is of such importance that it has been addressed in the United Nation’s Sustainable Development Agenda which set a goal to reduce inequalities within and between nations in order to end poverty and ensure prosperity for all (UN, 2016b). It is of public health interest to reduce inequalities in SES throughout the different stages of a person’s lifespan in order to positively impact health and wellbeing and thus reduce disease burden.
2.1.6. Reducing the gap between socioeconomic statuses
Reducing differences in health outcomes between SES groups requires many
determinants of health to be addressed in a sophisticated manner. The ultimate goal is to flatten the gradient between SES and health outcomes by improving the average health of lower SES groups. This can be achieved by tackling inequalities both indirectly and directly (Donkin et al., 2014). Indirect methods should minimise the prevalence and impact of negative characteristics associated with low SES, such as pregnancy related health issues and improving breast feeding rates to supporting parents to provide
healthy diets and encouraging the use of high-quality preschools. Direct methods should improve education, income and social status through direct investment. It is the duty of Governments and local governing bodies to prioritise reducing inequalities in health through converging and efficient policies (Donkin et al., 2014; Mikkonen, 2012, 2013). One area of policy development to reduce the gap between SES groups is overweight; this has been identified as one of the key areas to address in order to reduce some of the negative impacts of low SES (Donkin et al., 2014).
10 2.2. Child overweight
2.2.1. Definition of child overweight
Overweight and obesity are defined as “abnormal or excessive fat accumulation that may impair health” (WHO, 2016b). Definitions specifically for overweight and obesity have varied over time and between studies (Hubbard, 2000). It is generally viewed that overweight indicates weighing more than is optimally healthy, whereas obesity is a medical condition whereby there is an accumulation of excessive adiposity that has negative effects on health. For practical reasons, the definition of overweight is based on anthropometry. It is important to define overweight in order to be able to predict health risks and make population comparisons (Lobstein et al., 2004). This thesis refers to both overweight and obesity as overweight.
2.2.2. Measurements of child overweight
Overweight can be measured using many different methodologies. Numerous precise measures of adiposity have been devised to measure overweight which specifically measure adiposity and muscle mass (Lobstein et al., 2004). These techniques however are beyond the scope of population based surveys. Due to simplicity, convenience and ease of measurement, BMI and waist circumference are the most widely used methods in clinical and population studies to measure overweight, providing a highly valuable population-level measurement of weight status (Lobstein et al., 2004; WHO, 2016b).
BMI simply measures weight-for-height (weight divided by height squared [kg/m²]). For adults, a BMI of ≥30 indicates obesity, ≥25 overweight and <18 underweight (WHO, 2017b). Multitudinous measures and references have been created and used to define overweight over time and the application of which has varied considerably (Cole, Bellizzi, Flegal, & Dietz, 2000; Lobstein et al., 2004; Wang & Lim, 2012). Cut-off points for adults are based on increasing risk of disease; however, this is not the case for children. Furthermore, for children, the issue becomes more complicated as it is
important to take into consideration age and gender, to account for the typical rises and falls in BMI that occur during childhood (Lobstein et al., 2004). The need for such considerations has had profound effects on prevalence estimates between time periods,
11
populations and studies, proving comparisons between different countries and studies challenging (Wang & Lim, 2012).
There have been a number of attempts to design a universal system of measuring child BMI to facilitate international comparisons, these include: the International Obesity Task Force (IOTF) BMI cut-offs, the 2006 WHO growth standards for preschool children (0-5 years) and the 2007 WHO growth reference for school-age children and adolescents (5-19 years) (Wang & Lim, 2012). This thesis uses the child weight categories devised by Cole and Lobstein (2012). They created age and gender adjusted BMI categories based on the IOTF BMI cut-offs which have been widely used to asses child BMI. These categories are beneficial for many reasons, including: the weight categories of all children 2-18 years can be calculated using the same system; they are an international reference that can be used to compare world-wide populations (however it may not adequately represent developing populations); and, although cut-offs are not based on disease risk, if a child continues on that growth curve the cut-offs represent adult BMI categories (Cole, & Lobstein, 2012; Wang, & Lim, 2012). It is important to note that such BMI references, however valuable for shedding light on the prevalence of overweight, are only estimates. There are no absolute cut-off points for labelling child overweight: cut-offs are arbitrary for categorising weight status (Lobstein et al., 2004; WHO, 2016a). Notably, many researchers claim that BMI is a good measure of adiposity in children (Cole et al., 2000; Kuczmarski et al., 2000; Wang & Lim, 2012). Yet, others are of the opinion that BMI is only a rough measurement of weight status; it does not identify children with greater adiposity and highlight these children at greater risk of health complications. Additionally, cut-offs may not be universally applicable and research on adults has found differences in adiposity between ethnicities (Yajnik, 2002). Waist circumference is seen as a better measure of adiposity by some.
Measuring waist circumference is seen as advantageous as it does indicate central adiposity and identify relative fatness in children (Lobstein et al., 2004), but, it is important to acknowledge the influence of growth on children when using waist circumference to measure central adiposity (Brambilla et al., 2006). Waist
circumference is calculated by measuring the minimum circumference between the lower margin of the last palpable rib and the iliac crest (WHO, 2017). There are a number of ways to use waist circumference including calculating waist-to-height ratio
12
and waist-to-hip ratio. Measuring waist circumference is beneficial due to its ease of use and validity, as well as its strong correlation to adverse adiposity and
hyperinsulinaemia in children (Freedman, Serdula, Srinivasan, & Berenson, 1999) and risk of cardiovascular disease in adults (Ross, Fortier, & Hudson, 1996). However, waist circumference is highly age dependent and few studies have investigated the relationship between central adiposity and metabolic disturbances in children (Lobstein et al., 2004). Furthermore, accepted cut-offs for the classification of overweight do not exist for children. It is thus recommended that waist circumference measurements are used in addition to BMI measurements in children (Kolle, Steene-Johannessen, Holme, Andersen, & Anderssen, 2009).
2.2.3. Prevalence trends of child overweight
The following data uses the international age and gender adjusted IOTF cut-off points. In the WHO European region, 20-30% of children (3-17 years) were estimated to be overweight between 2003-2008 (Wang & Lim, 2012). Separating overweight and obesity, approximately 20% of children were overweight and 5% obese. Underweight is rarely prevalent in Europe (Wijnhoven et al., 2013). In Finland, the latest data from 2014-2015 indicates that 23% of girls and 24% of boys are overweight (2-16 years) (Mäki et al., 2017). Separating overweight and obesity, 19% of girls and boys are overweight and 4% of girls and 5% of boys obese. Intercountry comparable prevalence figures for children under 9 years do not exist in Finland (WHO, 2013), however numerous studies describe prevalence rates. In the Finnish city of Seinäjoki, local data found 20% of 5 year olds were overweight in 2009 (United Nations Regional
Information Centre [UNRIC], 2015), another study on 5 year olds from Tampere and 3 rural municipalities found 13.8% were overweight in 2006, 17.7% of girls and 9.8% of boys (Vuorela, Saha, & Salo, 2009), whilst another study on 5 year olds from different areas of Finland found 14.7% were overweight in 2007-2008, 19.1% of girls and 10.3% of boys (Mäki et al., 2010). Another study, on 3-8 year olds conducted across Finland between 2007-2009 found the prevalence of overweight to be 17% for girls and 13% for boys (Parikka et al., 2015). This study also researched older children (11-16 years) and found the prevalence of overweight to be 20% for girls and 24% for boys. Intercountry comparable prevalence figures do exist for 10-19 year olds. The Health Behaviour in School-aged Children survey (2009/2010) found up to 17% of 11 year olds girls and
13
29% of 11 year olds boys were overweight (Currie et al., 2012). For 13 year olds, 17% of girls and 25% of boys were overweight and for 15 year olds, 12% of girls and 20% of boys.
The prevalence rates show a mixture of trends between ages and genders. Finnish data on younger children, albeit not comparable, show similar trends and consistency in the prevalence of overweight being higher in girls than boys whereas the comparable data on older children reveals consistently higher prevalence rates in boys than girls. Other European studies have found differences between overweight and gender (Ahrens et al., 2014; Currie et al., 2012; Lobstein et al., 2004; OECD, 2014; Parikka et al., 2015; Wijnhoven et al., 2013) whereas others have found little variation (Cattaneo et al., 2010; Lissner et al., 2016). In a review of existing data on preschool children in the European Union, Cattaneo et al. (2010) found generally overweight was higher in girls than boy when using the IOTF criteria, however, they claim that the IOTF reference and cut-offs are gender biased as use of the WHO standard with cut-offs removed gender
differences. This implies caution is required when analysing gender differences from data using the IOTF reference.
Overweight prevalence over the last few decades is also somewhat disputed. The WHO state that in Europe overweight prevalence among infants and children has been steadily rising between 1990 and 2008 (WHO, 2017d). On the contrary, Olds et al. (2011) argues that there has been widespread belief that the prevalence of child overweight (2-19 years) has been rapidly increasing, yet evidence indicates that overweight prevalence has slowed appreciably or even plateaud, albeit at different rates in different countries. Detailed analysis on country, geographical region, age and gender platforms are
fundamental to deciphering the trends of child overweight (OECD, 2014; Wang & Lim, 2012). To demonstrate this, the Organisation for Economic Co-operation and
Development found virtually stable trends in child overweight from 2004 to 2014 (OECD, 2014), yet less detailed analysis covering less countries found overweight has been steadily increasing since 2000 in 15 year olds (OECD, 2013). In Finland, evidence also implies adolescent overweight has increased, however reported data only spans from the 1970s to the mid 2000s. One adolescent study conducted between1979-2005 found a 1.5 to 4 fold increase in overweight prevalence (Kautiainen et al., 2009) and another conducted between 1974-2001 also found overweight prevalence to have
14
increased, more so in boys than girls (Vuorela, Saha, & Salo, 2011). Contrastingly, a more recent Danish study found the prevalence of overweight in adolescents plateaued or even declined between 2002 and 2010 (Schmidt Morgen et al., 2013).
Despite potentially contrasting evidence in overweight prevalence trends amongst adolescents, trends seem to be more consistent in younger children. No significant changes in overweight prevalence were found for 7-12 year olds in the Nordic countries between 2011 and 2014 (Stockmarr et al., 2016). Additionally, Catteneo et al. (2010) found no obvious trend of an increase in overweight prevalence in the 20-30 years preceding their review of existing data on preschool children from European Union countries. This trend has also been visible specifically in Finland whereby no changes in the prevalence of overweight in 5 year olds were found between 1974-2001 (Vuorela et al., 2011). This study also found overweight prevalence was significantly decreasing in 2 year old children. Other studies also indicate signs of declining overweight
prevalence (Keane, Kearney, Perry, Kelleher, & Harrington, 2014; Schmidt Morgen et al., 2013). The indication of stabilising or even declining overweight prevalence is optimistic however there is no denying that the level of the current plateau is exceptionally high and continuously needs addressing (Keane et al., 2014).
Furthermore, a Norwegian study discovered rapid increase in waist circumference and skinfold thickness indicating increased adiposity despite no increase measured by BMI (Kolle et al., 2009). This evidence highlights that perhaps even in the eventuality of overweight no longer increasing, children’s body fat composition may still be rising, impacting negatively on health.
2.2.4. The causes of child overweight
A multitude of factors involving biology, behaviours and the environment are
associated with causing overweight (Figure 2). Generally, overweight occurs as a result of an imbalance between energy intake and energy expenditure (Neupane, Prakash, & Doku, 2016; Wijnhoven, van Raaij, & Breda, 2014). This imbalance can occur as a result of unhealthy diet, insufficient physical activity and excessive sedentary
behaviours. The strongest risk factor is often viewed as parental overweight (Bammann et al., 2014; Parikka et al., 2015), especially overweight during pregnancy (Barker, 2007; Snethen, Hewitt, & Goretzke, 2007). A Finnish study found that having just one
15
overweight parent increased the risk of a child being overweight (Parikka et al., 2015). It is proposed that overweight can be passed on from one generation to another as a consequence of biological and behavioural risk factors such as epigenetic processes and energy balance-related behaviours, which in turn are influenced by environmental risk factors such as exposure to obesogenic environments (WHO, 2016a).
Figure 2. A summary of the causes of child overweight: biological, behaviour, environmental and other factors. (Lissner et al., 2016; Malik, Willett, & Hu, 2013; WHO 2016a.)
The WHO describes the role of biological factors on overweight through two general development pathways: the “mismatch” pathway and the developmental pathway (WHO, 2016a). The “mismatch” pathway results from varying degrees of malnutrition during gestation and early childhood causing long-term epigenetic effects that put children at greater risk of overweight (Barker, 2007; Hanson & Gluckman, 2014). The developmental pathway is characterised by maternal overweight or diabetes during pregnancy predisposing children to increased adiposity and possibly giving rise to epigenetic processes (WHO, 2016a). Other biological influences include inappropriate infant feeding which has essentially been made possible due to the evolutionary novelty of baby formulas (Hanson & Gluckman, 2014; WHO, 2016a). The use of baby formula is commonly believed to cause rapid infant growth which is associated with child overweight (Armitage, Taylor, & Poston, 2005; Gillman et al., 2001). However, the explanation for these trends are controversial (Baker, Michaelsen, Sorensen, & Rasmussen 2007; Hilson, Rasmussen, & Kjolhede, 2004, 2006; Karaolis-Danckert,
16
Gunther, Kroke, Hornberg, & Buyken, 2007). All these examples of biological risk factors for child overweight are determined largely by parental behaviours.
Behaviours influencing overweight include energy balance-related behaviours such as physical activity, sedentary behaviours and diet. Parental behaviours are an important risk factor to child overweight as overweight parents teach their children unhealthy behaviours (Vos, & Welsh, 2010). A minority of European children meet recommended physical activity guidelines (Currie et al., 2012; Verloigne et al., 2012) whereas
sedentary behaviours are highly prevalent with some children spending up to 9 hours of awake time sitting (Salmon, Tremblay, Marshall, & Hume, 2011; Tremblay et al., 2011). Additionally, some families tend to have nutrient-poor, ultra-processed and energy-dense foods to provide cheap and convenient diets (WHO, 2016a). Numerous studies report associations between child overweight and physical activity (Collings et al., 2013; te Velde et al., 2012; Trost, Sirard, Dowda, Pfeiffer, & Pate, 2003), excessive screen time (Hancox & Poulton, 2006; Hardy, King, Hector, & Lloyd 2012; Saelens et al., 2002; te Velde et al., 2012; van Stralen et al., 2012) and high consumption of nutrient-poor energy dense foods (Hardy et al., 2012; Johnson, Mander, Jones, Emmett, & Jebb 2008).These behaviours are all partial to the environment one is exposed to.
Environmental factors play an abundant role in shaping weight status and influence both biological and behavioural factors. Overweight can occur as a result of exposure to an obesogenic environment combined with inadequate biological and behavioural
responses to that environment (WHO, 2016a). This exposure to obesogenic
environments can encourage overweight by promoting energy imbalance, as a result of the availability and affordability of specific food types, as well as increasing sedentary behaviours and reduced physical activity. Worryingly, these behaviours and the
consequential overweight seem to be a social norm in many settings which furthermore contributes to the perpetuation of the obesogenic environment. Children often face unhealthy diets and poor physical activity behaviours as a consequence of a number of factors including political and commercial factors, the built environment, family environment and social norms (WHO, 2016a).
Other causes of overweight are related to geographical location, economics, urbanisation and globalisation. Malik, Willett and Hu (2013) summarised that
17
overweight has been largely driven by rapid urbanisation, economic growth and global trade liberalisation which have led to changes in diets, lifestyles and living
environments in ways that promote positive energy balance. Economic development and recession have also been hypothesised as reasons for high overweight prevalence (Lissner et al., 2016; Lobstein et al., 2004). It is interesting to study recent increases in overweight in developing countries where nutritional transitions are commonly
occurring, these are typically characterised by increased consumption of added sugar, fat, protein and refined grains (Lobstein et al., 2004). Another factor to take into
consideration when discussing the cause of overweight is gender. Evidence implies that gender is an important factor when determining the effect of weight on health. Many studies have found gender-specific risk factors to be associated with overweight
(Cardon et al., 2016; Danielzik, Czerwinski-Mast, Langnäse, Dilba, & Müller, 2004) as well as differences between genders in the rate at which overweight occurs (Lagström et al., 2008). Overweight can occur at any given time in one’s lifetime and can even be influenced before the beginning of life as a result of biological and behavioural responses to the obesogenic environment. Many children are on the pathway to overweight before they are born. Responses to biological, behavioural and
environmental exposures vary between individuals and are strongly influenced by life-course or developmental factors including SES.
2.2.5. The public health significance of child overweight
Overweight is a global public health concern as it is the fifth leading cause of mortality globally (Neupane et al., 2016). The prevalence of overweight is also of great public health concern specifically in Europe as the majority of the population are overweight in many countries (OECD, 2014). One estimate indicates that, without effective policy intervention, child overweight and its associated comorbidities will increase, adding tremendous pressure to already burdened public health systems (Lobstein & Jackson-Leach, 2016). It is crucial to tackle overweight in children as a child’s weight status is likely to remain with them throughout their life (Fuentes et al., 2003; Goran, Gower, Treuth, & Nagy, 1998; Singh, Mulder, Twisk, Mechelen, & Chinapaw, 2008).
Furthermore, even though improving BMI in adulthood has been shown to be beneficial (Juonala et al., 2006), child overweight leaves a permanent imprint on adult health (Kelsey, Zaepfel, Bjornstad, & Nadeau, 2014; WHO, 2016a). Whether or not the rate of
18
overweight is increasing, plateauing or declining, there is no argument that overweight prevalence is alarmingly high and poses an urgent and serious challenge (WHO, 2016a). Some of the challenges of child overweight are evident from the numerous immediate, intermediate and long-term health consequences presented in Figure 3. The burdens of these ailments have huge losses to society and costs to healthcare systems underscoring the public health significance and importance of implementing prevention strategies urgently (Lobstein et al., 2004). The overweight epidemic is viewed in such high regard that tackling it is one of the core priorities of the 2015 United Nations’ Sustainable Development Goals as the prevention of overweight is crucial to the control of non-communicable diseases.
Figure 3. The immediate, intermediate and long-term health outcomes associated with child overweight. (Dietz, 1998; Lobstein et al., 2004; Lobstein & Jackson-Leach, 2016; Neupane et al., 2016; Wang & Lim, 2012; WHO, 2016a; Wijnhoven et al., 2014.)
2.2.6. Reducing child overweight
Evidence emphasises the importance of promoting healthy behaviours for both mothers and fathers before parenthood, throughout pregnancy and promoting healthy behaviours
19
throughout a child’s life in order to reduce child overweight (WHO, 2016a). During childhood, it is essential to tackle overweight at an early age as this is when unhealthy behaviours develop, which determine a child’s weight status, and once behaviours are established and a weight status achieved they are difficult to change (Birch & Fisher, 1998; Craigie, Lake, Kelly, Adamson, & Mathers, 2011). Despite this, evidence based prevention programmes on preschool-aged children are only beginning to emerge and greater information to improve prevention programme development is needed (Wang & Lim, 2012). Policies and prevention strategies across multiple levels are required in order to have measurable effect in reducing child overweight (Malek, Willett, & Hu, 2013). Changes should include high-level global policies and coordinated efforts from governments, organisations, communities and individuals to positively change health behaviours. It is the responsibility of Governments to provide public health guidance, education and regulatory frameworks to tackle environmental and developmental risks to support communities to change their health behaviours. Yet, it is also individuals’ responsibility to encourage and live healthier lives to reduce child overweight. Evidence proves the utmost importance of a multidisciplinary approach to reducing child
overweight.
2.3. Socioeconomic status and child overweight
2.3.1. Socioeconomic status and child overweight trends
Historically, overweight was associated with high SES and underweight with low SES. In developed nations, an inverse trend of socioeconomic gradient and child obesity began to be reported in the early 1970s (Stunkard, d'Aquili, Fox, & Filion, 1972). Recent reviews found predominantly inverse associations between SES and overweight with positive associations no longer existing (Barriuso et al., 2015; Shrewsbury & Wardle, 2008). Donkin et al. (2014) state that statistics are clear and undisputed in showing that the lower a family’s SES, the greater the likelihood of child overweight. Numerous other sources also report that the risk of child overweight and high waist circumference is greatest in low SES groups in high-income countries/Europe (Ahrens et al., 2014; Hardy, Mihrshahi, Gale, Drayton, Bauman, & Mitchell, 2017; Ruiz et al., 2016; WHO, 2016a). Nevertheless, other research has found contradictions to this trend.
20
Lissner et al. (2016)’s results highlight the need to look at a country specific level in Europe as they found disparities in the direction of the SES gradient dependent on whether the country was in Western or Eastern Europe. Other findings show that the association between SES and child overweight varies by age, gender, ethnicity,
rural/urban location, neighbourhood SES and country, with some population subgroups at particular risk of becoming overweight (Burgi, Tomatis, Murer, & de Bruin, 2016; Due et al., 2009; Roblin, 2013; Schaefer, Mattingly, & Johnson, 2016; Taveras,
Gillman, Kleinman, Rich-Edwards, & Rifas-Shiman, 2010; Ueda et al., 2015; Wang & Lim, 2012). Some of these findings are however inconsistent, such as the trend between SES and overweight for genders (Lissner et al., 2016; Ruiz et al., 2016; Shrewsbury & Wardle, 2008). Furthermore, the stability of SES inequalities is also debated with some studies reporting widening social disparities in child overweight and others finding a lack of social gradient, non-significant disparities, or significant disparities in only one sub-group (Knai, Lobstein, Darmon, Rutter, & McKee, 2012). It appears that in general, a predominantly inverse association between SES and overweight exists however with closer inspection the association between SES and overweight is more complex and dependent on numerous factors.
In Finland, it appears that a predominantly inverse association exists between SES and child overweight, similar to the majority of Europe (Magnusson et al., 2014; Stockmarr et al., 2016), with parental education being a strong determinant of child overweight (Fuentes et al., 2003; Parikka et al., 2015). Nevertheless, research on SES and child overweight in Finland has revealed some heterogeneous findings.In Parikka et al.’s study on younger (3-8 years) and older (11-16 years) Finnish boys and girls, SES trends varied greatly between genders and age groups, for example, maternal and paternal education had both direct and indirect inverse associations with overweight (mediated by parent BMI) in young boys, but no associations were found for young girls.
Furthermore, a European and North American comparative study on adolescents found that in Finland (as well as Lithuania, Poland and Macedonia), girls from lower SES families had increased likelihood of overweight whilst the opposite was found for boys (Due et al., 2009). This study found large international variations in the magnitude and direction of the effects of SES on overweight. Most European countries (87.5%) had an inverse gradient for both boys and girls but a few positive gradients were found
21
child overweight over the past decades, a study conducted on adolescents during 1979-2005, which reports an inverse association, found no differences in trends over this time (Kautiainen et al., 2009). The evidence suggests that generally the trend of SES on overweight is similar in Finland to the majority of Europe and gender is an important factor to consider; however, the reasons underpinning this association are not clear-cut.
2.3.2. The role of socioeconomic status on child overweight
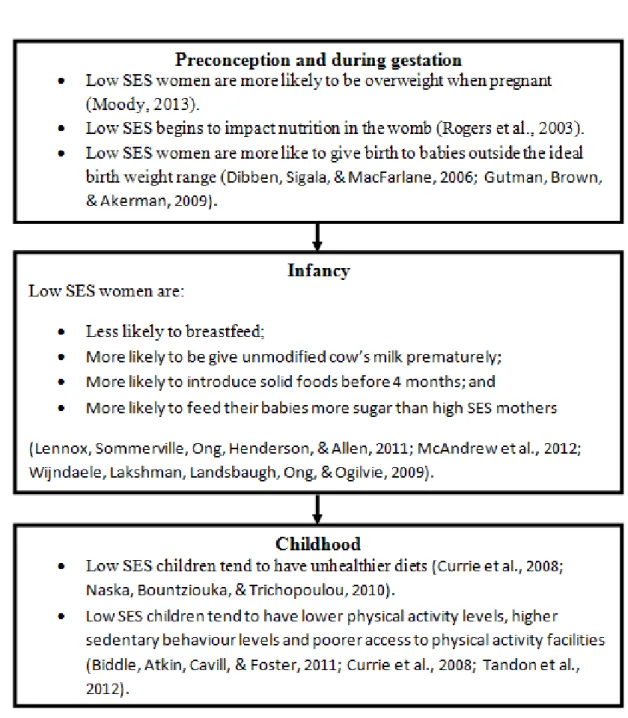
SES can impact child overweight through a number of avenues in a highly intricate manner with many factors playing a role. Parental education, income and employment are key determinants and measures of SES that influence both directly and indirectly the role SES has on child overweight. It may be that through low education and/or low income, parents do not know and/or are unable to ensure healthy diets for their children (Darmon & Drewnowski, 2008), or that healthy living is considered a low priority (Stamatakis, Wardle, & Cole, 2010). These circumstances and attitudes can cause inequalities which can lead to overweight, the effect of which is evident from preconception, gestation through to childhood (Figure 4).
The risk of child overweight is increased preconception and during gestation by parental overweight and nutrition which are associated with low SES. During infancy, low SES can impact child overweight through negative feeding practices which are linked to increased risk of child overweight (Arenz, Ruckerl, Koletzko, & von Kries, 2004; Dubois & Girard, 2003; Gutman et al., 2009; Owen, Martin, Whincup, Smith, & Cook, 2005). In childhood, low SES can continue to influence child overweight through diet, physical activity and sedentary behaviours.
The role of SES on diet, leading to child overweight is quite clear, however, despite clear correlational evidence, little is known regarding how SES influences daily patterns of physical activity and sedentary behaviours in children (Ferreira et al., 2007;
Gustafson & Rhodes, 2006; Pulsford et al., 2013). It is unclear what kind of energy balance-related behaviour patterns exist in childhood and whether different children of different SES groups use spaces differently to be physically active or sedentary. Additionally, Drenowatz et al. (2010) found being overweight influenced physical activity levels and low SES children are more likely to be overweight. Are low SES
22
children less physically active and therefore more overweight, or rather, are low SES children less physically active because they are more likely to be overweight?
Research has only somewhat described the role of SES on child overweight in Finland; research was only found on adolescents and the findings are ambiguous. One study found SES plays a major role in influencing children’s diet and consequential weight status (Roos, Karvonen, & Rahkonen, 2004). Contrary to this, Kautiainen et al. (2009) concluded that the factors underlying overweight may affect the entire population.
Figure 4. SES related risks which increase the likelihood of child overweight: stages of childhood. Abbreviation: SES, socioeconomic status.
23
2.3.3. The Public health significance of socioeconomic status and child overweight
The inverse relationship between SES and overweight has long been recognised as a major public health challenge (Ball & Crawford, 2005). Furthermore, where stabilising trends in overweight have been reported, low SES children have not benefitted
(Stamatakis et al., 2010), rather, overweight may have even been increasing in low SES children (OECD, 2014). Low SES has been found to be one of the strongest
independent risk factors of overweight in children (Danielzik et al., 2004) and overweight has been identified as one of the key areas to address in reducing the negative impacts of low SES (Donkin et al., 2014). A continuous cycle of low SES and overweight persists through generations (WHO, 2016a): children who are overweight are likely to become overweight adults (Fuentes et al., 2003; Goran et al., 1998; Singh et al., 2008) and overweight parents are more likely to have overweight children (Bammann et al., 2014; Parikka et al., 2015). In spite of this, there is a gaping lack of knowledge and comparable evidence on SES inequalities and overweight risk in young children, evidence which could be used to break this cycle in Finland and across Europe (Cattaneo et al., 2010; Pillas et al., 2014). It is of vital importance to tackle this public health concern and the burden of child overweight through reducing inequalities in SES. Furthermore, it is central to further develop understanding into the relationship between SES and overweight in young children to reduce the impact of SES on overweight.
2.3.4. Reducing the impact of socioeconomic status on child overweight
Efforts to reduce overweight need to deal with the negative impacts of low SES. Lack of, or poor access to quality education and healthcare and insufficient incomes must be addressed. Education improves knowledge and can change overweight-related
behaviours, as well as increase the likelihood of higher income and better employment (Donkin et al., 2014). Whilst insufficient income limits the means for families to pay for better lifestyles and can lead to stress, which may impact negatively on positive
parenting and health behaviours, further limiting healthy child development and impacting child overweight (Donkin et al., 2014). Policy makers should attempt to mitigate against the negative effects of low SES on weight status by being attentive to the effects of SES and providing help to the needy and ensuring equitable quality
24
education and a sufficient minimum income for healthy living. On a closing note, successful interventions to improve children’s outcomes and reduce inequalities are able to alleviate against the impact of SES on child overweight (Donkin et al., 2014).
2.4. Research aims
This thesis investigates the relationship between SES and overweight/waist
circumference in 3-6 year old Finnish preschool children to determine whether any associations exist. The research questions are:
(i) How is SES associated with overweight and waist circumference?
(ii) How is the association between SES and overweight/waist circumference moderated by gender?
This thesis is conducted under the DAGIS project which was founded to reduce SES inequalities in preschool children’s energy balance-related behaviours and to promote healthier lifestyles in Finnish preschool children (Määttä et al., 2015).
25
3. ACKNOWLEDGEMENTS
I express my deepest gratitude to my thesis supervisors Leena Koivusilta and Reetta Lehto. I feel overwhelmingly grateful to have worked with two highly-knowledgeable, experienced and expertly-skilled supervisors. I also thank them for their continued support, understanding and kindness.
I am endearingly thankful to the team behind the DAGIS project. I am grateful to have been given this opportunity to work on such a highly interesting topic with such wonderful people. I have gained invaluable knowledge and skills from this experience and it has been a fantastic opportunity to be a part of such a good team. I especially wish to thank Eva Roos, Carola Ray, Suvi Määttä, Elviira Lehto, Riikka Kaukonen and Anna Ylönen for their various contributions. I would also like to acknowledge and thank the children, parents and preschools who took part in this study.
Special thanks are due to my fiancé Aki for his unconditional love and support; these have been the making of this thesis. I would also like to thank my wonderful family and friends who I am privileged to have in my life. I thank you especially for supporting me in the last months of this project, for understanding my distance and yet, at the same time, looking after me and making sure I get a well needed break.
26 4. REFERENCES
Ahrens, W., Pigeot, I., Pohlabeln, H., De Henauw, S., Lissner, L., Molnar, D., et al. (2014). Prevalence of overweight and obesity in European children below the age of
10. International Journal of Obesity, 38, S99–107. doi: 10.1038/ijo.2014.140
American Psychological Association (n.d.). Socioeconomic status. Retrieved from http://www.apa.org/topics/socioeconomic-status/
Arenz, S., Rückerl, R., Koletzko, B., & von Kries, R. (2004). Breast-feeding and childhood obesity--a systematic review. International Journal of Obesity, 28(10),
1247-1256. doi: 10.1038/sj.ijo.0802758
Armitage, J. A., Taylor, P. D., & Poston, L. (2005). Experimental models of developmental programming: consequences of exposure to an energy rich diet during development. Journal ofPhysiology, 565, 3-8. doi:
10.1113/jphysiol.2004.079756
Ball, K., & Crawford, D. (2005). Socioeconomic status and weight change in adults: a review. Social Sciences and Medicine, 60, 1987–2010. doi:
10.1016/j.socscimed.2004.08.056
Bammann, K., Peplies, J., De Henauw, S., Hunsberger, M., Molnar, D., Moreno, L. A., et al. (2014). Early life course risk factors for childhood obesity: the IDEFICS case-control study. PLoS ONE, 9(2), e86914. doi: 10.1371/journal.pone.0086914
Baker, J. L., Michaelsen, K. F., Sorensen, T. I., & Rasmussen, K. M. (2007). High prepregnant body mass index is associated with early termination of full and any breastfeeding in Danish women. American Journal of Clinical Nutrition, 86, 404-411.
Barker, D. J. (2007). Obesity and early life. Obesity Reviews, 8, 45–49. doi: 10.1111/j.1467-789X.2007.00317.x
Barriuso, L., Miqueleiz, E., Albaladejo, R., Villaneuev, R., & Santos, J. M. (2015). Socioeconomic position and childhood-adolescent weight status in rich countries: a systematic review, 1990–2013. BMC Pediatrics, 15, 129. doi: 10.1186/s12887-015-0443-3
Birch, L. L., & Fisher, J.O. (1998). Development of eating behaviors among children and adolescents. Pediatrics, 101, 539-549.
Brambilla, P., Bedogni, G., Moreno, L. A., Goran, M. I., Gutin, B., Fox, K. R. et al. (2006). Crossvalidation of anthropometry against magnetic resonance imaging for
27
the assessment of visceral and subcutaneous adipose tissue in children.
International Journal of Obesity, 30, 23-30. doi: 10.1038/sj.ijo.0803163
Bürgi, R., Tomatis, L., Murer, K., & de Bruin, E. D. (2016). Spatial physical activity patterns among primary school children living in neighbourhoods of varying socioeconomic status: a cross-sectional study using accelerometry and Global Positioning System. BMC Public Health, 16, 282. doi: 10.1186/s12889-016-2954-8 Cardon, G., De Bourdeaudhuij, I., Iotova, V., Latomme, J., Socha, P., Koletzko, B., et
al. (2016). Health Related Behaviours in Normal Weight and Overweight Preschoolers of a Large Pan-European Sample: The ToyBox-Study. PLoS ONE,
11(3), e0150580. doi: 10.1371/journal.pone.0150580
Cattaneo, A., Monasta, L., Stamatakis, E., Lioret, S., Castetbon, K., Frenken, F., et al. (2009). Overweight and obesity in infants and pre-school children in the European Union: a review of existing data. Obesity Reviews, 11, 389-398. doi:
10.1111/j.1467-789X.2009.00639.x
Chen, E., & Paterson, L. Q. (2006). Neighborhood, family, and subjective
socioeconomic status: How do they relate to adolescent health? Health Psychology,
25, 704-714. doi: 10.1037/0278-6133.25.6.704
Cole, T. J., Bellizzi, M.C., Flegal, K. M., & Dietz, W. H. (2000). Establishing a standard definition for child overweight and obesity worldwide: international survey. BMJ 2000, 320, 1240-1243.
Cole, T. J., & Lobstein, T. (2012). Extended international (IOTF) body mass index cut-offs for thinness, overweight and obesity. Pediatric Obesity, 4, 284-94. doi: 10.1111/j.2047-6310.2012.00064.x
Collings, P. J., Brage, S., Ridgway, C.L., Harvey, N. C., Godfrey, K. M., Inskip, H. M., et al. (2013). Physical activity intensity, sedentary time, and body composition in preschoolers. American Journal of Clinical Nutrition, 97(5),1020–1028. doi: 10.3945/ajcn.112.045088
Cooper, K. & Stewart, K. (2013). Does Money Affect Children’s Outcomes? A
Systematic Review. York, England: Joseph Rowntree Foundation.
Craigie, A. M., Lake, A. A., Kelly, S.A., Adamson, A. J., & Mathers, J. C. (2011). Tracking of obesity-related behaviours from childhood to adulthood: a systematic review. Maturitas 70(3), 266–284. doi: 10.1016/j.maturitas.2011.08.005
Currie, C., Molcho, M., Boyce, W., Holstein, B. E., Thorsheim, T., & Richter, M. (2008). Researching health inequalities in adolescence: the development of the
28
HBSC family affluence scale. Social Sciences & Medicine, 66, 1429–1436. doi: 10.1016/j.socscimed.2007.11.024
Currie, C., Zanotti, C., Morgan, A., Currie, D., de Looze, M., Roberts, C., et al. (Eds.) (2012). Social determinants of health and well-being among young people: Health Behaviour in School-aged Children (HBSC) study: international report from the 2009/2010 survey. Copenhagen, WHO Regional Office for Europe. Retrieved from http://www.euro.who.int/__data/assets/pdf_file/0003/163857/Social-determinants-of-health-and-well-being-among-young-people.pdf (accessed April 2017).
Cutler, D. M., & Lleras-Muney, A. (2006, June). Education and Health: Evaluating
Theories and Evidence. Paper for the conference on "The Health Effects of
Non-Health Policies", organized by the National Poverty Center.
Danielzik, S., Czerwinski-Mast, M., Langnäse, K., Dilba, B., & Müller, M. J. (2004). Parental overweight, socioeconomic status and high birth weight are the major determinants of overweight and obesity in 5-7 y-old children: baseline data of the Kiel Obesity Prevention Study (KOPS). International Journal of Obesity and
Related Metabolic Disorders, 28(11), 1494-1502. doi: 10.1038/sj.ijo.0802756
Darmon, N., & Drewnowski, A. (2008). Does social class predict diet quality? The
American Journal of Clinical Nutrition, 87(5),1107-1117.
Dibben, C., Sigala, M. & Macfarlane, A. (2006). Area deprivation, individual factors and low birth weight in England: is there evidence of an ‘area effect’? Journal of
Epidemiology Community Health, D60(12), 1053-1059. doi:
10.1136/jech.2005.042853
Dietz, W.H. (1998). Health consequences of obesity in youth: Childhood predictors of adult disease. Pediatrics, 101, 518-525.
Donkin, A., Roberts, J., Tedstone, A., & Marmot, M. (2014). Family socio-economic status and young children’s outcomes. Journal of Children’s Services, 2, 83-95. doi: 10.1108/JCS-01-2014-0004
Drenowatz, C., Eisenmann, J. C., Pfeiffer, K. A., Welk, G., Heelan, K., Gentile, D., et al. (2010). Influence of socio-economic status on habitual physical activity and sedentary behavior in 8- to 11-year old children. BMC Public Health, 10, 214. doi: 10.1186/1471-2458-10-214
Dubois, L., & Girard, M. (2003). Social inequalities in infant feeding during the first year of life. The Longitudinal Study of Child Development in Quebec (LSCDQ 1998–2002). Public Health Nutrition, 6, 773-783.
29
Due, P., Damsgaard, M. T., Rasmussen, M., Holstein, B. E., Wardle, J., Merlo, J., et al. (2009). Socioeconomic position, macroeconomic environment and overweight among adolescents in 35 countries. International Journal of Obesity, 33, 1084-1093. doi: 10.1038/ijo.2009.128
Eriksson, J. G., Forsen, T., Tuomilehto, J., Osmond, C., & Barker, D. J. P. (2001). Early growth and coronary heart disease in later life: longitudinal study. BMJ,322, 949–
953.
Esping-Andersen, G. (1990). The three world of welfare capitalism. Princeton, New Jersey: Princeton University Press.
Ferreira, I., van der Horst, K., Wendel-Vos, W., Kremers, S., van Lenthe, F. J., & Brug, J. (2007). Environmental correlates of physical activity in youth - a review and update. Obesity Reviews, 8,129-154. doi: 10.1111/j.1467-789X.2006.00264.x Ford, G., Ecob, R., Hunt, K., Macintyre, S., & West, P. (1994). Patterns of class
inequality in health through the lifespan: class gradients at 15, 35 and 55 years in the West of Scotland. Social Science & Medicine, 39, 1037-1050.
Fratiglioni, L., Winblad, B., & von Strauss, E. (2007). Prevention of Alzheimer’s disease and dementia. Major findings from the Kungsholmen Project. Physiology
and Behavior, 92, 98-104. doi: 10.1016/j.physbeh.2007.05.059
Freedman, S. E., Serdula, M. K., Srinivasan, S. R., & Berenson, G. S. (1999). The relation of circumferences and skinfolds to levels of lipids and insulin: the Bogalusa Heart Study. American Journal of Clinical Nutrition, 69, 308-317.
Fuentes, R. M., Notkola, I. L., Shemeikka, S., Tuomilehto, J., & Nissinen, A. (2003). Tracking of body mass index during childhood: a 15-year prospective population-based family study in eastern Finland. International Journal Obesity and Related
Metabolic Disorders, 27(6), 716-721. doi: 10.1038/sj.ijo.0802271
Galobardes, B., Shaw, M., Lawlor, D. A., Lynch, J. W., & Davey Smith, G. (2006). Indicators of socioeconomic position (part 1). Journal of Epidemiology and
Community Health, 60(1), 7-12. DOI: 10.1136/jech.2004.023531
Gillman, M. W., Rifas-Shiman, S. L., Camargo, C. A., Jr., Berkey, C. S., Frazier, A. L., Rockett, H. R., et al. (2001). Risk of overweight among adolescents who were breastfed as infants. JAMA,285, 2461–2467.
Glendinning, A., Love, J. G., Hendry, L. B., & Shucksmith, J. (1992). Adolescence and health inequalities: extension to Macintyre and West. Social Sciences & Medicine,
30
Goodman, E. (1999). The role of socioeconomic status gradients in explaining differences in US adolescents’ health. American Journal of Public Health, 89,
1522-1528.
Goodman, E., Slap, G. B., & Huang, B. (2003). The public health impact of
socioeconomic status on adolescent depression and obesity. American Journal of
Public Health, 93(11),1844-1850.
Goran, M. I., Gower, B. A., Treuth, M., & Nagy, T. R. (1998). Prediction of intra-abdominal and subcutaneous intra-abdominal adipose tissue in healthy pre-pubertal children. International Journal of Obesity, 22, 549-558.
Gustafson, S. L., & Rhodes, R. E. (2006). Parental correlates of physical activity in children and early adolescents. Sports Medicine, 36, 79-97.
Gutman, L., Brown, J. & Akerman, R. (2009). Nurturing parenting capability: the early
years. Research Report No. 30, Centre for Research on the Wider Benefits of
Learning, London.
Hancox, R. J., & Poulton, R. (2006). Watching television is associated with childhood obesity: but is it clinically important? International Journal of Obesity, 30(1), 171-175. doi: 10.1038/sj.ijo.0803071
Hanson, M. A., & Gluckman, P.D. (2014). Early developmental conditioning of later health and disease: physiology or pathophysiology? Physiological reviews, 94,
1027-1076. doi: 10.1152/physrev.00029.2013
Hardy, L. L., King, L., Hector, D., & Lloyd, B. (2012). Weight status and weight-related behaviors of children commencing school. Preventative Medicine, 55(5),
433-437. doi: 10.1016/j.ypmed.2012.09.009
Hardy, L. L., Mihrshahi, S., Gale, J., Drayton, B. A., Bauman, A., & Mitchell, J. (2017). 30-year trends in overweight, obesity and waist-to-height ratio by socioeconomic status in Australian children, 1985 to 2015. International Journal of Obesity, 41(1),
76-82. doi: 10.1038/ijo.2016.204
Heckmann C, & Marin I. (2013). FINLAND – Country Note – Education at a Glance 2013: OECD Indicators. Organisation for Economic Co-operation and Development 2013. Retrieved from: https://www.oecd.org/edu/Finland_EAG2013%20Country% 20Note.pdf
Hilson, J.A., Rasmussen, K. M., & Kjolhede, C. L. (2004). High prepregnant body mass index is associated with poor lactation outcomes among white, rural women