NBER WORKING PAPER SERIES
CHILD CARE AND MOTHERS' EMPLOYMENT DECISIONS
Patricia M. Anderson Phillip B. Levine
Working Paper 7058
http://www.nber.org/papers/w7058
NATIONAL BUREAU OF ECONOMIC RESEARCH
1050 Massachusetts Avenue Cambridge, MA 02138
March 1999
Prepared for the Joint Center for Poverty Research Conference, "Labor Markets and Less-Skilled Workers," November 5-6 1998. We are grateful for the comments provided by Becky Blank, David Card, and Sandra Hofferth, along with participants of both the November conference and the March "pre-conference." We also thank Doug Staiger for helpful discussions. The views expressed in this paper are those of the authors and do not reflect those of the National Bureau of Economic Research.
© 1999by Patricia M. Anderson and Phillip B. Levine. All rights reserved. Short sections of text, not to exceed two paragraphs, may be quoted without explicit permission provided that full credit, including ©
Child Care and Mothers' Employment Decisions Patricia M. Anderson and Phillip B. Levine NBER Working Paper No. 7058
March 1999
JELNo. J13
ABSTRACT
Rising female labor force participation and recent changes to the welfare system have increased the importance of child care for all women and, particularly, the less-skilled. This paper focuses on the child care decisions of women who differ by their skill level and the role that costs
play in their work decision. After reviewing government child-care programs targeted at less-skilled women, we present a descriptive analysis of current utilization and child care costs. We emphasize differences across skill groups, showing that the least-skilled women both use less costly paid care and are more likely to use unpaid care. We then survey the existing evidence regarding the responsiveness of female labor supply to child care costs, reviewing both econometric studies and
demonstration projects that include child care components. To investigate variation in the response to child care cost across skill levels, we implement models similar to this past literature. We conclude that while the overall elasticity of labor force participation with respect to the market price
of child care is between -0.05 and -0.35, this elasticity is larger for the least skilled women and declines with skill. Throughout the paper, we reflect upon the implications of our analysis for welfare reform.
Patricia M. Anderson Phillip B. Levine
Department of Economics Department of Economics
Dartmouth College Wellesley College
Hanover, NH 03755-35 14 Wellesley, MA 02181
and NBER and NBER
I. INTRODUCTION
The employment of mothers with small children has exploded over the past few decades, outpacing the growth among any other large demographic group. In 1947, only 12 percent of women with children under the age of six were in the workforce, but that level jumped to 32 percent by 1970 and 62 percent by 1996. An obvious implication of the increased labor force activity of women is the concomitant increase in the importance of the market for child care.
An inclusive economic analysis of the child care market and public policies directed towards it would address at least three central research questions:' (1) how responsive is the demand for child care and labor supply decisions to the cost of care; (2) how do differences in the quality of child care services affect the demand for child care services and children's
development, and (3) are there imperfections in the market for child care that can justify government intervention. But recent changes in public policy place heightened importance on answering the first question. Welfare reform legislation enacted in 1996 includes lifetime limits
on benefit receipt and sets goals for the states to move recipients into employment. An important constraint in meeting these goals and moving welfare recipients into the labor market is the cost and availability of child care. Additional federal funds have been allocated for child care
subsidies, but it is unclear whether the increase in spending is big enough to sufficiently alleviate this constraint.
Although a significant literature exists examining the role of child care costs in the labor supply decision of women, much less attention has been focused explicitly on those with
less-Hofferth (1991) and Council of Economic Advisers (1997) for a broad discussion of important issues in the analysis of child care markets. For the most part, research has addressed quality separately from the impact of child care costs on the quantity of child care purchased, although Blau and Hagy (1998) is an important exception.
skill, who will disproportionally be affected by welfare reform. Yet the obstacle imposed by child care costs is not uniform for all women; those high-skilled women with high potential market wages can clear that hurdle more easily than the less-skilled. For the less-skilled, the lack of low cost child care may be a crucial determinant of their own employment decisions. Their lower earnings capacity may make home production a more attractive option than employment in the formal labor market. Alternatively, the lower levels of income for the less-skilled may force them into the labor market regardless of relatively small differences in the cost. Therefore, one may not expect a uniform response to changes in child care costs across the skill distribution.
This paper will focus on the child care decisions of women who differ by their level of skill, as measured by their level of education, and the role that costs play in determining their labor force participation. Our analysis will include four separate components. First, we will review the institutional background of the market for child care, focusing mainly on the government programs targeted at less-skilled women. Second, we will conduct a descriptive analysis of the utilization and cost of child care services, paying particular attention to differences that exist among women with different levels of skill. Third, we will survey the existing
evidence regarding the responsiveness of female labor supply to child care costs, reviewing both econometric studies and the results of several demonstration projects that include child care components. Finally, since the econometric studies do not focus on less-skilled women, and the responses to child care incentives from demonstration projects are difficult to interpret, we conduct our own econometric analysis. In this analysis we focus not only on variation in the response to child care cost across skill levels, but also on reconciling some of the differences in
the literature. Throughout the paper, where appropriate we will reflect upon the implications of our analysis for welfare reform.
In the descriptive section, we show that the least skilled women are less likely to use paid care overall and to pay less for that care, although this represents a larger fraction of family income. These women are much more likely to use relative care than other women, but are more likely to pay for this type of care. From our econometric analysis, we conclude that for women with children under 13, the elasticity of labor force participation is between -0.05 and -0.35. We also establish that this elasticity is larger for less-skilled workers and declines with skill. This relationship holds not only for all women with children under 13, but also within subgroups defined by marital status, age of youngest child and family poverty status. Even though the effects of subsidizing child care are thus predicted to be largest for the least skilled, levels of employment for women in these groups are likely to remain far below those of other groups of women, even if substantial subsidies were available.
II. INSTITUTIONAL BACKGROUND
The past two decades or so has seen a significant increase in federal policy designed to help defray the costs of child care. Over this period, a number of different policies have been
introduced and modified, many of which are targeted at women in low-income households. New policies and modifications of existing policies frequently coincided with reforms to the national
welfare system. This section will describe the development of these policies.2
2Thjs discussion is based mainly on information available in The Green Book (U.S. House of Representatives,
The longest running of these programs, Head Start enacted in 1965, created subsidized child care as a side effect of a policy designed to improve the development of low-income children. Head Start is a classroom-based program for pre-school children from low-income families that is intended to provide the necessary skills for them to succeed when they enter elementary school. Because the program takes young children out of their homes during the program's hours of operation (typically a few hours in the morning), however, it effectively acts a subsidized child care program. Since the daily program only lasts a few hours, mothers would still be required to find additional child care to accept anything other than short part-time jobs. Nevertheless, it lessens the need for extensive child care services and may, for instance, facilitate the provision of child care by a family member or friend who may only need to fill-in for a few hours rather than the whole day. Additionally, some programs coordinate with local day care providers. In fiscal year 1997, Head Start expenditures totaled almost $4 billion.
Among programs currently in existence that are targeted specifically at child care, the Child Care Tax Credit (CCTC) has been in place the longest. The CCTC was instituted in 1976 as a replacement for an earlier tax deduction policy; it currently provides a nonrefundable tax credit of up to $4,800 for households with two or more children in which expenditures on child care are required to enable the individual to work. Families with $10,000 in annual income or less are allowed to take a credit of 30 percent of their expenses and the credit rate falls gradually to 20 percent for families with $30,000 in annual income or more. Although the statutory provisions seem to favor low income households, the fact that the credit is nonrefundable significantly limits its value to those at the bottom of the income distribution. Figure 1 presents evidence to that effect, displaying the percentage of families with children that took advantage of
the credit in 1994, by level of income.3 It shows that the credit is utilized most extensively by families in the middle to upper parts, but not the very top, of the income distribution. The cost of the tax credit in that year was $2.5 billion.
In 1988, two major new programs were initiated through the Family Support Act (FSA) that provided direct expenditures on child care for low-income households. That law required that all recipients of Aid to Families with Dependent Children (AFDC), the main cash transfer component of the welfare system at the time, with children age three and over with guaranteed
child care be required to participate in some work-related activity through the JOBS (Job Opportunities and Basic Skills) program. The FSA also instituted another child care program, called Transitional Child Care, which covered former AFDC recipients for one year after leaving welfare for work. The federal government shared the cost of providing the child care for these programs with the states. In the 1996 fiscal year, the last year of these programs, the federal government's share of these costs was just over $1 billion.
Two additional programs were instituted in 1990, the Child and Dependent Care Block Grant (CDCBG) and the At-Risk Child Care Program. In the former, block grants were awarded to states on a matching basis and states were required to spend those funds to provide child care services to low-income families. This program cost the federal government $935 million in
1996. The latter program was designed to provide funds to states to identify and provide
subsidies to those individuals who are "at-risk" of requiring the assistance of the welfare system
3me source of these data is US Department of Treasury (1997). Gentry and Hagy (1996) present similar information for 1989.
because child care constraints are limiting their ability to work. Its cost was $291 million in 1996.
Welfare reform legislation enacted in 1996 considerably simplified this web of programs providing subsidized child care for different categories of low-income families. It eliminated the child care expenditures associated with the AFDC/JOBS program, Transitional Child Care and At-Risk Child Care and broadened the existing block grant to incorporate these other programs. The new block grant is now called the Child Care and Development Fund (CCDF) and $2.8 billion was made available in 1997 for this program. Although the CCDF was designed to
simplify the system of providing child care subsidies at the federal level, there still remains a separate federal block grant, funded under Title XX of the Social Security Act, which can be used to fund child care. Under this program, about $2.5 billion was spent in 1997 for social services of all kinds, with about 15 percent spent on day care services in particular.
Total federal spending on child care programs targeted at the welfare population has risen dramatically over the past decade. As shown in Figure 2, the rise has been continuous with a
noticeable increase at the time welfare reform legislation went into effect. At the beginning of the decade, about $1.25 billion was spent on AFDC child care, Transitional Child Care, the CDCBG, and At-Risk Child Care. This level increased by about $1 billion through 1996 before jumping another $700 million in 1997 when these programs were combined into the CCDF. By 2,002 spending on this new program is scheduled to increase to almost $4 billion, tripling in just
over a decade.
States also play a role in the provision of child care services beyond providing the matching funds required by some federal programs. Many states undertake their own tax and
subsidy programs. In 1994, for example, 23 states provided a tax subsidyfor child care costs, which Stoney and Greenberg (1996) have estimated to be worth between $175 and$350 million. Similarly, they note that studies suggest that up to $1.2 billion mayhave been spent in fiscal year
1990 on state child care initiatives, although some of this money was likely obtained from federal sources. A major role of state and local governments is in the regulation of child care quality, mostly in family- or center-based care. States typically address such issues as caregiver qualifications, protective features (such as immunization requirements), group size and
staff/child ratios, and other general features. Although issues of child care quality are extremely important in the market of child care, they are beyond the scope of this paper and we do not address them here.
III. DESCRIPTIVE ANALYSIS OF UTILIZATION AND COST
In order to analyze differences across skill level in the utilization and costof child care, we use data from four panels of the Survey of Income and Program Participation (SIPP). A full set of child care questions were asked during Wave 3 of the 1990, 1991and 1993 panels,
covering the use of care during the Fall of that year. While the questions cover all children up to age 14, we limit our sample to women with children under the age of 13. The 1992 panel asked these questions during Wave 6, which also covers the fall of 1993. Thus, our datareflect conditions in the Fall of 1990, 1991 and 1993. Throughout the empirical section, we use
4As is done for Census publications, weights in the 1992 and 1993 panels are scaled so that the pooled data properly reflect the fall 1993 population.
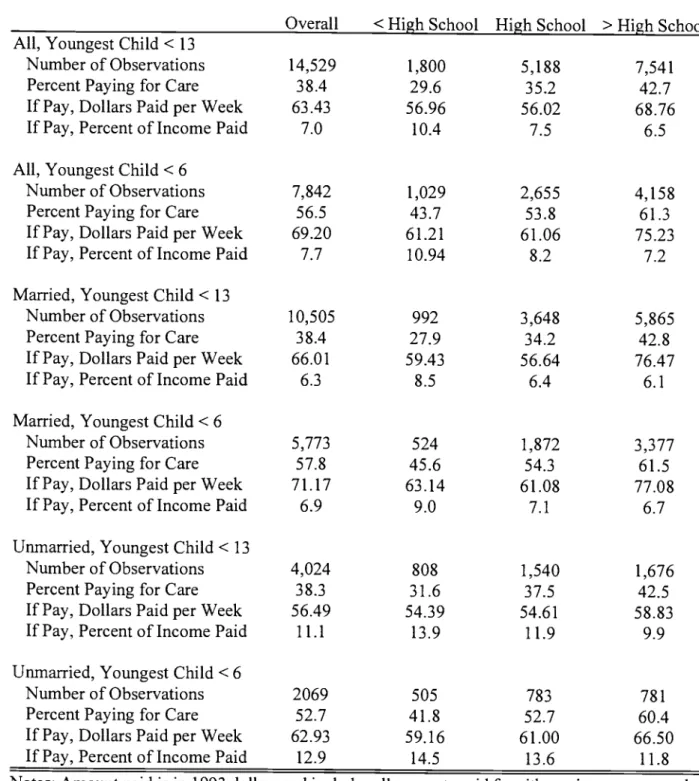
education to proxy for skill level.6 Table 1, then, presents information on the fraction of families using child care that pay for that care, and for these families the amount paid relative to family income, separately by mother's education and marital status.
Looking first at all families with at least one child under 13, about 38 percent used some type of paid child care. Of these, the average amount paid per week was $63, or 7 percent of family income, but clear differences across skill levels are apparent.7 Compared to the most skilled mothers (those with education beyond high school), the least skilled mothers (those not finishing high school) are both less likely to pay for care and to pay less in absolute terms when they do pay. Just under 30 percent of the least skilled pay for care, while almost 43 percent of the most skilled do. The differences in the cost of care are most apparent for the highest skilled, who pay about $69 per week, compared to $56or$57forthe medium and low-skilled mothers, respectively. However, the least skilled pay a higher proportion of their income, 10.4 percent compared to just 7.5and6.5percentfor the higher skilled groups. Given the differences in the proportions paying for care, there is very little difference in the share of each group's total income (for payers and non-payers) spent on child care, at about 3 percent for each group.8
6We split the sample into three groups, those with less than a high school education, high school graduates and those with more than a high school degree. The overall numbers of women in these last two groups are about equal and provide reasonable sample sizes for the econometric analysis which follows. To maintain consistency, we do not separate out college graduates for the descriptive analysis, even though differences in labor force participation lead to quite different sample sizes here.
7One may think that the share of the mother's earnings, rather than family income, that goes to child care is the appropriate measure because it better reflects the extent to which these costs reduce the returns to work. However, family well-being is better reflected by the income share measure. For this reason, and for the purposes of consistency with previous work, we present costs as a percentage of income. Patterns across groups of costs as a share of earnings are qualitatively similar to those reported here.
A similar pattern appears when looking only at those with at least one child under 6. Within this population, unmarried mothers with less than a high school degree may provide a relevant comparison group for those eligible for welfare. Across marital status groups, only 44 percent of mothers with less than a high school degree whose youngest child is under 6 pay for care, while 61 percent of those with more than a high school degree pay. The high skill group consistently pays more for care, but again, as a fraction of income the cost falls with skill level, from 10.9 percent to 8.2 percent to 7.2 percent. These same patterns are apparent for both married mothers and unmarried mothers and the fractions paying for care are also fairly similar. The most notable difference across marital status is that child care costs as a share of family income are almost twice as large for unmarried mothers. This difference is clear in Figure 3 which presents costs as a share of family income for mothers with children under 6, by mother's education, highlighting the main findings of Table 1.
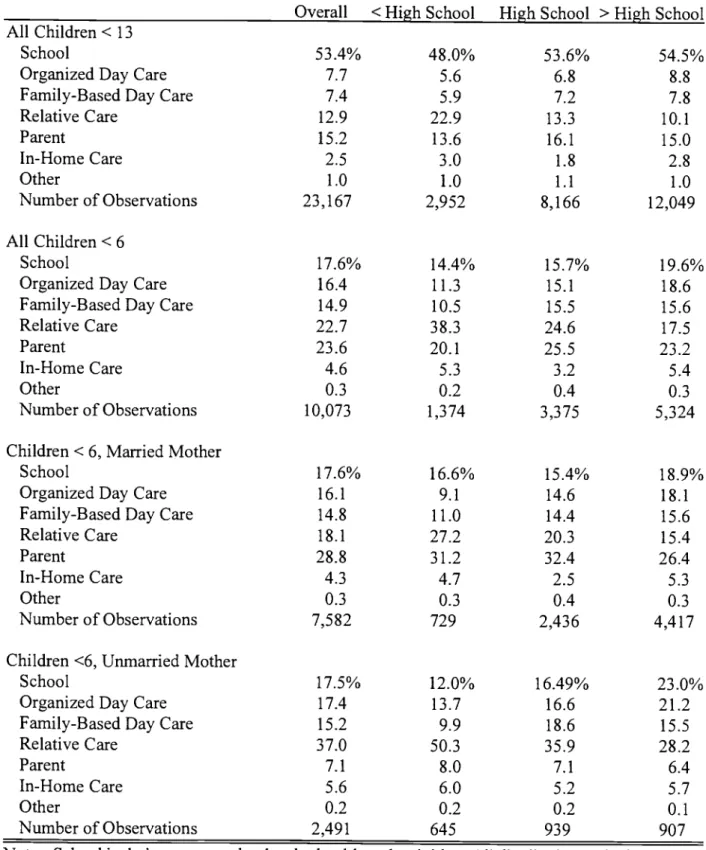
Differences across skill groups such as these are likely to represent diversity in the choices made regarding the type of child care used. Thus, Table 2 presents the distribution of primary type of child care utilized for each child, by mother's education and marital status. Note that the unit of observation here is the child, unlike in Table 1 where the family was the unit of
observation. Looking first at all children under 13, it is clear that school (including nursery school and school-based activities) is a major source of child care. For children under six, however, it is utilized to a far less extent. Focusing on the younger children, the most noticeable
difference is that children of less-skilled mothers are over twice as likely to be cared for by a relative than are the children of the most-skilled mothers. Almost 38 percent of all children under six in care whose mothers have less than a high school degree are cared for by relatives,
compared to only 24 percent and 17 percent of those whose mothers have a high school degree and more than a high school degree, respectively. Looking across marital status groups, it is not surprising to see that children of unmarried women are very unlikely to be cared for by their other parent.9 However, other relatives are much more likely to provide care, so that the use of
school, organized facilities and family-based care are fairly similar for children of married and unmarried women. However, children of the least-skilled unmarried mothers are a bit more likely to be in organized day care.
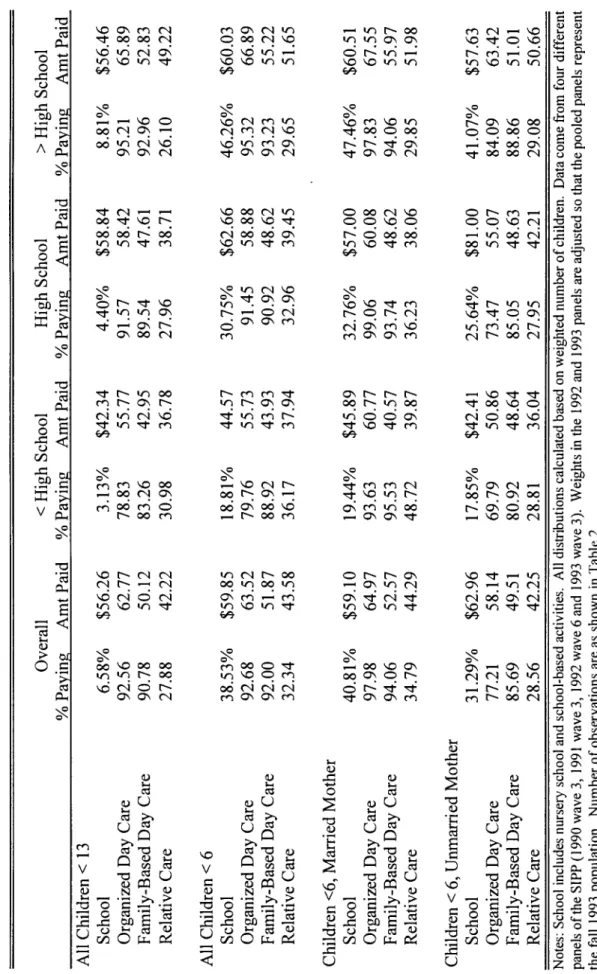
Table 3 shows, by type of care, the fraction of children whose families pay for that child's care and the average amount spent per week for it, by mother's education and marital status.'° Because most children between ages six and twelve are in school and do not pay for it, we again focus on the child care arrangements for those under age 6. Most children in relative, non-school care are in paid care. Over 90 percent of mothers whose children are in family or
organized day care facilities pay for the service. These percentages, along with the amount paid for those paying, increase with the level of skill. The majority of children in school-based
settings or those being cared for by relatives receive care at no cost. For those in school,
however, only 19 percent of children of less-skilled mothers pay for care, compared to 46 percent of children of more skilled mothers. Children of more-skilled mothers also attend more
expensive schools. Interestingly, the least-skilled mothers are more likely to pay for relative care than are more-skilled mothers. Because of their greater use of relatives' services in this regard,
9Since the majority of children age 6 to 12 are in school, we present the marital status breakdown for children under
6 only.
10Since parent care is defined by the survey to be unpaid, and since very few children use in-home care or other arrangements, these categories are not reported.
these women may only be able to recruit more of them at a price. Looking across marital status groups, younger children of unmarried mothers using organized and family day care are less likely to be in paid care. This discrepancy by marital status is most noticeable for the least skilled, and most likely reflects the fact that the majority of child care programs are associated with the welfare system. Hence, unmarried mothers are much more likely to have access to free care than are married mothers.
Figure 4 uses the findings for children under 6 to illustrate the highlights of Tables 2 and 3. Each bar represents the percent of children in the given type of care, while the shaded portion of the bar represents those paying for that care. The average amount paid is shown at the top of the bar.
Overall, then, it is clear that there are consistent differences across skill level in the utilization and cost of child care. Most notable in terms of utilization is that the use of relative care drops sharply with mother's education. Interestingly, there are very few differences in utilization across marital status, other than other relatives substituting for fathers as caregivers for children of unmarried mothers. Most notable in terms of costs is that the amount paid tends to increase with skill, but that given the income disparities across groups, a much larger fraction of income is spent by the low-skill mothers who pay for care. Due to the much lower incomes of families headed by a single mother, the fraction of family income spent on child care is much larger for unmarried mothers. Finally, for all groups the probability of paying for care generally rises with skill, with the notable exception being relative care, where it drops.
What do these results tell us regarding the potential usage of day care services by the additional million or so mothers with children under 6 who may enter the labor market as a result
of welfare reform? One source of information is the decisions made by welfare recipients in the past. Within our sample from the SIPP are 553 welfare recipients with children under 6 who are using child care. While these sample sizes are too small to reliably investigate the types of care
used, we can calculate that 36.7 percent of these AFDC mothers with children under 6 pay for care, and those paying spend an average of $57 per week But historically most welfare recipients did not work (perhaps because of child care constraints) and thosewho did may not be
representative of those who will be forced to enter thelabor market following welfare reform. An alternative reference group is all single mothers with childrenunder age 6 who have dropped out of high school. For these women, as was seen in Table 1, a slightly higher fraction use paid
care, at 41.8 percent. Weekly costs are fairly similar for this group and the AFDC group, at $59. We can use these statistics to conduct back-of-the-envelopcalculations regarding the cost that would be required to provide fully subsidized day care for these onemillion women,
assuming that there is an unlimited supply of the type of care currently used." If only 41.8 percent of these women required paid care to enterthe labor market, as their reference group does, we would expect the total cost to equal $1.28 billion per year (1 million times $59*52 per year times 41.8 percent using paid care). Realistically, however, more of the women who would
otherwise turn to welfare will likely require paid care than this reference groupbecause if free care were available through, say, a relative, they would have been more likely to utilize those services already. Alternatively, then, one could provide an upperbound on the cost by assuming that all will use paid care. In that case, the additional cost to provide fullysubsidized day care for
11These estimates are likely to be understated because they assume unlimited availability of the typesof care
currently used by unmarried, low-skill mothers at the current market price. As more mothers demand these services, their cost may rise.
each of the one million women would be $3.08 billion per year. These estimates compare to an increase in federal funding brought about by welfare reform of $4 billion over 6 years, or about $667 million per year. Thus, the currently planned increase in federal spending could provide a subsidy of between 22 and 52percentfor each of the women likely to enter the labor market due to welfare reform.
IV. EXISTING EVIDENCE ON CHILD CARE COSTS AND EMPLOYMENT
The existing evidence on the impact of child care costs on the employment decisions of women comes mainly from econometric studies using non-experimental data, although a few do take a "natural experiment" approach to the issue. Another potential source of information is from government-sponsored demonstration projects. Many of the pilot welfare-to-work programs included a child care component, implying that evaluation of the outcomes of these projects may be able to shed light on the role of child care in the employment decision of poor
women. This section of the paper will review the research that has been completed in both of these broad categories, beginning with the demonstration projects.
Evidence obtained from Demonstration Projects
Government-sponsored demonstration projects often offer considerable advantages in examining the impact of alternative policies on individual behavior. Those that are well-designed require a sample of individuals eligible for a particular program to be randomized into treatment and control groups that should be comparable on any (observable or unobservable)
and those in the control group face an environment which is no different than what they would ordinarily experience. A simple comparison of the aggregate behavior of members of the treatment and control groups will then identify the impact of the policy.
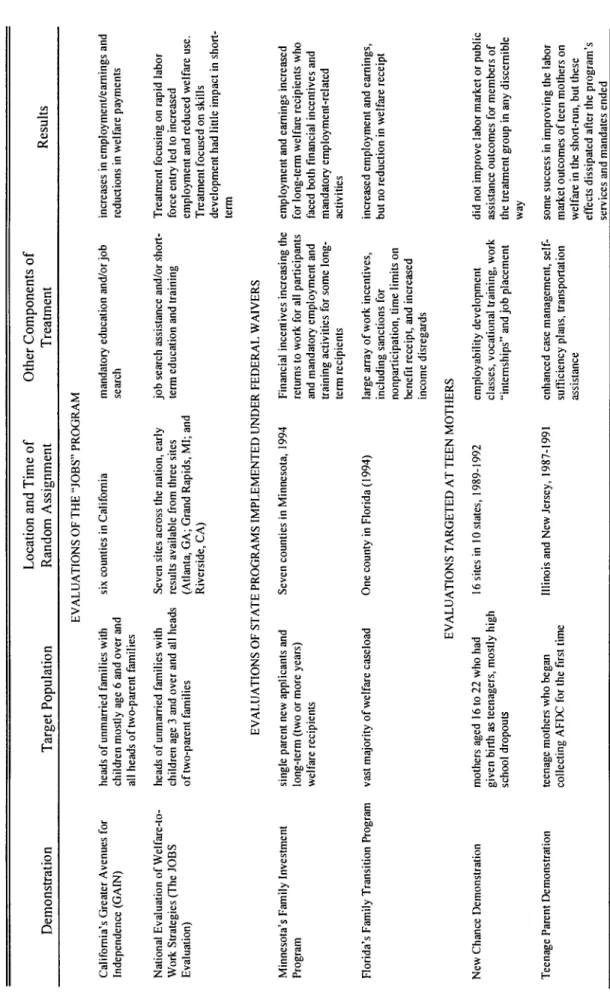
Policies that reduce or eliminate the cost of child care have been included in a number of recent demonstration projects targeted at improving the labor market performance of different subgroups of less-skilled workers. These projects are summarized in Table 4, which categorizes them according to both the policy initiatives that instigated the demonstration and the target population. Many of the demonstrations began as evaluations of early welfare reform policies like the "JOBS" (Job Opportunities and Basic Skills) program initiated under the 1988 Family Support Act and federal waivers granted to states to introduce alternative welfare policies under the Aid to Families with Dependent Children (AFDC) system. They all include a large array of financial incentives and participation requirements in addition to enhanced services, including child care. Because so many different policies are incorporated into the treatment, it would be difficult to quantify the specific role that the child care component played if large employment gains are observed.'2 On the other hand, if little or no increases in employment are observed, one
'2To our knowledge, the only large scale randomized trial in which the treatment consisted solely of changes in child care costs, was conducted in conjunction with the Gary Income Maintenance Experiment in the 1970s. The results of this study were largely inconclusive because of small sample sizes and very low take-up rates of the subsidy among treatment group members (Behrens, 1978). Regardless of the results, it is difficult to assess the relevance of an experiment regarding female labor force participation from so long ago when such a smaller share of the female population worked. The only other large scale randomized trial that has ever been planned was the Expanded Child Care Options (ECCO) Demonstration in New Jersey. It had been on the drawing board for several years (Gueron and Pauly, 1991), but unfortunately was never conducted.
may reasonably conclude that the provision of additional child care services probably did little to improve the labor market success of these women.'3
Results from the different demonstrations are somewhat mixed, depending upon the target population and the services/incentives provided. Those demonstrations conducted in conjunction with the JOBS program and with state waiver policies generally did increase employment levels of the welfare population. Although some of the employment gains were impressive in percentage terms, the absolute gain in employment rates was typically quite small. For instance, in the third year of the California GAIN demonstration, 40 percent of the treatment group worked at some point during the year compared to 34 percent for the control group -about
an 18 percent increase in employment rates. With a moderate employment effect such as this, and the large array of other components of the treatments, it seems unlikely that child care played a very large role in increasing employment.'4 Moreover, in the evaluations targeted at teen mothers that included child care assistance, little success in improving employment rates was
observed. Although the confluence of services, mandates, and incentives in these demonstrations suggests caution is required in interpreting their results, based on this evidence it seems
reasonable to conclude that subsidized child care may have a modest effect, at best, in increasing employment levels of very low-skilled, single mothers with small children.
13An important caveat before drawing such a conclusion is that it is difficult to ascertain the value of the child care component of these treatments. Although members of the control group were not eligible for the special child care services offered to members of the treatment group, they were still eligible for any ongoing programs through which they would normally be eligible to receive child care assistance. Therefore, if no treatment effect is observed, one may alternatively conclude that the benefits provided to mothers in the treatment group were not significantly greater than those offered to members of the control group.
if the observed increase in participation could be attributed solely to the child care treatment, the effect of subsidized care would be considered relatively large.
Econometric Evidence
A substantial body of research has used data generated in a non-experimental setting along with econometric techniques to explore the relationship between child care costs and female labor supply. The existing literature has employed many different methodologies, data sets, and sample restrictions, so it is perhaps not surprising that the range of estimates of the elasticity of employment to child care costs is reasonably large. In this review we present a
summary (that is not intended to be exhaustive) of the econometric evidence that has been gathered to date, which focuses narrowly on this one important issue in the child care market.
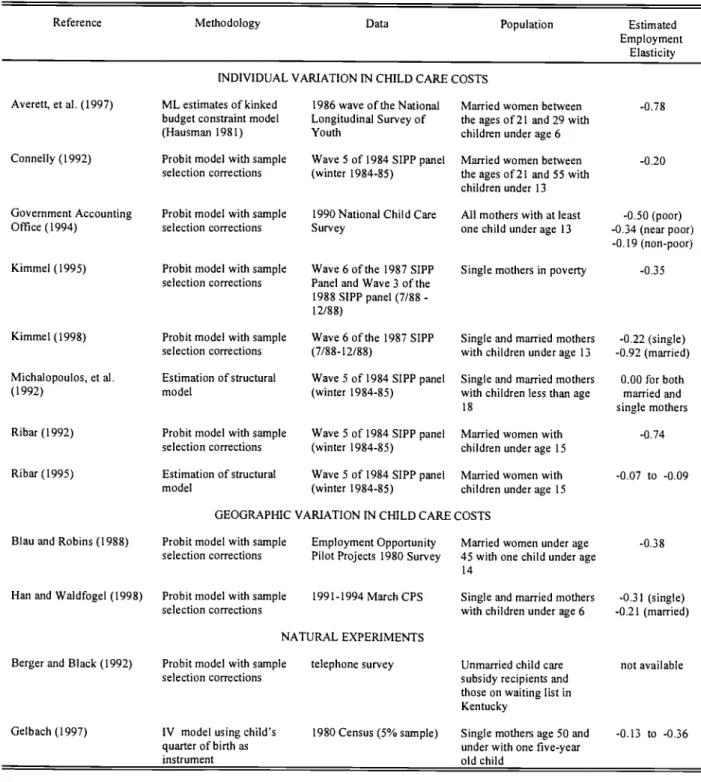
One useful way to categorize these studies is to consider the source of the variability in child care costs and the methodological approach taken to study the impact of that variability on employment decisions. Table 5summarizesselected previous research in this maimer. The most common approach uses the variation that exists in child care costs across individuals. These costs vary because of things like the type of care utilized and regional differences in day care costs. Some studies also rely on differences in the tax treatment of child care expenditures that vary nonlinearly with family income.
Most of these papers employ a similar methodology. A probit model is estimated on the discrete employment decision and the key covariates are the wage rate and child care costs. Because both of these variables are only observed for those women who have chosen to work, predicted values obtained from regression models for employed women and those who use paid child care are used instead. Corrections are made for the potential sample selection bias that may result from estimating these prediction equations on only these subsets of women.
Other methodological approaches are also utilized that take advantage of individual variation in child care costs. Michalopoulos, et al. (1992) and Ribar (1995), for instance, formulate a complete structural model based on utility maximizing behavior and specific functional form assumptions and estimate the parameters of the model. Averett, et al. (1997) applies the approach introduced by Hausman (1981) for incorporating the nonlinearities of the budget constraint faced by individuals because of the specific features of the tax system. In their case, they exploit the variation created by the Child Care Tax Credit. They estimate a maximum likelihood model that incorporates the probability that an individual's choices rest on any
particular segment of that budget constraint.
Some studies use only geographic variation in the costs of child care. Methodologically these studies are quite similar to those described earlier that estimate probit models including
sample selection corrected predictions of child care costs and wages; the obvious difference is that the child care cost varies only by location of residence and not across individuals.
The final methodological approach examines the impact of events that exogenously separate women into different child care cost categories, called natural experiments, and then compare employment patterns across the different groups. For instance, Berger and Black (1992) consider differences in employment between two groups of low-income women in Kentucky, one of whom is enrolled in a program that provides subsidized day care and the other group that is on a waiting list for the program. Because both groups have at least attempted to enroll in the
program, one could argue that they must have similar observable and unobservable
characteristics. A second natural experiment, studied by Gelbach (1997), examines employment of single mothers whose five-year old children differ by their quarter of birth. Because public
schools effectively provide fully-subsidized day care, mothers of children born just before a school's enrollment cut-off date should be more likely to work in the year their child turned five compared to mothers whose children were born just after that date.
All of these research designs contain potential weaknesses. The sample selection correction techniques employed by most studies require for proper identification variables that are related to an individual's decision to work, but unrelated to potential wages or child care costs. Similarly, in order for the final probit to be identified, there must be variables related to potential child care costs that are not independently related to the employment decision.
Different studies take different approaches to this issue, with many of the decisions seeming very ad hoc, at best)5 Those papers that estimate structural models encounter additional difficulties in that a number of functional form assumptions need to be made that may or may not accurately reflect individual behavior. Perhaps the well-conceived natural experiments provide the strongest methodology, but their results, based on low-income women in Kentucky and single mothers of five-year olds, cannot necessarily be generalized to the entire population of mothers with children.
Bearing in mind these potential weaknesses, these studies do virtually uniformly find a negative relationship between child care costs and maternal employment, regardless of the econometric technique. Nevertheless, as can be seen in Table 5,therange of estimated
employment elasticities with respect to a change in the cost of child care across studies is rather
'5me importance of these decisions is underscored by Kimmel (1998), who concludes that most of the difference between the highest and lowest elasticity estimates using this methodology can be attributed to the specific explanatory variables included in the model. In performing this sensitivity analysis to determine the factors that underlie the difference in estimated elasticities reported by Connelly (1992) and Ribar (1992), she dismisses the importance of the type of probit (bivariate or univariate) used for the selection correction and the metric used for the child care cost measure.
large, ranging from just over zero to almost one. There does seem to be some clustering of estimates around an elasticity of about -0.3 to -0.4 or so.'6 However, the papers taking a structural approach are uniformly on the low end of the estimates, between 0 and -0.1. Aside from the methodological differences discussed above, some studies use data on all mothers, while others use single mothers, and still others concentrate on married mothers. Some focus on mothers in low-income families. Some restrict their analysis to women with pre-school age children (under age 6), while others include women with children up to age 15. Under these circumstances, pinning down the specific factors that generate the discrepancies across studies is virtually impossible. Additionally, none of the existing studies focus directly on differences across skill levels, the key issue for this study. Thus, in the next section we perform our own econometric analysis using the pooled SIPP data described earlier, with an eye toward both evaluating the overall stability of the estimates and investigating the effect of skill level.
V. ECONOMETRIC ANALYSIS USING 1990 -1993SIPP DATA
For our econometric analysis, we employ the most common methodological approach used in this literature, a probit model relating maternal employment to wages and child care costs, controlling for sample selection problems. In order to specify the estimating equations, one must first consider what the underlying structural equations look like. There are four such underlying equations: a wage equation, a market price of care equation, a conditional use of paid care equation, and a labor force participation equation. As discussed in more detail below,
t6Cleveland, Gunderson and Hyatt (1996) find a similar elasticity of -0.39 for married mothers of pre-schoolers in Canada.
reduced form versions of these latter two are necessary for estimating selection corrected
versions of the former two. It is then the labor force participation equation that provides us with estimates of the elasticity with respect to child care costs, as measured by the market price. Note that in measuring costs in this way, we directly estimate the policy-relevant concept of the overall response to a subsidized price of child care.
The basic approach starts by specifying the wage equation as a function of human capital variables and labor market characteristics. Similarly, the market price of care is specified as a function of demographic characteristics thought to influence the type of care chosen and child care market characteristics. The probability of using paid care is expected to be a function of similar demographics reflecting preferences, variables representing availability of unpaid options, and the market price of care. Finally, labor force participation is modeled as a function of
variables capturing nonmarket opportunities, demographics that may reflect preferences for labor versus leisure, the market wage, and the market price of care. While the exact specification varies by study, all follow this basic approach. We obtain our specification by beginning with the reasonably parsimonious specification used in GAO (1994), and altering it somewhat to reflect the available data and our judgment about appropriate variables.
Starting then with our specification of the wage equation, the model underlying our
estimates is:
(1) ln(hourly wage) =f(race,education, age, age2, marital status, number of children, urban
status, region, disability status, state unemployment rate, year).
Compared to GAO (1994), we first switch from experience and experience squared to age and age squared. Since GAO measured experience simply as age minus education minus 6, this is
not a large change. To better capture likely work experience, we add a variable for number of children to account for the possibility that time has been spent out of the market. We also add an indicator for if the mother has a health problem. This can proxy for both lost time due to health problems and restrictions on the types ofjobs that can be done. We also add the unemployment rate in the state in that year, to capture the tightness of the labor market.'7 Finally, we add year dummies to account for any other changes in the wage structure over the time period.
Our specification of the market price of care equation, which incorporates some slightly more significant changes to the GAO model, is as follows:
(2) ln(market price of child care per hour worked) =f(numberof children under 6, number of children age 6 to 12, presence of older children, presence of an adult other than self or spouse, presence of an unemployed adult, other family income, age, education, marital status, urban status, region, year).
In this case, we first switch the dependent variable from price of care per week to the log of the price of care per hour worked. We also switch from an indicator for the presence of additional income beyond own and spouse's earnings, to the amount of that other income. We then add age, as it may correlate with a preference for different types of care. Additionally, older mothers may be less likely to have parents that are viable child care providers. We also add an indicator for whether an unemployed adult is in the household (this is in addition to the indicator for any other adult). By contrast, the GAO report uses this variable only in the probability of paid care equation. However, the labor force status of the adult may impact both the availability of such an adult to provide child care, and how much (if any) is paid for that care. Recall that for close to
28 percent of the children in relative care, that care is paid for. Year dummies are added to account for any other changes in the child care market over the time period.
A participation equation is important both for the final estimates and for creating selection correction terms for the wage and cost of care estimates. Our equation is:
(3) P(in labor force) =f(ln(hourlywage), ln(hourly market price of child care), other family income, number of children under 6, number of children age 6 to 12, age, marital status, education, disability status, urban status, state maximum AFDC benefits),
where again we have made some significant alterations to the GAO model. First, we add other family income (as above) and maximum AFDC benefits for a family of 3 in the state in that year to capture nonlabor market income opportunities. We also add the indicator for if the mother has a health problem, since such problems can interfere with market work. Finally, we add age and education, to proxy for cohort and peer group differences in the propensity to work.
Although we do not estimate a structural use of paid care equation, it is useful to specify one before turning to the reduced form version necessary for the selection model. Our
specification is:
(4) P(pay for child care using child care) =f(ln(hourlywage), ln(hourly market price of child care), presence of older children, presence of an adult other than self or spouse, presence of an unemployed adult, race, age, education, marital status).
Essentially, we assume here that presence of potential care-givers will be important, and that age, education and race may be correlated with preferences for formal versus informal care. Based on these specifications, we obtain the following reduced form equations:
(5) P(inlabor force) =f(race,education, age, age2, marital status, number of children, urban
status, region, disability status, state unemployment rate, year, number of children under 6, number of children age 6 to 12, presence of older children, presence of an adult other than self or spouse, presence of an unemployed adult, urban status, other family income, state maximum AFDC benefits),
(6) P(pay for child care) =f(race,education, age, age2, marital status, number of children,
urban status, region, disability status, state unemployment rate, year, number of children under 6, number of children age 6 to 12, presence of older children, presence of an adult other than self or spouse, presence of an unemployed adult, other family income). Equation (5)isthen used to construct a selection correction term that is included in wage equation (1). A bivariate probit is used to jointly estimate (5)and(6) to obtain two separate selection correction terms that are included in the market price of care equation (2). The predicted wage and predicted market price of care are then used in equation (3) to estimate the effect of child care costs on labor force participation.
Thus, the selection correction model used to predict the wage is identified by excluding number of children under 6, number of children age 6 to 12, presence of older children, presence of an adult other than self or spouse, presence of an unemployed adult, other family income, state maximum AFDC benefits and the state unemployment rate from the wage equation. Similarly, the selection correction model for the market price of child care is identified by excluding the state unemployment rate, the state maximum AFDC benefits, the total number of children, disability status, and age squared from the cost of care equation. At the same time, the effect of the wage is identified in the final probit due to the exclusion of race, region, year, total number of
children, the state unemployment rate, and age squared from the structural probit. Similarly, the cost of care is identified by excluding presence of older children, presence of an adult other than self or spouse, presence of an unemployed adult, region and year from the structural probit)8 While not everyone may agree with the choices made, it does appear to result in a relatively stable model, as detailed below, much more so than does the GAO specification upon which it is
based.
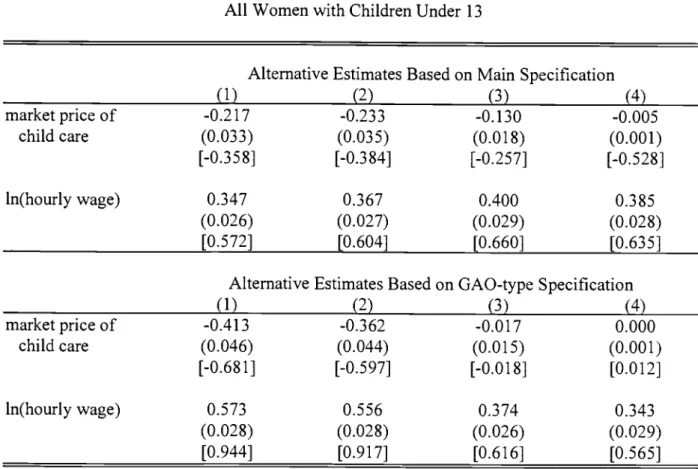
The stability of our model compared to the GAO specification is investigated in Table 6. For this stability check, we first estimate the baseline specifications just described on the full sample of all mothers with children under the age of 13. These specifications are shown as model (1) in Table 6. We then make a series of small changes to the specifications. Model (2) changes the bivariate selection model used in the prediction of the price of child care to a simple univariate selection model based only on the use of paid care. Maintaining the univariate
selection, model (3) measures the price of child care as the level of the price per hour worked, while model (4) measures it as the level of the weekly price. These changes represent the main types of alternatives represented by the past literature.
In the top panel, we see that across all models, our specification leads to elasticities with respect to the market price of child care of between -0.3 and -0.5, which is a relatively tight range. By contrast, the bottom panel presents estimates of this elasticity which range from about 0 to -0.7. As was the case with Kimmel (1998), the switch to the univariate selection does not
'8A typical identification strategy is to rely on state child care regulations. We have estimated comparable models to those reported here that include state fixed effects (rather than regional effects), which would subsume any
differences across states in the types of child care regulations that have been used to identify other models. The results from these model specifications were very similar to those reported here.
seem to effect the estimates very much. The small changes in the way the cost of child care is measured are more important, though, especially in the bottom panel. This divergence of the estimates seems to underscore the importance of carefully thinking through the specification and associated identifying assumptions. Overall, then, these results are very supportive of Kimmel's (1998) findings on the sources of variation in the past estimates. The table also presents the estimated elasticities with respect to the wage, which are generally more stable. This increased stability likely reflects both that the changes were focused on the price of care variable, and that selection-corrected wage equations are quite standard in the literature, leading to more agreement on proper specification.
Given that it is likely easier to obtain stable estimates of the wage elasticity, it is worth considering the relationship between the wage and cost of child care elasticities. Clearly, an increase in the cost of child care per hour worked can be viewed as analogous to a wage cut. However, this does not actually imply that the negative value of the wage elasticity should be comparable to the elasticity of employment to price of child care, but rather that the pure behavioral response to a dollar for dollar change in the wage and in the actual amount paid for
care will be equal. That is, that 3W t5C , wherePf is the probability of labor force
participation, w is the wage, and c is the cost of care actually paid for. Recall, though, that we have measured the policy-relevant response of a change in the market price, not this behavioral
probability of using paid care, then c =
m*P
or m =cIP. AssumingP, to be constant implies__
__
c9P5'c
Pc9m
ôn
that and thus that . Finally,since a given dollar increase
in the cost of care is not the same percentage change as that same dollar change in the wage, one must take into account the ratio of the cost to the wage. Thus, with the proper additional
information, the behavioral wage elasticity can be used to predict the policy-relevant elasticity with respect to the market price of care as follows:
m
Sm =
(7) W
makingit possible to compare the response implied by our estimated child care elasticities with the response implied by our estimated wage elasticities.
Having chosen a relatively stable model to work with, we now turn to an investigation of the effect of child care cost on labor force participation, with a focus on differences across skill groups. We also examine differences across skill level within several subgroups, defined by marital status, age of child and family poverty status, the categories previously examined in the literature. In every case, though, the prediction of the wage and market care price are estimated using the full sample of women with children under age 13.' Only the final probit is estimated
separately by subgroup, by skill.20 Tables 7, 8 and 9 present the results from these final probit model estimations. In all cases, the table presents the derivative obtained from the probit
estimates, along with the elasticity of participation, with respect to both the market price of child care per hour worked and to the hourly wage. Also shown is the price of care elasticity implied by the estimated wage elasticity, calculated as in (7) above, using the average predicted
probability of paying for child care, market price of care and wage. We refer to this measure as the alternate care elasticity.
Table 7 presents results for all women with children under 13, by education and marital status. Looking first at the top panel, we see that there is a significantly negative estimated effect of child care cost on the labor force participation of these women. As expected, there is also a significantly positive effect of the wage. Overall, we estimate an elasticity of participation with respect to the market price of care to be -0.358, similar to the central tendency of the past results. Looking across skill groups, the least skilled are slightly more responsive to the child care price, with an elasticity of -0.394, than the most skilled, with an elasticity of -0.293. The high school
graduates are in-between, at -0.3 28. A similar pattern can be seen in terms of the wage elasticity, where responsiveness declines with skill. Here the decline is much more steep, going from
0.9 12, to 0.447 to 0.427. These estimated wage elasticities imply alternate care elasticities that decline from -0.103, to -0.044 to -0.040 across the skill groups, and an elasticity of -0.055
overall.
20Preliminary estimates indicated that the stability of the model suffered with smaller sample sizes when the predictions were done separately for each subgroup. For samples with about 5000 observations or more, however, the results were similar to those presented here.
Thus, while the pattern of decline by skill group is similar for the alternate care
elasticities, the levels are very different. In this case, the elasticities are down at the bottom of the range of estimates in the past literature. There are several possible explanations for this finding. One is simply that, in fact, individuals do not respond to changes in the cost of child care as merely a change in the net wage.2' It seems unlikely, though, that this explains the entire disparity. Another possibility is that for those not currently using care, unobserved attributes (such as a lack of near-by relatives) may make access to unpaid care much less likely than would be predicted based on observed attributes. In this case, our predicted probability of using paid care will be underestimated, and hence our alternate care elasticities will be underestimated. However, even if we assume that the probability of using paid care is one, the effect implied by the wage elasticity will still be well below the directly estimated effect. For example, in the case
of all women with children under 13, this upper bound on the alternate care elasticity is -0.1 5922
An alternative explanation involves the source of identification for the model.
Differences in child care costs across region are one of the main sources of variation leading to identification of our model. It may be the case, however, that regional differences in child care prices reflect more general differences in consumer prices and, thus, in other work-related expenses. For a given wage, then, a dollar increase in the cost of child care may represent much
21We feel fairly confident that our wage elasticity estimates are reasonable. Ribar (1992) reports a wage elasticity of between 0.58 and 0.68 for the married women in his child care study. Studies of the Earned Income Tax Credit (EITC) find elasticities of between 0.35 and 0.70 for single parents (Dickert, Houser and Scholz, 1995), and of about 0.29 for married women with less than a high school education (Eissa and Hoynes, 1998). Also, there is evidence that participation is the main margin of adjustment for labor supply, implying that the labor force participation elasticity may be close to the overall labor supply elasticity (See Mroz (1987), for example).
22Given the predicted probabilities of using paid care, the upper bound estimates are generally two to three times the size of the alternative care elasticities presented here.
more than a dollar decrease in the net wage, since it correlates with many other increased work-related expenses. If this is the case, then our calculated elasticities will clearly overstate the effect of a change only in the price of care.23 Most of the studies reviewed in Table 5 using this methodology also rely on geographic variation in one form or another. It is perhaps not
surprising, then, that the smallest effects are found in studies estimating structural models. Note that it is typical in such models to begin with the assumption that women respond to the net return to hours worked. Overall, then, the two elasticities are probably best viewed as providing a range of estimates. This range is toward the lower end of that provided by the past literature. In any case, it seems clear that the responsiveness of labor force participation to price incentives is decreasing in skill-level for women with children under age 13.
Within marital status groups, only for the unmarried women does the directly estimated price of care elasticity decline with skill level, falling from -0.688 to -0.408 to -0.232. For the married women, the smallest elasticity, -0.168, is estimated for the least skilled, with the other two groups having elasticities of about -0.3. However, the alternate care elasticities derived from wage elasticities imply that responsiveness declines with skill for both married and unmarried women. In both cases, this decline is relatively sharp, although the move from -0.104 to -0.047 to -0.039 for married women is slightly smoother then that from -0.097 to -0.034 to -0.033 for the unmarried women.
23Primae facie evidence for this proposition is found by re-estimating our model including regional controls in the probit model for all women with children under 13. The weak identification leads to a fairly imprecise coefficient on the price of child care of -0.063, with a standard error of 0.046. This much lower point estimate implies a care elasticity of -0.104. The wage coefficient is essentially unaffected, implying an alternate care elasticity of -0.058.
Comparing across marital status groups, we see that unmarried women, with an elasticity of -0.473, appear more sensitive to the price of care than do married women, who have an
estimated elasticity of -0.303. This pattern is also maintained for the lower skill groups, although for the most skilled the married women are slightly more responsive. Overall, there is very little difference by marital status in the alternate care elasticity implied by the wage elasticity, at -0.052 and -0.055 for the married and unmarried women, respectively. When looking by skill level, though, while the estimates remain close, if anything it is the married women for whom the elasticities are slightly larger. The opposite is generally true for the directly calculated elasticities, where only for the most skilled women is it the case that the care elasticity is not larger for the married women.
Table 8 repeats the estimates of Table 7, but limits the sample only to women with at least one child under the age of 6. Overall, the results are quite similar, although the smaller sample leads to somewhat larger standard errors. The directly estimated elasticity with respect to the market price of care is -0.511 for all women with children under 6, slightly higher than
before. Similarly, the alternate care elasticity of -0.089 is also slightly larger than was found for all women with children under 13. Both overall and by marital status, the care elasticity is generally declining with skill, whether calculated directly or from the wage elasticity. Similar to the results in Table 7, the pattern by marital status is less clear. In general, the main findings of Table 7 are robust to this change in sample.
Since the sample change does not seem very important, Table 9 returns to the full sample of all women with children under 13, but focuses on differences by both skill and family income level. We separate the sample into two groups, the non-poor, defined as women in families with
incomes at least 185 percent above the poverty line, and the poor and near-poor, defined as women in families with incomes less than 185 percent above the poverty line.24 Starting with the non-poor, the directly estimated care elasticity is -0.186 overall, somewhat smaller than was
found for all women in Table 7. The alternate care elasticity of -0.034 is similarly smaller. While this alternate care elasticity is largest for the least skilled group, the directly calculated care elasticity reveals the opposite pattern. However, given the small number of non-poor women with less than a high school education, the care elasticity for this group is very
imprecisely estimated, making it difficult to draw clear conclusions.
Turning to the bottom panel, the estimated care elasticity for the poor and near-poor is larger than it was for the non-poor, at -0.375. The same is not true for the alternate care elasticity, which at -0.032 is similar to that for the non-poor. There is very little difference in either elasticity across the two higher skill groups, although both the care and wage elasticities are fairly imprecisely estimated for these groups. For the least skilled group, the care elasticities, -0.649 when directly calculated, or -0.051 when calculated from the wage elasticity, are much larger than for the higher skill groups. Thus, the general finding of the least skilled being most responsive to the market price of child care appears to hold even within this lower income group.
In order to put all of the previous results into context, Table 10 presents a simulation for selected groups of women of a fifty cent drop in the per hour market price of child care. Note that this is equivalent to an annual subsidy of about $1,000 for a full-time, full-year worker using
24Separating out the poor from the near-poor leads to relatively small sample sizes by skill group, and to very imprecise estimates. Even within these broader groups sample sizes of less educated, nonpoor and more educated, poor and near poor are quite small and regression coefficients for these groups are estimated with a great deal of imprecision. This likely explains the opposite sign on the point estimate of the care elasticity than one would expect for nonpoor women with less than a high school degree.
paid child care. Obviously, larger subsidies would have larger effects, but recall that the average low-skill woman using paid care only spends about $2,962 annually on child care.25 Thus, this
does imply a subsidy of at least one-third of the cost of child care for the least-skilled women.26
The table also presents the results of simulating an equivalent change in the wage. This change is calculated by multiplying the fifty cent drop in the market price by the predicted probability of using paid care. Reflecting the smaller alternate care elasticities calculated from the wage
elasticities, the simulated increase in participation from a 50centdrop in the price of care is larger than that from an equivalent increase in the wage. Looking first at all women with
children under 13, our estimated model implies that a fifty cent drop in the price of care increases the participation rate from 0.608 to 0.687, a jump of almost 8 full percentage points. By contrast,
the equivalent increase in the wage results in just a 1 percentage point increase, to 0.61 8.27
Looking across skill levels, the absolute increases in participation are fairly similar across the groups. Thus, the sharp decline in the elasticities with skill are mainly the result of the lower initial participation rates for the lower skill mothers. For the simulations based on the change in the price of care, this absolute increase is often relatively large for the least skilled group. Take, for example, the case of unmarried women with children less than 6 with less than a high school education, a likely welfare population. Table 10 indicates that this subsidy could possibly increase their participation by over a third, from 0.249 to 0.334. This increase is as large or
25This is obtained from Table 1 as the per week cost for those paying, $56.96, multiplied by 52.
26Simulatinga subsidy that is much larger than this would imply using our model to estimate far out of sample, and
would likely be unwise.
27Assuming that the probability of using paid care is one (i.e. simulating a 50 cent increase in the wage), implies a change in participation between the two presented, but typically still well below that for a 50 cent decrease in the market price of care. For example, for all women with children under 13, a 3 percentage point increase is implied.
larger than is typically found in "successful" welfare-to-work programs (U.S. DOL, 1995) and would suggest that child care subsidies may be a good way to increase rates of labor market entry among welfare recipients.
What do these results tell us about the wisdom of expanding child care subsidies as a means of assisting less-skilled women enter the labor market in the wake of welfare reform? If higher subsidies have the potential to increase labor force participation as much as the best previously attempted welfare-to-work programs, then perhaps more money should flow in that direction. Several important caveats are required before such a strong conclusion could be drawn based on our results.28 First, and perhaps most important, our simulations suggest that even after the subsidy about two-thirds of these women remain out of the labor force even after subsidizing
care, which would be insufficient to meet the work participation requirements and time limit provisions imposed by welfare reform. Child care constraints are apparently just a small part of the difficulties faced by these women in the labor market. In addition, one may prefer to base estimates of the predicted response to a child care subsidy on the broader measure of changes in the returns to work, the wage elasticity. This approach provides considerably less optimistic predictions, indicating that the labor force participation rate of these women would only increase by one percentage point to 0.260 from 0.249. Moreover, past attempts to increase labor force participation of welfare recipients through more traditional welfare-to-work strategies have never been combined with the size of the stick that welfare reform threatens. Gauging the impact of
280ne issue that often arises in the analysis of government subsidy programs is the extent to which funding goes to those who would have undertaken the intended behavior anyway. Although this concern emerges here as well, it is perhaps not quite as important as it is in other contexts. For instance, while it is true that a mother who would have worked anyway may receive a child care subsidy, she may use these additional funds to purchase higher quality child care that is more expensive. Therefore, estimating the magnitude of the inefficiency is more complicated in the specific case of a child care subsidy.
such policies based on earlier demonstrations may not be so wise. At best, one might reasonably conclude that child care subsidies can help as part of a bundle of services to get welfare
recipients into the labor market.
VI. SUMMARY AND CONCLUSIONS
As the employment levels of women with children has rapidly risen over the past several decades, the importance of child care as a labor market issue has emerged as well. In this study we have focused on this intersection of child care and mothers in the labor market, with an eye toward examining differences across skill groups. Most government expenditure programs aimed at providing child care assistance, most notably the Child Care and Development Fund block grant program, are geared at low income families, many of whom will be made up of low-skill workers. The main government tax program, the Child Care Tax Credit, is used most
extensively by families from the middle to upper range of the income distribution, though, where the least skilled workers are less likely to be found.
The least skilled workers who use child care are less likely to pay for this care, and to pay less for it when they do pay. Nonetheless, as a percentage of income, this group pays more for child care, even when the youngest child is of school age. However, children of the least skilled mothers are about twice as likely as children of the most skilled to be cared for by a relative. Again, this is true across age groups, even for school age children, who are less likely to be mainly at school during the mother's work hours. The youngest children are mainly less likely to be in family-based or organized day care, while pre-schoolers are mainly less likely to be in
nursery school or organized day care. It is the case, though, that when using relative care, the least-skilled are more likely to pay for it.
An important component of this study was to investigate the effect of child care costs on the employment of mothers. The past literature on this subject has been mixed, a result we attribute mainly to differences in the choices made in identifying the price of care effect in the final participation probit. These past estimates of the elasticity of participation with respect to the price of child care range from about 0 to almost -1, and provide no information on differences across skill level. Similarly, while most demonstration projects with a child care component are aimed at low-skill mothers, the results are difficult to interpret with respect to child care costs, although they appear to imply small effects. Our econometric results narrow the likely range of elasticities for all women with children under 13 to between -0.055 to -0.35 8. Additionally, we consistently find that this elasticity is larger for less skilled workers and declines with skill.
One must keep in mind, however, that there are inherent weaknesses to all of the
econometric methods. A well-designed and well-executed child care demonstration project, or a broader project that was carefully designed to allow the effect of the child care component to be separately identified would likely add significantly to our knowledge of this issue. Until then, our results indicate that the effect of child care costs on the labor supply of women as a whole is modest. For some groups, though, most notably less skilled unmarried women with young children, who are likely welfare recipients, child care subsidies could possibly lead to large relative gains. Nevertheless, their labor force participation would still remain far below that of other groups, indicating significant additional obstacles to employment remain, and far below the levels prescribed by the recently enacted welfare reform legislation. While we believe that
reducing the cost of child care for these women will help meet the goals of welfare reform, it will be insufficient on its own and other types of policies will be required as well to meet those goals.