ALMA MATER STUDIORUM
UNIVERSITY OF BOLOGNA
Phylosophy Doctoral Program in Electronics, Computer
Science and Telecommunications
Department of Electrical, Electronic, and Information Engineering
“Guglielmo Marconi”
Cicle XXV
Settore concorsuale: 09/F2 - TELECOMUNICAZIONI
Settore scientifico disciplinare: ING-INF/03 - TELECOMUNICAZIONI
SPECTRUM SENSING
ALGORITHMS FOR COGNITIVE
RADIO APPLICATIONS
Ph. D. Candidate:
ANDREA MARIANI
Advisors:
Prof. Dr.
MARCO CHIANI
Dr.
ANDREA GIORGETTI
Ph. D. Program Coordinator:
Prof. Dr.
ALESSANDRO
VANELLI-CORALLI
FINAL EXAM 2013
It works! It works!
I finally invented something that works!
v
ADC analog to digital converter
AWGN additive white Gaussian noise
CDF cumulative distribution function
c.d.f. cumulative distribution function
CR cognitive radio
DAA detect and avoid
DFT discrete Fourier transform
DVB-T digital video broadcasting – terrestrial
ECC European Community Commission
FCC Federal Communications Commission
FFT fast Fourier transform
GPS Global Positioning System
i.i.d. independent, identically distributed
IFFT inverse fast Fourier transform
MB multiband
MC multicarrier
MF matched filter
MI mutual information
MIMO multiple-input multiple-output
MRC maximal ratio combiner
MMSE minimum mean-square error
OFDM orthogonal frequency-division multiplexing
p.d.f. probability distribution function
PAM pulse amplitude modulation
PSD power spectral density
PSK phase shift keying
QAM quadrature amplitude modulation
QPSK quadrature phase shift keying
r.v. random variable
R.V. random vector
vi
SS spread spectrum
TH time-hopping
ToA time-of-arrival
UWB ultrawide band
UWB Ultrawide band
WLAN wireless local area network
WMAN wireless metropolitan area network
WPAN wireless personal area network
WSN wireless sensor network
ML maximum likelihood
GLR generalized likelihood ratio
GLRT generalized likelihood ratio test
LLRT log-likelihood ratio test
LRT likelihood ratio test
PEM probability of emulation, or false alarm
PM D probability of missed detection
PD probability of detection
PF A probability of false alarm
ROC receiver operating characteristic
AGM arithmetic-geometric mean ratio test
AIC Akaike information criterion
BIC Bayesian information criterion
BWB bounded worse beaviour
CA-CFAR cell-averaging constant false alarm rate
CAIC consistent AIC
CAICF consistent AIC with Fisher information
CFAR constant false alarm rate
CDR constant detection rate
CP cyclic prefix
CPC cognitive pilot channel
vii
CSCG circularly-symmetric complex Gaussian
d.o.f. degrees of freedom
DC distance based combining
DSM dynamic spectrum management
DSA dynamic spectrum access
DTV digital television
ECC European Communications Committee
ED energy detector
EDC efficient detection criterion
EGC equal gain combining
EME energy to minimum eigenvalue ratio
ENP estimated noise power
ERC European Research Council
ES-WCL energy based selection WCL
EU European Union
ExAIC exact AIC
ExBIC exact BIC
FIM Fisher information matrix
GLRT generalized likelihood ratio test
HC hard combining
HF hard fusion
ITC information theoretic criteria
K-L Kullback-Leibler
LR likelihood ratio
LS least square
MDL minimum description length
MET ratio of maximum eigenvalue to the trace
ML maximum likelihood
MTM multi taper method
MME maximum to minimum eigenvalues ratio
p.d.f. probability distribution function
OFCOM Office of Communications
OSA opportunistic spectrum access
OSF oversampling factor
PMSE programme making and special events
PU primary user
PWCL power based WCL
r.o.f. roll-off factor
RAN Regional Area Network
RMSE root mean square error
RWCL relative WCL
RSS received signal strength
SC soft combining
SCM sample covariance matrix
SCovM sample covariance matrix
SCorM sample correlation matrix
SDR software defined radio
SF soft fusion
SP sensing period
SS spectrum sensing
SSE signal subspace eigenvalues
SU secondary user
TOA time of arrival
TDOA time difference of arrival
TVBD TV Bands Device
TS-WCL two step WCL
WCL weighted centroid localization
WSD white space device
WSN wireless sensor network
Abstract
Future wireless communications systems are expected to be extremely dy-namic, smart and capable to interact with the surrounding radio environ-ment. To implement such advanced devices, cognitive radio (CR) is a promis-ing paradigm, focuspromis-ing on strategies for acquirpromis-ing information and learnpromis-ing. The first task of a cognitive systems is spectrum sensing, that consists the analysis of the radio frequency spectrum. In particular, CR has been mainly studied in the context of opportunistic spectrum access, in which secondary devices are allowed to transmit avoiding harmful interference to higher pri-ority systems, called primary users. Thus cognitive nodes must implement signal detection techniques to identify unused bands for transmission.
In the present work, we study different spectrum sensing algorithms, fo-cusing on their statistical description and evaluation of the detection perfor-mance. Moving from traditional sensing approaches we consider the pres-ence of practical impairments, such as parameter uncertainties, and analyze algorithm design. Far from the ambition of cover the broad spectrum of spectrum sensing, we aim at providing contributions to the main classes of sensing techniques, from basic energy detection, to cooperative eigenvalue based algorithms, to wideband approaches, touching also simple localization strategies for CR networks. In particular, in the context of energy detection we studied the practical design of the test, considering the case in which the unknown noise power is estimated at the receiver. This analysis allows to deepen the phenomenon of the SNR wall, providing the conditions for its existence. This work highlight that the presence of the SNR wall is deter-mined by the accuracy of the noise power estimation process. In the context of the eigenvalue based detectors, that can be adopted by multiple sensors systems, we studied the practical situation in presence of unbalances in the noise power level at the receivers. In this context we studied the design of the decision threshold providing a statistical description of the tests based on a moment matching approach. Then, we shift the focus from single band detectors to wideband sensing, proposing a new approach based on infor-mation theoretic criteria to distinguish occupied from unoccupied frequency
bands. This technique is blind and, requiring no threshold setting, can be adopted even if the statistical distribution of the observed data in not known exactly. In the last part of the thesis we move from signal detection and analyze some simple cooperative localization techniques based on weighted centroid strategies.
Acknowledgement
This achievement would not have been possible without the help and support of many people, and this is an attempt to say thank you to them all.
First, I would like to thank my advisor, Prof. Marco Chiani. It has been an invaluable opportunity to have him as a mentor, for his guidance, his willingness, for pushing me to aim high, and teaching me the love for doing things well and passion for research. A special thank to my co-advisor Andrea Giorgetti, for his guidance, his support and for being an example in doing research and working hard. I would like to thank all the telecommuni-cations group guys at the University of Bologna, Cesena campus, for making this a wonderful working place, starting from my Ph.D. fellows, Nico, for our friendship across the oceans, Simone, Vincenzo, Anna and Stefano, and also Matteo, Enrico and Prof. Davide Dardari. A special thank to Guido for all we shared in these intense ten years. I would like to thank Prof. Sitham-paranathan Kandeepan, who allowed me to visit him at the Royal Melbourne Institute of Technology and for the fruitful research collaboration that we are carrying on. Thanks to whom made me feel welcome in Melbourne, to Ester and the guys from the St. Francis Youth Choir.
Un grazie a tutte quelle persone che mi hanno sostenuto e accompagnato in questi anni. Alla mia famiglia, ai miei genitori per tutti i doni e la pazienza, all’ Eli che non la ritroviamo pi`u il sabato mattina, a Lori che continua a lottare, a Tommy, Filo, gli zii e le nonne che mi seguono dall’alto. Al mio gruppo scout e in particolare al buon Giovanni Look-crazy e i ragazzi del clan Le Rapide di Montiano per la strada fatta insieme, al coro Musica Enchiriadis per la passione, il divertimento e per l’avermi fatto riscoprire la musica in una veste nuova. Un grazie particolare a Francesca per l’amicizia e lo stupirci insieme delle strade che continuiamo a percorrere, e a Mirko per l’esempio, per l’amore per le cose belle e per il consigliarmi le vere amicizie. Grazie a Benedetta per questi anni avventurosi ed entusiasmanti, e senza la quale il mio domani non apparirebbe cos`ı avvincente.
Contents
1 Introduction 1
1.1 Towards a more efficient use of the spectrum . . . 1
1.2 Opportunistic spectrum access (OSA) . . . 2
1.2.1 Current OSA Regulations and Standardizations . . . . 5
1.2.2 Implementing the “observe” step . . . 6
1.2.3 Sensing in the TV white spaces . . . 8
1.3 Overview of spectrum sensing algorithms . . . 10
1.3.1 Fundamental algorithms . . . 11
1.3.2 Diversity based detectors . . . 13
1.3.3 Wideband algorithms . . . 14
1.3.4 Cooperative algorithms . . . 15
1.3.5 Spectrum sensing beyond signal detection . . . 17
1.4 Thesis outline . . . 18
1.5 Contribution . . . 20
1.6 Notation . . . 20
2 Effects of Noise Power Estimation on Energy Detection 23 2.1 Introduction . . . 23 2.2 System Model . . . 25 2.2.1 Two-step sensing . . . 26 2.2.2 Noise uncertainty . . . 27 2.2.3 Design curves . . . 29 2.3 SNR Wall Analysis . . . 30
2.4 Performance of ED with ENP . . . 32
2.4.1 Detection of a Gaussian signal . . . 32
2.4.2 Detection of an unknown deterministic signal . . . 34
2.5 ENP-ED Design Curves . . . 35
2.5.1 Design through ENP analysis . . . 35
2.5.2 Design for ED with a worst-case approach . . . 35
2.6 Numerical Results . . . 36
2.6.2 Design curves . . . 39
2.6.3 Two-step sensing schemes . . . 40
2.6.4 SNR wall examples . . . 41
2.7 Conclusion . . . 43
2.8 Appendix . . . 44
2.8.1 Gaussian signal . . . 44
2.8.2 Unknown deterministic signal . . . 46
3 Test of Independence for Cooperative Spectrum Sensing with Uncorrelated Receivers 49 3.1 Introduction . . . 49
3.2 System model . . . 50
3.2.1 Generalized likelihood ratio test derivation . . . 51
3.3 Approximated generalized likelihood ratio distributions . . . . 52
3.3.1 Moment matching based Beta approximation . . . 52
3.3.2 Chi-squared approximation . . . 53
3.4 Independence test . . . 53
3.5 Sphericity test . . . 55
3.6 Numerical results . . . 56
3.6.1 Detection in presence of uncalibrated receivers . . . 56
3.6.2 Approximated distributions . . . 57
3.7 Conclusions . . . 58
3.8 Appendix . . . 59
4 Wideband Spectrum Sensing by Information Theoretic Cri-teria 63 4.1 Introduction . . . 63
4.2 Wideband sensing by model order selection . . . 65
4.3 Information theoretic criteria (ITC) . . . 67
4.4 DFT based wideband algorithms . . . 69
4.4.1 Independent frequency bins . . . 71
4.4.2 Correlated frequency bins . . . 71
4.5 Numerical results and discussion . . . 72
4.5.1 Independent frequency bins . . . 73
4.5.2 Multiband sensing . . . 78
4.5.3 Correlated bins algorithms . . . 82
4.6 Conclusions . . . 84
5 Cooperative Weighted Centroid Localization 87 5.1 System model . . . 88
5.2.1 Weighting strategies . . . 90
5.2.2 WCL with node selection . . . 91
5.3 Localization Performance Analysis . . . 91
5.4 Conclusions . . . 95
6 Conclusions 99
Chapter 1
Introduction
1.1
Towards a more efficient use of the
spec-trum
In the last ten years opportunistic unlicensed spectrum radio assess strategies have gained an increasing interest both in the academia and industries. This fact has been driven by two aspects: the so called spectrum scarcity prob-lem and the attempt to reach a more efficient utilization of the spectrum resources.
Today we are experiencing an exponential proliferation of wireless devices and an increasing demand for wireless data capacity, and the traffic demand forecasts confirm this trend in the next few years [1, 2]. For example, in Fig. 1.1 we report the CISCO forecasts for the total and the mobile traffic demand till 2016 [3]. We can see that by 2016 the total traffic is expected to be three times larger than 2011, and this growth in proportion is more evident considering only the mobile traffic that is expected to be 14 times larger (which means an annual increment of 70%) growing from 520 PB per month to almost 7,5 EB per month. Similar predictions can be found in [4,5]. These growth forecasts makes us wonder about the availability of sufficient spectrum to sustain such an enormous demand of wireless traffic. Indeed on the basis of the observation of the frequency allocation charts we can see that most of the useful radio spectrum has been already allocated [6, 7], thus the problem of spectrum scarcity is a realistic problem in modern wireless communications. The simplest and more traditional way to face this “capacity crunch” problem is the re-organization of the frequency allocation, providing more spectrum to the key services that lead the traffic demand growth. This is the case, for example, of the mobile broadband services for which the allocation of new spectrum is planned within the next five years in the USA [4]. Also in
0 20000 40000 60000 80000 100000 120000 2011 2012 2013 2014 2015 2016
video filesharing businessdata webandotherdata onlinegaming videocommunications voicecommunications (a) Total 0 1000 2000 3000 4000 5000 6000 7000 8000 2011 2012 2013 2014 2015 2016 video filesharing
webanddata onlinegaming videocommunications voicecommunications
(b) Mobile
Figure 1.1: Traffic forecast in PB/month, CISCO VNI Feb. 2013 [3]. European Union (EU) since 2010 part of the digital divided in the 800 MHz band has been devoted to mobile systems in an harmonized manner [8], and UK will extend mobile broadband also to the 700 MHz band, reallocating the digital television (DTV) services [9].
However, in spite of the nominal absence of available spectrum, measure-ments of the radio frequency occupation indicate that large portions of the licensed bands are not used for significant periods of time [10]. This suggests that reallocation of spectrum bands to data services is only a part of the answer to the capacity crunch, since it reveals that behind the current spec-trum scarcity problem the main issue is an inefficient use of the specspec-trum resources. Therefore one of the main objectives in the design of future wire-less communication systems must be a more efficient use of the frequency spectrum.
1.2
Opportunistic spectrum access
A more efficient utilization of the spectrum can be reached through the adop-tion of flexible devices, able to analyze the surrounding radio environment, discover unused spectrum resources and use them without interfering higher priority users, called primary users (PUs). These actions describe the essen-tial characteristics of the so called opportunistic spectrum access (OSA),
where users with a lower priority, named secondary users (SUs), “adopt dynamic spectrum access (DSA) techniques to exploit spectral opportuni-ties”1 [12]. The expression “spectral opportunities” can be generally used to indicate situations in which the SUs have some occasion to transmit. In this work, as in most of the cognitive radio (CR) literature, a spectral opportu-nity will indicate in particular the presence of a portion of spectrum that is temporarily or locally unused. These unoccupied bands are often referred as spectrum holes orwhite spaces2. This acceptation is related to the so called “interweave” approach to secondary access3.
The OSA techniques have been studied in particular in the context of CR. The concept of CR has been defined for the first time by Mitola as a
Plan Orient Normal U t Plan Urgent Immediate New Learn Observe states Prior states Decide Saves global states states Act Outside world
Figure 1.2: The cognitive cycle [13].
radio system whose behavior is described by the cognitive cycle depicted in 1The SUs are unlicensed or light-licensed users; in the former case the expression “op-portunistic unlicensed access” is often used [11].
2The expression “white space” is mainly used with reference to DTV bands.
3Other possible strategies are the “underlay” approach, adopted by low spectral den-sity transmissions such as ultrawide band (UWB) communications, and the “overlay” technique in which the SUs compensate the interference caused to the PUs supporting their transmissions adopting for example relaying strategies.
Fig. 1.2 [13]. Recently ITU provided a definition of the CR system as “a radio system employing technology that allows the system to obtain knowledge of its operational and geographical environment, established policies and its in-ternal state; to dynamically and autonomously adjust its operational param-eters and protocols according to its obtained knowledge in order to achieve predefined objectives; and to learn from the results obtained” [14]. Then we can identify three main key characteristics of CR systems [15]:
• capability to obtain knowledge;
• capability to dynamically and autonomously adjust its operational pa-rameters and protocols;
• capability to learn.
Note that the feature that distinguish CR from DSA systems is essentially the learn step that provide great benefits for OSA systems, such as the ability to recognize PUs activity pattern and predict their behavior, to perceive channel state features and act on the basis of previous experience, to foresee interference levels, etc.. Therefore current OSA research is oriented to the study and implementation of cognitive systems. Mitola’s cognitive cycle has been reformulated in terms of dynamic spectrum management (DSM) in [16] (see Fig. 1.3).
In order to implement CR devices for OSA the main technological re-quirements are given by flexible, fast and easily reprogrammable hardware, and proper signal processing algorithms that implement the cognitive func-tions, such as spectrum sensing and spectrum shaping algorithms, spectrum management strategies, decision and learning techniques, etc..
With regard to the hardware aspects, today we can benefit of so called software defined radios (SDRs) that is a radio equipment designed “trying to push the analog to digital converter (ADC) as close as possible to the an-tenna”, in order to define most of the radio chain components via software. This approach is today possible thanks to modern developments in ADCs and fast electronic circuits. It offers a very high flexibility, allowing most of the parameters to be changed dynamically avoiding excessive time con-sumption and additional costs [17]. In contrast to traditional radio systems, generally designed to support a particular communication standard, SDRs can potentially allow to change dynamically the standard simply modifying the software that implements its transmit and receive chains.
With regard to the algorithms that implement CR/OSA functions we can say that today all the cognitive functions have been proposed by the research community and are subject to further investigations with an increasing in-terest [18–20].
Radio Environment Environment (Outside world) RF Action: transmissied
signal Spectrum holes N i fl i i RF stimuli RadioͲ scene analysis NoiseͲfloor statistics
Traffic statistics TransmitͲ power control, andspectrum analysis Interference t t p management Channel state estimation, temperature and predictive modeling Quantized channel capacity Transmitter Receiver
Figure 1.3: DSM reformulation of the cognitive cycle [16].
Also from a practical implementation point of view many CR testbeds have been developed [21, 22].
1.2.1
Current OSA Regulations and Standardizations
In addition to the technological implementation issues, the implementation of CR/OSA systems must be enabled by in second place communications regulatory bodies first and by standardization activities.
Some regulations related to CR systems have been formulated in the last few years, focusing mainly on opportunistic access to white spaces in the television VHF and UHF bands. This interest is related in particular to the great propagation characteristic of these bands, and the relatively predictable spatiotemporal usage of the main services that use them. Unli-censed access to the TV white space has been allowed in the USA first [23], followed by countries such as Canada [24] and, with some limitiations, Japan and Australia [25, 26]. Regulation studies are ongoing in Europe and other countries [6].
The standardization activities related to CR/OSA systems are currently under development on all levels of a CR systems. In Table 1.1 we report a summary of the main standardization activities in the last few years. In par-ticular standards related to the TV white spaces attracted lots of attention. In this context the first standard developed is ECMA 392 [27, 28]. Among the IEEE activities the most popular are the IEEE 802.22 standard for TV white spaces wireless Regional Area Networks (RANs) operations [29] and the IEEE 802.11af (also called “White-Fi”) that currently has not been re-leased yet. Other standardization activities are under development by ITU and ETSI [15, 30, 31].
1.2.2
Implementing the “observe” step
In OSA systems, the SUs must implement strategies to acquire information from the radio environment in order to identify ongoing licensed transmis-sions and preserve them [32]. This corresponds to the “observe” CR step in OSA. The main task of this stage consists in identifying which channels are available for opportunistic transmissions, that is equivalent to a PU detection problem. Secondly, it can be useful to acquire some additional information, such as some characteristic of the identified signals, interference measure-ments, etc.. In literature mainly three solutions have been proposed [11]:
• Geolocation databases;
• Beacon signals.
• Spectrum sensing;
The geolocation database solution is based on the consultation by the SU network of a database that stores the information on the spectral oc-cupancy in the nodes locations. The advantages of this approach are that it is virtually error free and is not affected by radio channel characteristics. However it is a quite expensive solution. Indeed the secondary nodes require to incorporate some location technique (such as GPS) Internet connection in order to access the database information. Moreover, additional costs that must be considered are the costs related to the design and implementation of the database, and the costs for gather the PU occupancy information.
The beacon based approach consists in the adoption of a beacon signal that is broadcasted to the secondary nodes providing the PU occupancy information. This solution has a very high infrastructural cost, requiring also some modifications of the current licensed systems. However, some CR networks implementations foresee the adoption of a cognitive pilot channel
IEEE 802.11af Wireless LAN: TV white spaces operation on going IEEE 802.11y Wireless LAN: 3650-3700 MHz operation in
USA
Nov. 2008 IEEE 802.19.1 TV white space coexistence methods on going IEEE 802.22 Wireless RAN: Policies and procedure for
op-eration in the TV bands
Jul. 2011 IEEE 802.22.1 Enhancing harmful interference protection Nov. 2010 IEEE 1900.1 Definitions and concepts for dynamic
spec-trum access
Sep. 2008 IEEE 1900.1a Amendment: addition of new terms and
def-initions
Feb. 2011 IEEE 1900.2 Practice for the analysis of in-Band and
ad-jacent band interference
Jul. 2008 IEEE 1900.4 Architecture for optimized radio resource
us-age in heterogeneous wireless access networks
Feb. 2009 IEEE 1900.4.1 Interfaces and protocols for dynamic
spec-trum access networks in white space fre-quency bands
on going
IEEE 1900.4a Architecture and interfaces for dynamic spec-trum access networks in white space fre-quency bands
on going
IEEE 1900.5 Policy language requirements and architec-tures
on going IEEE 1900.6 Spectrum sensing interfaces and data
struc-tures
Apr. 2011 IEEE 1900.6a Amendment: procedures, protocols, and
data archive enhanced interfaces
on going IEEE 1900.7 Radio interface supporting fixed and mobile
operation
on going
ECMA 392 MAC and PHY for operation in TV white
space
Dec. 2009 Table 1.1: Current CR standardization.
(CPC) to support cognitive operations such as spectrum allocation [33]. This dedicated channel could be adopted also to convey sensing information among the SU nodes.
Spectrum sensing in defined by IEEE as the “The action of a radio mea-suring signal features” [12]. It consists therefore in the implementation of an autonomous process of the SUs, that on the basis of the received signals analyze the spectrum. It offers the advantage of no infrastructural costs nor modifications in the licensed systems. Moreover, it makes the SU net-work completely autonomous and capable of a reactive behaviour. The SU nodes implementation costs depend on the algorithms adopted. The main disadvantages of spectrum sensing (SS) is the fact that its behaviour is gen-erally related to some tradeoffs between performance (e.g. detection rate) and observation time, and the fact that it can suffer adverse radio channel characteristic, leading to the hidden node problem [19, 34]. The choice of the proper technique to be adopted depends on the particular OSA problem we are studying. In particular the characteristics of the PUs (such as their dynamics, bandwidth and power) are the most important features to be con-sidered for choosing the proper strategy. Indeed the adoption of geolocation database fits particularly with highly predictable PUs such as TV signals, that are continuous transmissions broadcasted from known locations. In this case, to evaluate the presence of a TV signal could be sufficient for example to enquire a database on a daily basis. Spectrum sensing instead is the most promising solution for unpredictable signals that transmit from unknown lo-cations such as programme making and special events (PMSE) signals (like wireless microphones).
1.2.3
Sensing in the TV white spaces
In the context the TV white spaces, FCC recently decided to choose in favor of the geolocation database approach leaving the implementation of detection algorithms as an optional feature [35]. This decision comes from some studies on the minimum sensitivity required at the secondary nodes in order to ensure DTV and PMSE signal protection in the worst propagation conditions. This analysis demonstrated that common sensing approaches do not guarantee the detection performance required, leaving the implementation of sensing algorithms as an optional feature [35]. However this decision seems to be moved more by the willing to come up with a regulation on white space devices (WSDs) in a short time, enabling companies to access the white space market rather than a definitive mistrust in SS strategies. Indeed the Federal Communications Commission (FCC) states that [35]
Specifically, we are taking the following actions: . . .
• TV Bands Devices (TVBDs)
◦ Eliminating the requirement that TV bands devices that incorporate geo-location and database access must also lis-ten (sense) to detect the signals of TV stations and low power auxiliary service stations (wireless microphones).
. . .
While we are eliminating the sensing requirement for TVBDs, we are encouraging continued development of this capability because we believe it holds promise to further improvements in spectrum efficiency in the TV spectrum in the future and will be a vital tool for providing opportunistic access to other spectrum bands.
Then, while eliminating SS as a mandatory function, FCC strongly encour-ages research activities to make possible a sensing based WSDs second gen-eration.
Also the Office of Communications (OFCOM) in the UK expressed a similar viewpoint [36]:
As a result we propose to allow detection alone as well as geolo-cation. However, we note that implementation of detection-only devices is likely many years away and hence there is little ad-vantage in rapidly making the necessary regulations to licence-exempt such devices.
. . .
We conclude from the responses that the most important mech-anism in the short to medium term will be geolocation.
In Europe, the European Communications Committee (ECC) came to the same conclusion in [37], on the basis of single user sensing algorithms. Studies on cooperative spectrum sensing are currently under investigation (see e.g. [38]). The ECC also suggests the potential benefit in using a combination of sensing and geolocation database to provide adequate protection to digital TV receivers [37].
In conclusion, in the next few years we expect the borne of the first gen-eration of WSDs, that probably will be based on geolocation implementation
being the adoption of SS algorithms not mandatory. In spite of this fact, the research community is motivated anyway to continue the investigation in new sensing algorithms with the first aim to propose new algorithms with higher detection performances. The most promising approaches consist in advanced techniques based on cooperation among SUs or multiple antennas WSDs, that currently has not been deeply analyzed by regulatory bodies and that deserve more attention in the definition of future rules. Moreover a secondary system that is based on geolocation databases can adopt OSA strategies, but cannot be considered properly a cognitive system, due to the lack in autonomy and reactivity to the environment that characterize the original Mitola’s proposal and that only SS can provide. Another important point is that beyond PU protection the sensing task has an important role in supporting higher level cognitive functionalities such as resource allocation and spectrum efficiency [39, 40].
1.3
Overview of spectrum sensing algorithms
In this section we present an overview the main algorithms proposed for SS. In general it is not simple to provide a unique classification of the sensing techniques, especially because there are lots of possible approaches and many algorithms can be included in more than one class. We choose in particular to adopt a classification based on the algorithms practical requirements, defining the following four groups:
• Fundamental algorithms
We include in this group the basic algorithms, typically proposed for the observation of a single band, by a single antenna receiver.
• Diversity based algorithms
These algorithms require some kind of diversity to be implemented, such as multiple antennas or oversampling. We include in this class in particular the eigenvalue based algorithms.
• Wideband algorithms
We include in this group algorithms that are suited for the analysis of multiple bands observations.
• Cooperative algorithms
1.3.1
Fundamental algorithms
Since five years ago, many papers dealing with CR introduced the sensing topic asserting that “sensing algorithms can be classified in energy detector, matched filter and cyclostationarity detector”. Indeed these techniques are the very basic strategies that can be adopted in simple sensing problems, by simple receivers with a single antenna and the observation of a single band.
• Energy based detection
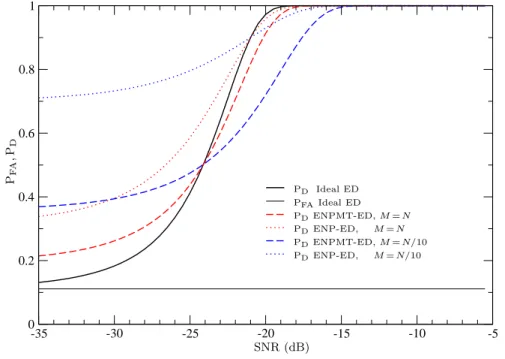
The energy detector (ED) is the most simple and popular algorithm for signal detection. Its implementation consists in an estimate of the received power (as sum of the squared received samples) followed by a comparison with a decision threshold. Theoretically the ED is derived as the generalized likelihood ratio test (GLRT) for the detection of a de-terministic unknown signal in additive white Gaussian noise (AWGN) or as a sufficient likelihood ratio (LR) statistic when the signal to be detected is described as a zero mean Gaussian process. Its statistic has been widely studied in literature (see e.g. [19, 41]) and due to its simplicity of implementation and analysis, currently it is with no doubts the standard sensing algorithm adopted for example in studies on higher level CR functionalities and also by regulatory bodies [37,42]. Frequency domain EDs have been also proposed [43,44]. The main im-pairment of the ED is the fact that its statistic depends on the noise power level, therefore its knowledge is required for setting the decision threshold according to the Neyman-Pearson (NP) approach [41,45,46]. In practical applications errors on the noise power level experienced can cause performance losses due to an inaccurate threshold setting and in some cases the rise of the so called SNR wall phenomenon, which is a minimum SNR level under which it is impossible to rich the desired probability of detection (PD) and probability of false alarm (PFA) [47–49]. Recent literature has often emphasized the problem of the SNR wall, giving little attention to the strategies to counteract it, such as how to design noise power estimators that allows to avoid the SNR wall. We will discuss this topic in detail in Chapter 2.
• Feature based detection
When some additional knowledge on the signal to be detected is avail-able, we can adopt detectors that exploit this information. In particu-lar, the most common algorithms in this class are:
– Autocorrelation based detectors
signal to be detected present some peculiar peaks. The most popu-lar autocorrelation based algorithm is the cyclic prefix (CP) based algorithm for the detection of orthogonal frequency-division mul-tiplexing (OFDM) signals [50–52].
– Waveform based detector
If some portion of the primary signal is known, we can build a de-tector that exploits this knowledge, usually correlating the known feature with the received signal sequence. This can be the case, for example, of signals with known preamble or with some known pilot pattern [53]. The extreme case is the matched filter (MF) detection, that requires the knowledge of the complete signal se-quence. Even if the MF detector is often cited in SS algorithm surveys, the assumption of perfect knowledge of the PU (and thus the adoption of the MF detector) is unrealistic in practical CR implementations [50–52].
– Cyclostationarity based detectors
When a signal presents some periodicity in the autocorrelation function, this corresponds to the presence of some correlation in the frequency domain, called cyclostationary feature [54]. As for the autocorrelation features in the time domain, this property can be adopted for detecting PU signals. Many cyclostationary detectors algorithms have been proposed in past literature, usually based on the estimation of the cyclic autocorrelation function or the cyclic spectrum [55–58].
Feature based algorithms are generally used for detecting the pres-ence of specific PU signals. Being suited for particular communication standards, while they are unable to evaluate the presence of different transmissions. The main practical impairment of these algorithms is the susceptibility to synchronization errors and frequency offsets, that imply the adoption of a synchronization stage [59]. We can consider therefore the feature based detectors as simplification of the PU signal receiver chain, that aims at detecting the presence of this transmis-sion without the need of extracting the information symbols. It is also possible to built general purpose feature detectors, capable for exam-ple of identifying any possible autocorrelation peak or cyclostationary feature, however these algorithms are very expensive from a computa-tional point of view, are time consuming and suffer of synchronization errors [56, 59].
1.3.2
Diversity based detectors
In this section we present some algorithms that can be adopted in presence of some diversity reception mechanism. We refer in particular to multiple antennas system that have been widely studied in current communications literature [60–63]. The same techniques can be also adopted when we are considering the detection of an oversampled signal. In this situation from the original sample sequence we can extract a number of sub sequences which number corresponds to the oversampling factor and use them as they were collected at different antennas [64]. The same algorithms can be also adopted in cooperative sensing system (see also Section 1.3.4 and Chapter 3). In all these case studies it is possible to compute the sample covariance matrix (SCM) of the received samples, which is a square matrix with order that equals the degree of diversity of the system. In order to identify the presence of PUs we can adopt threshold based tests which metrics are functions of the SCM. These algorithms are generally called “eigenvalue based algorithms”. Alternative approaches are based on the information theoretic criteria (ITC).
• Eigenvalue based detectors
The eigenvalue based algorithms are binary tests in which the decision metrics are functions of the eigenvalues of the SCM. They have at-tracted a lot of attention providing good performance results without requiring the knowledge of the noise power nor any prior information on the PU signals [65–69]. Considering the most general scenario, with possible multiple PUs, the GLRT is the so called sphericity test, well known in statistics literature and recently re-proposed with the name arithmetic-geometric mean ratio test (AGM) [65, 70]. Alternatively, in situations in which we expect to have a single PU, the GLRT is the ratio of maximum eigenvalue to the trace (MET) [69]. Others metrics have been also proposed, such as the maximum to minimum eigenvalues ratio (MME) [66]. Recently also the case in which multiple antennas are uncalibrated have been considered [68, 71].
• ITC based detectors
A different approach for the detection of PU signals is to estimate the dimension of the observed sample set. If it contains only the noise the eigenvalues of the SCM are all equal to the noise power σ2; otherwise it will contain some eigenvalue greater than σ2. This problem can be formulated as a model order selection problem, in which the order of the model is the number of eigenvalues of the SCM, and it can be solved by means of ITC [72]. If the estimated model order is greater than zero, it means that at least one PU has been detected [73, 74]. Mainly Akaike
information criterion (AIC) and minimum description length (MDL) has been adopted [73,74]. This approach allows to implement detectors that do not need to set a decision threshold. Note that this implies that we cannot control the tradeoff between false alarm and detection probabilities of the algorithm.
1.3.3
Wideband algorithms
Although most of the sensing algorithms has been conceived as single band detectors, wideband SS allows a better knowledge of the surrounding radio environment. Wideband SS consists in a joint observation of multiple fre-quency bands and joint decision on the occupancy of each subband. It allows therefore to acquire a more complete observation, avoiding time consuming sequential scan of the spectrum. Its applicability is therefore primarily re-lated to hardware constraints. In CR many approaches have been proposed, starting form “multiband sensing” approaches, that consists simply in di-viding the observed band in multiple subchannels. The most common solu-tions are based on spectral estimation techniques, in addition to some knew approaches such as compressive sensing. Here we include also ITC based wideband sensing, that will be described with more detail in Chapter 4.
• Detectors based on spectral estimation
The scope of spectral analysis os to provide a reliable estimate of the energy distribution in the frequency domain, thus it has a big impact of the environment awareness of the SUs. In CR context non para-metric techniques are the more suitable strategies because they do not require any assumptions on the received signal (except the stationarity assumption within the observation time) and thus do not require the estimation of any parameters. These approaches in general are con-stituted by a spectrum estimation stage followed by the adoption of some metric to evaluate the occupancy of each frequency component. The starting point of such techniques is the classical non parametric spectrum estimation theory, based on the periodogram and their deriva-tives, such as the Welch’s periodogram. The most advanced spectrum estimation approach in this context is the multitaper method [75–77]. Also advanced filter design strategies can be adopted, such as filter banks approaches [78, 79]. If the SUs know the power spectral density to be detected, the optimum detector in signal-to-noise ratio (SNR) regimes assumes the structure of an estimator-correlator [80].
• Compressive sensing
be applied to signals with a sparse representation. In the context of CR it can be adopted in particular in situations in which the PU signal occupancy is sparse in the frequency domain, exploiting techniques known as compressive sensing. The main advantage of these techniques is that they allow to analyze a large portion of spectrum without the requirement of an high sampling rate. [81]
• Wideband ITC
The wideband sensing problem can be formulated as a model order selection problem, in which the model of the order is the number of frequency bins considered. Then the joint detection of frequency com-ponents can be performed using ITC, that are commonly adopted for model order selection [82]. A general formulation of this approach is provided in detail in Chapter 4.
1.3.4
Cooperative algorithms
A very promising solution for improving the sensing performance of the SU networks is to exploit cooperation among the secondary nodes. In particular cooperative strategies, exploiting the SUs spatial diversity, can be adopted to counteract the channel effects such as multipath and shadowing, that cause the hidden node problem [19, 34]. Cooperative SS has reached an increas-ing attention in the last few years, and many different schemes have been proposed. A survey of cooperative sensing techniques can be found in [83]. There are many issues that must be addressed in the design of a coopera-tive SS strategy. We refer to [83] and the references therein for an extended overview. The main requirement is related to the availability of channels for sensing signaling among the SUs, that in most of the literature studies is a fixed control channel. In the following we provide a brief classification to highlight their main characteristics.
Cooperative algorithms can be classified on the basis of how SUs share their sensing data in the network and in which point of the network the final decision is taken. We have basically two approaches, the centralized and the distributed4. Also mixed strategies can be adopted.
• Centralized cooperative sensing
In centralized cooperative strategies the sensing information from all the SUs are reported to a central identity, called fusion center, that combines them and takes the global decision. Then this information 4Note that in some works the term “distributed” is used as a synonym of cooperative, and expression such as “non-centralized” are adopted.
must be sent back to the SUs by means for example of broadcasting [19, 83].
• Distributed cooperative sensing
Distributed schemes differs from centralized ones for the absence of a specific fusion center. In this case indeed the SUs communicate among themselves and converge to a unified decision. This process can be performed in an iterative way. In this scheme therefore the final decision is taken by each SU on the basis of a common decision policy [83].
• Mixed strategies
Besides the centralized and distributed approaches, some mixed strate-gies can be adopted. For example, a relay assisted cooperative scheme can be adopted in cases in which some SUs experience a weak report channel and the remainders can be used for forwarding their sensing results to the fusion center [83]. Another solution is the clustered sens-ing scheme, in which clusterheads act as second level fusion centers, collecting the sensing results from the SUs within their cluster. Then this data can be shared among other clusterheads or can be forwarded to the fusion center. An example of cluster based cooperative sensing can be found in [42].
With respect to the data that are shared among the SUs, cooperative strategies can be divided in hard fusion and soft fusion schemes:
• Hard fusion schemes
When the SUs share their local binary decisions on the presence of PUs, we talk about hard fusion schemes. Locally the SUs can adopt any of the single node sensing techniques described previously. These schemes are convenient for the minimum amount of data that must be exchanged among the secondary nodes. In this case the fusion strategies are typically linear fusion rules such as AND, OR and majority rules. Also Bayesian approaches can be adopted, such as the Chair-Varshney optimal fusion rule [19].
• Soft fusion schemes
In place to the local binary decisions, the SUs can share a richer infor-mation, such as their likelihood ratios, in order to improve the sensing result. These schemes require therefore a larger secondary network ca-pacity. Note that the amount of data to be shared depends of the met-ric chosen and its representation. For example, schemes very closed to hard combining, with only a two bit likelihood ratio representation, has
also been proposed [84]. Also in this case linear combining fusion are the most common strategies, such as the equal gain combining (EGC) and maximal ratio combiner (MRC) [84]. If the amount of data to be exchanged is not a problem, also algorithms that imply the transmis-sion of all the SUs observations to the futransmis-sion center has been proposed. In this case eigenvalue based algorithms can be adopted also in the cooperative case [66, 85].
1.3.5
Spectrum sensing beyond signal detection
In CR literature the term sensing generally assumes the meaning of signal detection. The identification of the presence of PUs is with no doubts the most important functionality, required for detecting the presence of spectrum holes, and enabling PU protection. However generally speaking, the sensing functionality includes any kind of technique that allows the SUs to collect information from the radio environment that is useful to orient the CR net-work actions. In particular we emphasize three aspects: signal classification, estimation of the number of primary transmissions and PU localization.
Classification of PU signals can greatly improve CR functionalities. The first advantage is the identification of PUs, that is useful in particular in pres-ence of other interferes5. In this case, when an occupied band is detected, general purpose detection algorithms, such as the ED, cannot distinguish between PUs and other transmissions, thus missing some spectrum opportu-nities. Note that considering PU identification, feature detectors (cyclosta-tionarity based, autocorrelation based, etc.) can be considered classification algorithms. In the context of classification, another important aspect is PU features extraction, which can be adopted for example to support interfer-ence mitigation techniques. In particular, automatic modulation recognition algorithms has been developed both for civilian and military applications. An extended survey to these techniques can be found in [86].
In many CR scenarios SUs can experience the presence of multiple PUs signal sources. In this case, if the SUs are equipped with multiple antennas, spatial correlation can be exploited for detection purposes (as we mentioned with the diversity based algorithms) and for estimating the number of in-dependent sources. In particular, non parametric methods that exploit the properties of the SCM can be adopted. A large sample based on ITC has been proposed in [72], while exact algorithms, based on the true distribution of the SCM have been proposed in [67].
Information about the PU position plays an important role allowing a 5These could be also malicious transmissions such as jammers in the military context.
better usage of the spectrum, avoiding and preventing harmful interference, making a better distribution of the radio resources in the spatial domain, aiding spectrum policy enforcement, etc. [19,87–89]. In chapter 5 we address some simple techniques to be adopted by cooperative SUs networks.
1.4
Thesis outline
Motivated by the fundamental role of spectrum sensing in enabling CR func-tionalities, in this dissertation we study sensing algorithms for spectrum holes detection. The analysis performed focuses both on the assessment of the de-tection performance and the statistical description of the algorithms, espe-cially for threshold based algorithms. Far from the ambition of dealing with all the broad spectrum of SS algorithms, we aim at providing contributions to the main classes of sensing techniques, from basic energy detection, to cooperative eigenvalue based algorithms, to wideband approaches, touching also aspects of simple localization strategies for CR networks. In particular, the main contributions are:
• Chapter 2
In Chapter 2 we analyze some fundamental aspects of energy detection, when noise power estimation techniques are adopted. Most of current literature has focused on the ED limitations in presence of noise uncer-tainty, emphasizing the phenomenon of the SNR wall as an unavoidable problem. Very little attention has been paid to the study of how this phenomenon can be counteracted in practical scenarios. We analyze the statistical properties of the ED, addressing the threshold design, describing its asymptotical behaviour and providing the conditions for the existence of the SNR wall. We prove that these conditions are related to the statistical properties of the noise power estimator, and in particular to the accuracy of the estimate. This analysis allows to foresee the appearance of the SNR wall or, in a design perspective, to orient the choice of the proper noise power estimator. We show how the analysis can be applied in CR systems where the ED is used for fast sensing.
• Chapter 3
In the context of the eigenvalue based detection, in Chapter 3 we ana-lyze two tests derived by the GLRT analysis. We apply this analysis in the cooperative SS scenario; note that the model adopted can be used for the multiple antennas scenario as well. The first test studied is the
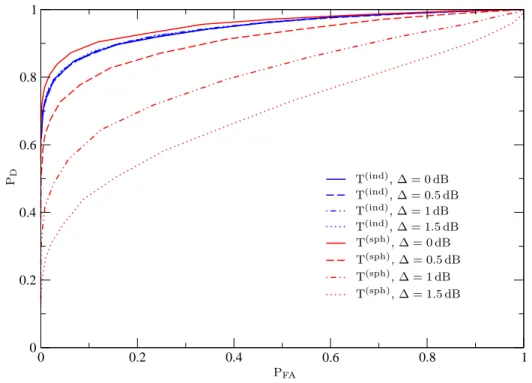
sphericity test, derived assuming that all the nodes/antennas experi-ence the same noise power level. Removing this assumption, that can be unrealistic in practical scenarios, the GLRT is the independence test. We address the statistical description of these tests, under the signal absent hypothesis, providing simple formulas for the derivation of the probability of false alarm and for setting the decision threshold under the NP framework. In particular, we approximate the tests as beta random variables (r.v.s) through a moment matching approach.
• Chapter 4
Considering wideband sensing, in Chapter 4 we propose an ITC based approach for identifying which portions of such band contain only noise. We provide a general formulation of this technique valid for all spectral representations of the observed band. Then we specialize the study for the case in which a simple discrete Fourier transform (DFT) is adopted at the secondary node receiver. We adopt both the simple approach that considers only the power level in each frequency component and a new approach that jointly exploit spectral correlation and received energy to discern signals from noise in a blind way. The proposed al-gorithms do not require neither the knowledge of the noise power nor any a priori information about the number and the characteristics of the signals to be detected. Numerical results reveal that the algorithm proposed outperforms simple ED approaches to wideband sensing, es-pecially in the presence of spectral correlation.
• Chapter 5
Motivated by the fact that localizing the PU can be very helpful for many functional tasks of a CR system, in Chapter 5 we analyze the per-formance of weighted centroid localization (WCL) strategies, that are very promising thanks to their simplicity of implementation and compu-tation and the fact that do not require any knowledge on the PU signal. In particular, we analyze the adoption of different weighting strategies, studying the dependence of the root mean square error (RMSE) on the PU position within the area considered, and identifying which strate-gies are more robust to situations in which the PU moves toward the side of the area. Two secondary user (SU) selection strategies are also proposed to alleviate the border and noisy measurements effects in harsh propagation environments.
1.5
Contribution
This thesis is the result of the work carried out within the telecommuni-cations group of the Department of Electrical and Information Engineering “Guglielmo Marconi” of the University of Bologna, Cesena campus. The dissertation is based on original publications in international journals and conferences. The study of the effect of noise power estimation, that can be found in Chapter 2, has been presented in part in IEEE conferences [90, 91] and published in the IEEE Transactions on Communications journal [92]. The statistical analysis of the eigenvalue based detector in Chapter 3 has been presented in [93], and the wideband SS technique based on ITC, de-scribed in Chapter 4, has been presented in part in [94]. A review of spectrum sensing issues in CR context has been presented in [57]. The cooperative weighted centroid analysis in Chapter 5 has been presented in [95] and has been carried out in the context of a visit at the Royal Melbourne Institute of Technology (RMIT) in Melbourne, Australia, under the supervision of Prof. Sithamparanathan Kandeepan. This collaboration has also led to a study on spectrum sensing in presence of non continuous PU transmissions, currently under revision [96].
This thesis has been carried out also in the context of European projects including FP7 EUWB - “Coexisting short range radio by advanced Ultra-Wideband radio technology” [97–102], EDA-B CORASMA “COgnitive RA-dio for dynamic Spectrum MAnagement” [103–106], FP7 SELECT “Smart and Efficient Localization, idEntification and Coopertation Techniques” [107, 108], and the COST Action IC0902 ‘Cognitive Radio and Networking for Co-operative Coexistence of Heterogeneous Wireless Networks”.
1.6
Notation
Throughout this manuscript boldface letters denote vectors, X ∼ N(µ, σ2) indicates a Gaussian r.v. with meanµand varianceσ2whileX ∼ CN(µ,2σ2) indicates a complex Gaussian r.v. with mean µand independent, identically distributed (i.i.d.) real and imaginary parts, each with varianceσ2. Also,X ∼
χ2
m(λ) indicates a chi-squared distributed r.v. with mdegrees of freedom and
non-centrality parameterλ,X ∼ Fν1,ν2(λ) indicates aF-distributed r.v., with
degrees of freedom ν1 and ν2, and non-centrality parameter λ, and Q(x) ,
R∞
x 1/
√
2πexp (−y2/2)dyis the standard normal tail function [109,110]. X∼
CN(µ,Σ) indicates a vector of complex Gaussian r.v.s with mean µ and covariance matrix Σ. Moreover, Mm×n(C) represents the space of them×n
determinant and the trace of the matrixA, diag{A}stands for the principal diagonal of A, (·)T and (·)H stand respectively for simple and Hermitian transposition. When possible, we use capital letters to denote r.v.s and lower case letters to denote the corresponding values.
Chapter 2
Effects of Noise Power
Estimation on Energy
Detection
2.1
Introduction
For single antenna receivers the simplest method to reveal the presence of a signal in AWGN consists in comparing the received energy, measured over a time intervalT, with a suitable threshold. This energy detector (ED) can be adopted when the signal to be detected is completely unknown and no feature detection is therefore possible. Even when the SU has some knowledge about the signal to be detected, the ED may still be chosen for the simplicity of its implementation [18,20]. Moreover, for its generality, the ED is commonly used in measurements of the spectral occupation that involve wide frequency bands with different kind of signals [111].
The performance of the ED has been studied in many works includ-ing [41, 112–114], where a perfect knowledge of the noise power at the re-ceiver was assumed, allowing thus a proper threshold design. In that case, the ED can work with arbitrarily small values of probability of false alarm and arbitrarily high probability of detection even in low SNR regimes, by using a sufficiently long observation interval. However, in real systems the detector does not have a perfect knowledge of the noise power level. Few works deal with the performance analysis of ED when the noise power is not perfectly known. In particular, in [47, 49, 115, 116], worst case design rules are provided for the ED, assuming that the detector knows that the noise power is within a limited range. Under this model, for a generic target performance, there exists a minimum value of SNR under which detection
is not possible even for infinitely long observation windows. This minimum is called SNR wall [49]. An idea that is growing into the spectrum sensing community is that the SNR wall phenomenon is an unavoidable problem in practical applications, since the estimated noise power always differs from the real noise power [49,116–118]. The aim of this paper is to establish the neces-sary and sufficient conditions for the existence of the SNR wall phenomenon in energy detection with estimated noise power (ENP-ED). We prove that the SNR wall phenomenon is not caused by the presence of an uncertainty in the noise power itself, but by an insufficient refinement of the estimation while the observation time increases. In particular, we provide two theorems regarding the conditions under which the SNR wall phenomenon occurs and the asymptotical behavior of the ENP-ED performance, as a function of the noise power estimator properties. The approach used in the paper is valid for all unbiased, asymptotically Gaussian noise power estimators. As a partic-ular case of practical interest we consider noise power estimation performed by using the maximum likelihood (ML) criterion, assuming the availability of noise-only samples at the receiver.1 These can be obtained in several ways including, e.g., the two-stage sensing methodology described in Section 2.2.1. In signal detection problems, some works consider the signal to be de-tected as the realization of a random process (“Bayesian” model), others as an unknown deterministic signal (“classical” model) [46]. The former often assumes the signals to be Gaussian, that in many situations is a proper as-sumption [46]. Note that in this case the ENP-ED approach is equivalent to observe two Gaussian processes and determine whether they have the same power level. The classical model, where the signal is assumed unknown de-terministic, is more general [46]. Hereafter we will consider both approaches, showing that for the considered problem the two models provide essentially the same results.
In this chapter we consider the detection of signals in AWGN, providing the following contributions.
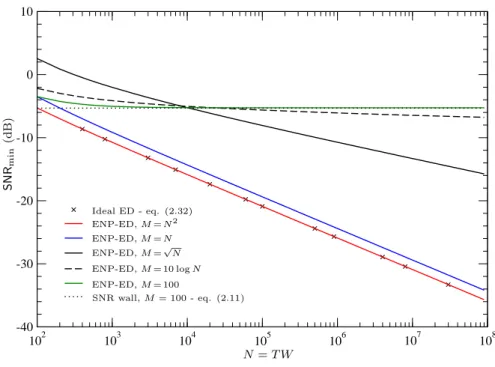
• We derive the conditions for the existence of the SNR wall in ENP-ED relating the accuracy of the noise power estimator to the observation interval duration. In particular, we show that the wall arises only when the variance of the estimator does not decrease with the measurement time.
• We analyze the behavior of the ENP-ED for long observation intervals, 1Within the paper the noise is modeled as a stationary white Gaussian process. This AWGN is caused by thermal noise and may include other background noise sources, as for example interference, when these can be modeled by stationary white Gaussian processes.
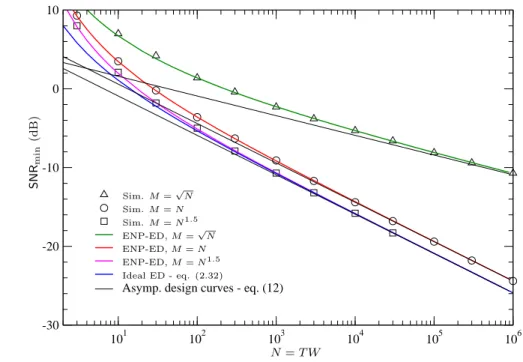
providing the asymptotical relation between the minimum detectable SNR and the observation time (design curves).
• We derive the analytical expressions of the design curves for the ideal ED and for the ENP-ED with ML noise power estimator.
• We analyze the performance and the design curves of the ENP-ED for two-step sensing schemes in CR scenarios.
2.2
System Model
We address the detection of the presence of a signal in AWGN. After band-pass filtering over a bandwidth W, the received signal r(t), observed for T seconds, is down converted and sampled at time ti = i/W, obtaining the
vector of complex samplesy= (y0, . . . , yN−1), with N =T W.2 The received energy to noise power spectral density ratio3 can be approximated as (see also [41, Appendix]) 2 N0 Z T 0 [r(t)]2dt≃ 1 σ2 NX−1 i=0 |yi|2 (2.1)
where N0 is the one-sided noise power spectral density and σ2 = N0W. In this paper we assume T W ≫ 1, so that the difference between the discrete time and the continuous time versions of the metric represented in (2.1) is negligible [41, 112]. Hence, in the following we will analyze the discrete time detection problem
H0 : yi =ni
H1 : yi =xi+ni (2.2)
where xi is the i-th signal sample, the noise samples ni ∼ CN (0,2σ2) are
i.i.d., H0 and H1 are the “signal absent” and “signal present” hypotheses, respectively.
The ED test we will consider is Λ(y), 1 2σ2 · 1 N NX−1 i=0 |yi|2 H1 ≷ H0 ξ. (2.3)
The SNR is defined as SNR = S/σ2 with S = E{|x
i|2}/2 when the xi
are assumed i.i.d. Gaussian with Xi ∼ CN(0,2S) (Bayesian model), and
2We assume thatT W is an integer number. 3The metric is therefore dimensionless.
as SNR = 1/(2σ2N)· PN−1
i=0 |xi|2 when the xi are assumed unknown and
deterministic (classical model).4
In the following, the ED performance will be expressed in terms of prob-ability of false alarm PFA = P{Λ(Y)> ξ|H0}, and probability of detection PD = P{Λ(Y)> ξ|H1}.
According to the Neyman-Pearson criterion, the threshold ξ in (2.3) should be set for a given requirement in terms of PFA, and this is possible only ifσ2is known [45]. However, in practical implementations we must gen-erally assume that the ED has just an estimate,σb2, of the trueσ2[47,49,112]. Then, the ED test becomes in practice
Λg(y) = 1 2bσ2 · 1 N NX−1 i=0 |yi|2 H1 ≷ H0 ξ. (2.4)
The statistical distribution of Λg(y) depends on the particular estimation technique considered. We will refer to (2.4) as the ED with estimated noise power (ENP) (see also Fig. (2.2)).
Note that (2.3) is the log-likelihood ratio test for the detection problem (2.2), when the xi i.i.d. r.v.s with zero mean Gaussian distribution. Moreover,
(2.4) is the generalized likelihood ratio test when the receiver does not know anything about the signal to be detected (signal unknown and deterministic).
2.2.1
Two-step sensing
The simplest way to estimate the noise power is to perform ML estimation on noise-only samples. For impulse radar applications it is quite simple to locate some signal-free samples due to the sporadic occupation of the chan-nel. In CR scenarios instead it is generally much more difficult to guarantee the availability of noise-only samples for environment measurements.
In this regards, in this section we describe the “two-step” sensing schemes, that can be adopted for the implementation of ML noise power estimation. Two-step schemes are motivated by the fact that, while the ED can be used with small sensing periods (even if with limited performance), other more sophisticated sensing methods, with better performance, generally require long observation intervals, with an impact on the efficiency of the SU com-munications [18]. An effective strategy consists in the combined adoption of sporadic long sensing periods (SPs) for fine sensing (called fine-SPs), and more frequent short SPs (called fast-SPs) in which simpler detectors, such as the ED, can be used (Fig. 2.1). This two-step sensing scheme is sup-4Note that if the signal is ergodic, the two definitions of SNR are equivalent forN → ∞.
Fine sensing periods Fast sensing periods
Time
Figure 2.1: Two step sensing scenario in the IEEE 802.22 draft standard [119].
ported by recent CR standards; for example, the IEEE 802.22 draft includes the use of intra-frame periods (5-10 ms) and inter-frame periods (up to 158 ms) [119, 120], while the standard ECMA 392 uses regular SPs , of at least 5 ms, and optional on-demand SPs for further spectral measurements [27]. If, during a fine-SP, where a high accuracy detection algorithm is adopted5, the decision is forH0, the samples collected can be considered signal-free; we propose to use them for noise power estimation for the subsequent fast-SPs. This detection strategy is depicted in Fig. 2.2.
More generally we can consider, for the fine-SP, the adoption of strategies that provide, beyond the detection decision, also an estimate of the noise power. Methods based on multiple antennas can be useful for this task [67].
2.2.2
Noise uncertainty
Noise power uncertainty is mainly caused by four factors [121]:
• temperature variation;
• change in low noise amplifier gain due to thermal fluctuations;
• initial calibration error;
• presence of interferers.
Noise power estimation with a sufficient rate can be used to overcome the first three factors because thermal changes are very slow phenomena. Indeed the noise power level is stationary typically for a few minutes [115]. The presence of interference caused by other SUs in the CR network instead introduces dynamics in the background RF energy that are too fast to be tackled with
r ( t ) B P F W D ow n C o n v er si o n S a m p le r fa st se n si n g fi n e se n si n g p a th p a th 1 2 N P | . |2 ÷ ≷ ξ F in e se n si n g d et ec to r P ow er E st im a ti o n u p d a te b σ 2 if H 0 ν ( y ) b σ 2 Λ g F in e se n si n g F a st se n si n g d ec is io n d ec is io n F ig u re 2.2 : T w o-st ep d et ec tio n sc h em e su p p or tin g E D w it h n ois e p ow er es tim at io n fo r fa st se n sin g.
periodical estimations. To overcome this problem, the SPs scheduled in the standards IEEE 802.22 [119,122] and ECMA 392 [27] are synchronized among the SUs to avoid mutual interference. These SPs are called quiet periods. Therefore to avoid the noise uncertainty problem the SU must periodically estimate the noise power during the quite periods.
2.2.3
Design curves
Let us indicate as (PDESFA ,PDESD ) the desired detector performance, with PDESFA < PDESD , so that the detector fulfills the requirement if its PFA, PD satisfy both PFA ≤PDESFA and PD≥PDESD . The relation between the SNR and the number of samples N required to guarantee the desired performance will be referred as design curve [90, 91]. Note that, given the sampling frequency W, the number of samples is proportional to the time needed for the detection task. Then, the design curve can also be considered as the minimum signal-to-noise ratio, SNRmin, needed to fulfill the specification (PDES
FA ,P DES
D ), for a given sensing time duration.6
To derive the design curves we observe that, in general, the expressions of PD and PFA are functions of the threshold ξ, the number of samples N, the SNR, and possibly other parameters,
PFA =fFA(ξ;N, . . .) (2.5)
PD=fD(ξ;N,SNR, . . .) (2.6)
where fFA(·) and fD(·) are specific functions depending on the particular detector statistic considered. The threshold ξ, corresponding to the target probabilities PDESFA ,PDESD can be expressed, using the inverse form of (2.5) and (2.6), as
ξ=fFA−1 PDESFA ;N, . . . (2.7)
ξ=fD−1 PDESD ;N,SNR, . . .
. (2.8)
Then, the design curve can be obtained by solving explicitly for the variable
SNRmin the equation
fFA−1 PDESFA ;N, . . .=fD−1 PDESD ;N,SNRmin, . . .. (2.9)
If the PFA and PD formulas have not an analytical explicit inverse form, the problem can be solved numerically.
6Within the paper we plot the design curves as SNR vs. N like in [47]. The SNR on the y-axis emphasizes that the SNR wall (if present) is a minimum. Then we could also use the expression “SNR floor”, but we choose to maintain the expression “SNR wall” in continuity with [49, 116].
![Figure 1.1: Traffic forecast in PB/month, CISCO VNI Feb. 2013 [3].](https://thumb-us.123doks.com/thumbv2/123dok_us/8997546.2797582/18.892.158.692.184.528/figure-traffic-forecast-pb-month-cisco-vni-feb.webp)
![Figure 1.2: The cognitive cycle [13].](https://thumb-us.123doks.com/thumbv2/123dok_us/8997546.2797582/19.892.216.669.487.819/figure-the-cognitive-cycle.webp)
![Figure 1.3: DSM reformulation of the cognitive cycle [16].](https://thumb-us.123doks.com/thumbv2/123dok_us/8997546.2797582/21.892.245.673.209.593/figure-dsm-reformulation-cognitive-cycle.webp)