LEAKAGE DETECTION IN PIPELINES USING EMPIRICAL MODE DECOMPOSITION
MOHD ERMAN FAIRUZ BIN ZAIDI
Thesis submitted in fulfilment of the requirements for the award of the degree of
Bachelor of Mechanical Engineering with Automotive Engineering
Faculty of Mechanical Engineering UNIVERSITI MALAYSIA PAHANG
ABSTRACT
This thesis deals with leakage detection in pipeline using empirical mode decomposition (EMD). Leakage in pipelines being a major problem in industry that use piping system in their operation, for example water distribution company. The objectives of this thesis are to study the leakage detection method and signal processing method then utilize them to detect and locate the leakage. This thesis describes experimental conduct to visualize usual type of leakage in pipeline system. The experiment was design to have certain part of piping system and leakage is attached to the system. This experimental test rig also attached with pressure transducer at the top of the solenoid valve. Sensor use in this experiment is piezoelectric pressure sensor. The signal was captured with data acquisition component and synchronised with Daisy Lab software. Data then being analyzed with Matlab software. In Matlab software, one of signal processing method; empirical mode decomposition was applied to detect the leakage. Peak show at the graph visualize the present of leak in the pipe system. The location of the peak than be analyse to get the time taken by the signal approaching the leak. This time then being calculated using distance leakage formula given to locate the distance of the leakage from the sensor attached. Then the data is compared with the designed leak so the result can be compared and discussed. The results show the error in conducting the experiment because major from the noise from the pump and recommendation to improve the process of detecting leakage also being includes for further test and experiment such as better design of experiment, other parameter can be use in further experiment and other.
ABSTRAK
Tesis ini berkaitan dengan pengesanan kebocoran pada saluran paip menggunakan penguraian mod empirikal (EMD). Kebocoran dalam system paip adalah satu masalah yang besar bagi industry yang terlibat dengan system paip dalam operasi syarikat, contohnya syarikat pengedaran air terawat. Objektif tesis ini adalah untuk mengkaji kaedah pengesanan kebocoran dan kaedah pemprosesan isyarat dan mengaplikasikan kaedah tersebut bagi mengesan kebocoran dan lokasi kebocoran. Tesis ini menerangkan mengenai eksperimen yang dilakukan bagi mengesan kebocoran yang biasa terjadi dalam sistem saluran paip. Eksperimen telah di reka bentuk untuk mempunyai bahagian tertentu yang biasa dalam sistem paip dan kebocoran diletakkan kepada sistem. Tempat ekperimen juga dipasang dengan transduser tekanan pada bahagian atas injap solenoid. Sensor yang digunakan dalam eksperimen ini adalah sensor tekanan piezoelektrik. Isyarat telah diambil dengan menggunakan komponen pemerolehan data (Ni-DAQ) dan di olah dengan perisian Daisy Lab. Data kemudian dianalisis dengan perisian Matlab. Perisian Matlab kemudian dimasukkan salah satu kaedah pemprosesan isyarat; penguraian mod empirikal digunakan untuk mengesan kebocoran dalam sistem paip. Puncak yang di pamerkan pada graf adalah menggambarkan kehadiran kebocoran dalam sistem paip. Lokasi puncak pada graf akan dianalisis untuk mendapatkan masa yang diambil oleh isyarat melalui kebocoran dalam paip. Masa yang dikira berdasarkan formula mengira jarak kebocoran digunakan untuk mencari jarak kebocoran dari sensor ke kebocoran. Kemudian lokasi jarak yang diperoleh dibandingkan dengan jarak kebocoran direka dan keputusan boleh dibandingkan dan dibincangkan. Keputusan yang diperoleh menunjukkan berlakunya kesilapan dalam menjalankan eksperimen seperti gangguan dari pam air dan cadangan untuk memperbaiki proses mengesan kebocoran juga dimasukkan agar ekperimen dan ujian pada masa depan dapat dilakukan dengan lebih baik, contohnya rekabentuk yang lebih baik serta parameter ekperimen yang boleh digunakan pada masa hadapan.
TABLE OF CONTENTS
Page
SUPERVISOR’S DECLARATION ii
STUDENT’S DECLARATION iii
ACKNOWLEDGEMENTS iv
ABSTRACT v
ABSTRAK vi
TABLE OF CONTENTS vii
LIST OF TABLE x
LIST OF FIGURES xi
LIST OF ABBREVIATIONS xiii
CHAPTER 1 INTRODUCTION 1.1 Introduction 1
1.2 Problem Statement 2
1.3 The Objective of the Research 3
1.4 The Scope of the Research 3
CHAPTER 2 LITERATURE REVIEW 2.1 Introduction 4
2.2 Wave propagation theory 5
2.2.1 Introduction 5
2.2.2 Water hammer phenomenon 6
2.2.3 Wave characteristic 6
2.2.4 Wave propagation speed 7
2.3 Leak detection method 8
2.3.1 Leak detection based on external method 8
2.3.2 Acoustic emissions 8
2.3.3 Ground penetrating data 9
2.3.4 Acoustic leak detection 10
2.3.5 Leak detection based on internal method 11
2.3.7 Statistical analysis model 12
2.4 Signal processing method 12
2.4.1 Fourier analysis 12
2.4.2 Wavelet 13
2.5 Empirical mode decomposition (EMD) 14
2.5.1 Intrinsic mode function (IMF) 15
2.5.2 The Sifting Process 15
CHAPTER 3 METHODOLOGY
3.1 Introduction 18
3.2 Process Flow 19
3.3 Gantt chart 20
3.4 Material selection 21
3.4.1 Medium Density Polyethylene (MDPE) 21
3.4.2 Galvanized Iron (GI) 22
3.5 Pressure transducer 22
3.6 Strain gauge 23
3.7 Piezoelectric pressure sensor 24
3.8 Transient method 25
3.9 Experiment design 26
3.10 Experiment apparatus 27
3.11 Experimental test rig 31
CHAPTER 4 RESULT AND DISCUSSION
4.1 Introduction 33
4.2 Experiment designed parameter 33
4.3 Galvanised iron experiment result 34
4.3.1 No leak pipe system 34
4.3.2 Front leak pipe system 39
4.3.3 Back leak pipe system 40
4.4 Medium density polyethylene 40
4.4.1 No leak pipe system 40
4.4.2 Front leak pipe system 41
4.5 Table of result 41
4.6 Discussion 42
CHAPTER 5 CONCLUSION AND RECOMMENDATION
5.1 Introduction 44
5.2 Conclusion 44
5.3 Recommendation 44
LIST OF TABLE
Table No. Title Page
1.1 Total Estimated Losses of Revenue due to NRW 2 1.2 Estimated cost for NRW by AWER for year 2008, 2009 3
and 2010
3.1 Gantt Chart 22
3.2 MDPE properties 24
4.1 Experiment design parameter 36
LIST OF FIGURE
Figure No. Title Page
2.1 Leakage detection techniques timeline 6
2.2 Example of quick closing valve 7
2.3 Ship with transmitting transducer and hydrophone arrays 10 2.4 Propagation path from the middle of the array to position 10
x laying on the array.
2.5 A typical set up to determine the position of a leak from 12 a buried water distribution pipe
2.6 Fourier spectra 15
2.7 Wavelet transform: signal and analysis function for a = 0.5 16 2.8 A schematic representation of sifting process. 19
(a) The original signal; (b) The signal in thin solid line; The upper and lower envelopes in dot-dashed lines; The mean in thick solid line; (c) The difference between the signal and mean
3.1 Process flow chart 21
3.2 Galvanised iron pipe 24
3.2 Principle of a pressure sensor strain gauge resistor 25
3.3 Design pressure transducer 25
3.3 Strain gauge attached at the transducer 26
3.4 Structure of strain gauge 26
3.5 Piezoelectric pressure sensor 27
3.6 Piezoelectric pressure sensor diagram 27
3.7 Design of test rig 29
3.8 Front view of test rig design 29
3.9 90° Elbow 30 3.10 Equal T-junction 30 3.11 Reducer 30 3.12 Water pump 31 3.13 MDPE pipe 31 3.14 Stop valve 31
3.15 Data acquisition instrument (Ni-DAQ) 32
3.16 Pressure transducer 32
3.17 Leakage valve 32
3.18 GI pipe 33
3.19 Transient pipe configuration 33
3.20 GI pipe configuration 34
4.1 Intrinsic mode function 1 36
4.2 Intrinsic mode function 2 37
4.3 Intrinsic mode function 3 37
4.4 Intrinsic mode function 4 37
4.5 Intrinsic mode function 5 38
4.6 Intrinsic mode function 6 38
4.7 Intrinsic mode function 7 38
4.8 Intrinsic mode function 8 39
4.10 Intrinsic mode function 10 39
4.11 Intrinsic mode function 11 40
4.12 Intrinsic mode function 12 40
4.13 Intrinsic mode function 13 40
4.14 Intrinsic mode function 14 41
4.15 Intrinsic mode function 15 41
4.16 Intrinsic mode function 3 for front leak 42 4.17 Intrinsic mode function 1 for back leak 42 4.18 Intrinsic mode function 1 for no leak 43 4.19 Intrinsic mode function 1 for front leak 43 4.20 Intrinsic mode function 3 for back leak 44
LIST OF ABBREVIATIONS
AWER Association of Water and Energy Research Malaysia NRW Non revenue water
EMD Empirical mode decomposition GPS Global positioning system HHT Hilbert Huang transform HSA Hilbert spectral analysis IMF Intrinsic mode function
HT Hilbert transform
MDPE Medium density polyethylene
GI Galvanised iron
HDPE High density polyethylene Ni-DAQ Data acquisition instrument
CHAPTER 1
INTRODUCTION
1.1 INTRODUCTION
Leakage in pipeline is one of major problem occur to the system that using the pipe system. Leakages in pipeline occur on all sectors with pipe system but major losses for the water supply company at all over the world. This happen because the pipe is facing a lot of problem in real life such as life span of the pipe expired, pressure from above surface or the structure of the soil around the pipeline move or changes. After certain period, this problem will affect the pipeline and will become major problem that is leakage in pipeline.
There are so many methods nowadays to detect the leakage in pipeline. Some of them are use in a big scale, and some are small unit of equipment needs. All the aim of the method are same, to detect the place of the leakage. The analysis also comes in many types. All the analysis has their advantages and disadvantages. Leak detection method is not new to us, but the application of them is not familiar to us.
1.2 PROBLEM STATEMENT
Major problems of leakages in pipeline are related to the water supply of our country, Malaysia. In every state, there are major losses happen to the water supply company from this problem. Association of Water and Energy Research Malaysia (AWER) has carried out Non-Revenue Water (NRW) modelling study based on year 2010 statistics from Malaysia Water Industry Guide 2011. The NRW percentage was drop from 36.63% in year 2009 to 36.37% in year 2010. But, the all the volume of treated water loss has recorded an increase from 1.80 billion cubic meters (m³) in year 2009 to 1.87 billion cubic meters (m³) in year 2010 or equivalent to 3.5% increase.(Piarapakaran P,2012)
AWER used usual tariff for domestic and commercial sector, consumption percentage for domestic and commercial sector as well as total volume of NRW as basic parameters for the modelling.
The result of the tabulation is shown in table 1.1:
Table 1.1: Total Estimated Losses of Revenue due to NRW
Total Estimated Losses of Revenue due to NRW
Year 2008 Year 2009 Year 2010
RM 1,617,358,972.42 RM 1,626,240,834.28 RM 1,744,674,131.76
Source: Malaysia Water Industry Guide 2011
Total revenue for water sector in year 2010 is RM 4,086,618,000. The loss of revenue due to NRW is about 42.7% of the total revenue in water services sector. The total of revenue loss due to NRW for the year 2008, 2009 and 2010 is about RM 4.99 Billion [11]. Table 1.2 show the distribution of estimated loss of revenue due to NRW for each state in Malaysia.
Table 1.2: Estimated cost for NRW by AWER for year 2009 and 2010 State 2009 2010 Estimated cost for NRW (RM) Ranking Estimated cost for NRW (RM) Ranking Selangor 557,987,210.88 1 598,964,961.50 1 Johor 210,330,186.68 2 200,942,867.00 2 Sabah 142,392,600.00 3 175,434,300.00 3 Pahang 136,582,674.96 4 132,854,905.28 5 Kedah 118,016,700.80 5 140,882,636.70 4 Negeri Sembilan 108,389,664.24 6 114,047,736.00 6 Perak 90,442,400.23 7 93,328,496.80 7 Sarawak 79,515,015.30 8 86,267,564.60 8 Terengganu 58,107,856.40 9 63,283,129.48 9 Kelantan 39,665,152.15 11 47,570,766.60 10 Melaka 42,857,985.60 10 38,098,973.84 11 Penang 26,568,356.40 12 32,928,804.84 12 Perlis 11,274,730.64 13 16,027,089.12 13 Labuan 4,110,300.00 14 4,041,900.00 14 Total 1,626,240,834.28 1,744,674,131.76 (Note: Ranking is listing from highest to lowest)
Source: Malaysia Water Industry Guide 2011
1.3 THE OBJECTIVE OF THE RESEARCH
1. To develop test rig and conduct the experiment base on transient flow. 2. To utilize signal processing method in detecting leakage in pipeline. 3. To locate the position of the leakage occur in pipeline.
1.4 THE SCOPE OF THE RESEARCH
The scope is research the signal processing to detect leakage in pipeline using Empirical Mode Decomposition (EMD). Second is utilizing the EMD method to detect leakage in pipeline. Lastly is to conduct the experiment and applying EMD method to detect and locate little present of leak in pipeline system.
CHAPTER 2
LITERATURE REVIEW
2.1 INTRODUCTION
The purpose of this chapter is provide a review of past research efforts related to signal processing in detection the leakage in pipeline especially in empirical mode decomposition (EMD). A review of other relevant research studies is also provided. Substantial literature also been studied on major of signal processing method in leakage detection such as Fourier transform, The Wavelet Analysis and others.
However, some information can be found on integrated durability evaluation methods. The review was organized chronologically to show us that how past research efforts have laid the groundwork for henceforth studies, including the existing research effort. The review is show completely so that the present research effort can be properly tailored to add to the present body of literature as well as to justly the scope and direction of the present research.
There are many ways or methods to detect the leakage in pipeline. In signal processing also have many type of method to detect leakage in pipeline. Some of them are using acoustic method (using sound capture) and transient method using the pressure transducer. It depends on what we want to detect and the situation at the place that be test. A leak from a water supply pipe creates noise. These features can be used to locate and detect the leak. Acoustic leak detection techniques have been shown to be suitable for steel pipe, and are in common use in the water industry. Other methods of leak detection have been used with varying degrees of success are tracer gas.
thermography, flow and pressure modelling, and ground penetrating radar.(Brennan M.J., 1999) From day to day many new techniques have been proposed.
The figure 2.1 shows the timeline for the leakage detection technology.
Figure 2.1: Leakage detection techniques timeline.
Source: 1992. Tutorial on software based leak detection techniques. Whaley R.S. et al.
2.2 WAVE PROPAGATION THOERY
2.2.1 Introduction
Wave propagation in pipeline occurs due to disturbance in the flow inside the pipeline. Disturbance can be generally defined as anything that effect, prevent, hold or inhibit the wave inside the fluid.(Ghazali M.F, 2012). This disturbance is transferred from one molecule to the next molecule and causes a wave in the medium. Consequently, the density of the fluid is changed instantaneously, which then produce waves that propagates through the system.(Walski T.M et al, 2003).
Example of disturbance is as follows: 1. Suddenly close of the valve 2. Pump trip
3. Pump started up and shut down 4. Change in reservoir pressure
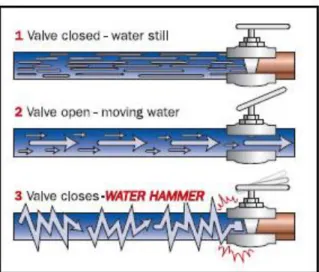
2.2.2 Water hammer phenomenon
Water hammer phenomenon is happen when the valve is suddenly open or closed. This happen because the pressure at the time the valve changed position change (Ghazali M.F, 2012). Water hammer refers to the transient conditions in a hydraulic system that prevails following the sudden change of flow in a pipe. Figure 2.2 describe visually the water hammer phenomenon in pipe when the valve is close quickly.
Figure 2.2: Example of quick closing valve.
Source: Http://www.plastiomatic.com/water-hammer.html.(2012)
The pressure increase of the water hammer can be theoretically calculated by the equation 2.3:
(2.1) P= pressure increase, PI= inlet pressure, V= flow velocity (ft/sec), t= valve closing time (s), L= upstream pipe length.
2.2.3 Wave characteristic
Wave from the flow throughout the pipe will partially reflected back, partially transmitted forward and some of it will be absorb when there is discontinuities.
Example of discontinuities is leaks, change in diameter of the pipe and features of the pipe such as T-junction, bend, 90 degree, 45 degree and close end of the pipe.
2.3.3 Wave propagation speed
The speed of the wave propagation inside the pipelines is one of the important values in operates the leakage detection. It is one of the main challenges to the workers because to successfully analyze the signal of the leakage, the value is needed. But, in pipelines, the value of the speed is different depending on the pipe diameter, pipe stiffness and material of the pipe. Theoretically, speed of wave propagation can be getting from the equation below:
(2.2)
where c = wave propagation speed (m/s), = density of the fluid (kg/m^3), K = Bulk modulus of the liquid (N/m2), E = Young’s modulus of the pipe material (N/m2), ϕ=
restraint factor dependent on the Poisson’s ratio of the wall material and how well the pipe is supported, D = diameter of the pipe and e= wall thickness of the pipe.
But, in actual water distribution networks the actual wave speed may differ from the theoretical value because of several factors such as uncertainty in the asset information of pipe buried many years ago, the occurrence and recording or otherwise of rehabilitation work, such as relining, asset deterioration, such as the formation of mineral deposits lining the pipe wall, decreasing the actual pipe diameter from those on the asset records and the presence of stretches (Shucksmith J.D., 2007).
2.3 LEAK DETECTION METHOD
2.3.1 Leak detection based on external method
External method is the process occurs outside of the pipeline system. There are 3 categories which is sound propagation which consists of acoustic emissions, ground penetrating radar. The second is visual observation which includes direct observation and pig based monitoring systems. The third is by using smell such as tracer injection.
2.3.2 Acoustic emissions
Figure 2.3 shows the sensor configuration of such a system. A transducer transmits a non-linear acoustic pulse which reflects or scatters against the pipe wall. The reflections or echoes are received by the hydrophones.(Nico Roosneck,nil)
Figure 2.3: Ship with transmitting transducer and hydrophone arrays
Source: Roosneck research and Devolopement
The propagation path of a low frequency acoustic pulse transmitted by an echo sounder, reflected against the pipe and received by the hydrophone is shown by Figure 2.4.
Figure 2.4: Propagation path from the middle of the array to position x laying on the array.
Source: Roosneck research and devolopement.
2.3.3 Ground penetrating data
Ground penetrating radar is a method or technique that uses high frequency electromagnetic waves to acquire subsurface information. By using this method, the leaks can be detected and located without need to dig the soil which can reduce the time to operate the leakage detection. Ground penetrating radar operates with electromagnetic radiation propagates through ground and then returns to the surface.(Eyuboglu,2000) Generally, this method is identified leak in buried water pipelines by detecting underground voids created by the leaking water. Furthermore, this method operates by detecting the changes in properties of the material around the pipes due to water saturation from the leaks.
This method detects the changes in electrical properties of the soil, rock and moisture content that respond to the sensor. Ground penetrating radar does not have limitations on the material of the pipeline compared to other method.(Eyuboglu,2000) It
can be used effectively on both metal and plastic pipe. The advantage of this method is its speed, simplicity to use and low level of technical support.
2.3.4 Acoustic leak detection
In leak detection surveys using acoustic methods, the most widely used approach involves the cross-correlation of the measured acoustic signals. This has proved to be reasonably effective in detecting and locating metal pipes, but has been problematic when used on plastic pipes. Recent work focussed on trying to determine the reasons why this is so, and to investigate ways of improving the technique for plastic pipes. In this article the analysis of the research are summarised; the reader is referred to the references for further technical details.(Brennan M.J,1999)
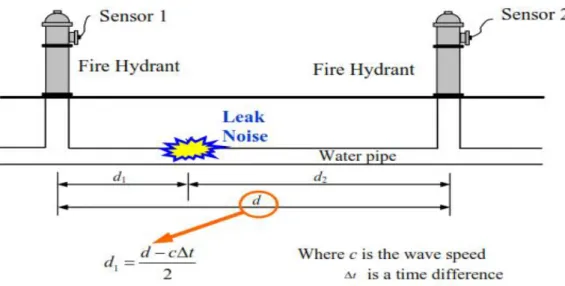
A typical measurement layout to determine the location of a leak in a buried plastic pipe is shown in Figure 2.5.
Figure 2.5: A typical set up to determine the position of a leak from a buried water distribution pipe.
If a leak is suspected, the acoustic sensors (typically accelerometers or hydrophones) are placed either side of the leak at easy operating access points, for example hydrants. The aim is to locate the position of the leak; means in this case is the distance from sensor 1 to the leak.(Y gao,2004) This distance is related to other variables by
(2.3)
Where d is the distance between the two sensors, c is the speed at which the leak noise propagates through the pipe, and ∆t is the difference in arrival times of the noise at the two sensors. Thus to accurately determine the leak these three variables need to be known. The distance between the sensors d, can be measured reasonably accurately using a variety of methods, for example GPS. The wave speed c, is hard to measure and remains an area for further research. However, there is now a logically good understanding of the factors that affect this, and these are discussed in the next section. To estimate c∆t, the cross-correlation of the signals from the sensors is generally used. However the quality of this result data depends upon the type and positioning of the sensors and the processing of the signals.
2.3.5 Leak detection based on internal method
The internal method is based on the monitoring of internal pipeline parameters (pressure, flow and temperature) with the use of instruments to measure internal hydraulic conditions.(Warda H.A,2004)
2.3.6 Hydrostatic-testing
Hydrostatic (or hydro) testing is a traditional method of determining and locating leaks by examining each length of pipeline as it is laid. This method previously been used in water, oil and gas industries to test the integrity of steel pipes.(Hough J.E,1988) Any reduction of the pressure show by pressure sensors which is placed in the pipe could indicate the presence of a leak. This technique fairly good because leaks can
be found when the pipe has just been placed and the leaking pipe can be easily replaced with a new one.(Ghazali M.F, 2012)
2.3.7 Statistical analysis model
A statistical leak detection system uses advance statistical technique to analyze the flow rate, pressure and temperature measurements of a pipeline.(Whaley R.S,1992) This method is appropriate for complex pipe system as it can be monitored continuously for continual changes in the line and flow/pressure instruments. The main objective of this system is to minimise the rate of false alarm. It is also suitable for real time application and has been successfully tested in oil pipeline systems.(Zhang J,2001)
2.4 SIGNAL PROCESSING METHOD
The history of signal analysis is starting by using Fourier transform techniques. But this method has its own limitations. It can only detect the leaks but cannot identify the location and the time when the leaks occurred.(Press W.H, 2008) So in order to obtain an accurate and complete data of the leak, many techniques of signal analysis have been developed such as wavelet, cepstrum, empirical mode decomposition (EMD) and many more.
2.4.1 Fourier analysis
Fourier analysis is one of early method in signal processing to detect the leakage in pipeline. This classic method is no longer used because there are lot limitations. One of them is this method only can used for linear pipe system. Then, Fourier Transform gives a global energy-frequency representation of the data sequence.(Press W.H,2008) If the data is non-stationary, Fourier spectrum cannot make any physical significance. Next is Fourier cannot locate any frequency in time. Taking short time Fourier Transform reduces frequency resolution, and it still subjected the stationary assumption in that region.(Nii Attoh et al, 2008)
When using the Fourier transform, the suppression of 96% of the transform signal values - namely those transform signal values having lower absolute values than
the retained ones - leads to a global smoothing (low pass filtering) and therefore the local peaks during the attack phase are not reproduced any more.(Hans G.S, 2005) Figure 2.6 show how the Fourier works in signal.
Figure 2.6: Fourier spectra
Source: 2008, The empirical mode decomposition and the Hilbert-huang transform.
2.4.2 Wavelet
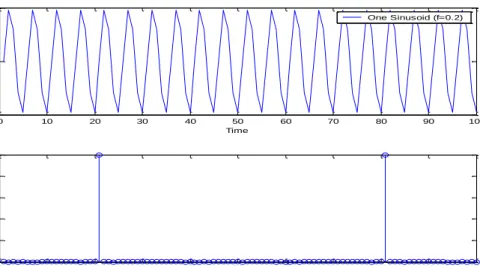
Wavelet analysis had its origins in the mid-eighties. From the very beginning it was driven by application needs: The desire to analyze seismic signals more sensitively than with Fourier techniques led to the first appearance of the continuous wavelet transform formula.(Hans G.S,2005) The wavelet transform has such a zooming property. In contrast to the Fourier transform, the wavelet transform does not look for circular frequencies but rather for detail sizes a at a certain time t.(Hans G.S,2005) Figure 2.7 show transformation of wavelet to signal and analysis function.
0 10 20 30 40 50 60 70 80 90 100 -0.5 0 0.5 Time Am pl itu de One Sinusoid (f=0.2) 0 10 20 30 40 50 60 70 80 90 100 0 5 10 15 20 25 DFT Index X( w )
Figure 2.7: Wavelet transform: signal and analysis function for a = 0.5
Source: 2008, Fourier transform spectrum method
The term “wavelet” means a small wave with finite energy, which has its energy concentrated in time or space to serve as a base function for the analysis of transient, nonstationary or time varying phenomena.(Ghazali M.F,2012) The most important properties of wavelets are the admissibility and the regularity conditions and these are the properties which gave wavelets their name.(Valens C, 1999) In the past, wavelet analysis has been widely implemented for various unique purposes, such as de-noising of signals, compression of signals and images, information retrieval from noise polluted signals, classification, and pattern recognition applications.(Brenner M.J,2003) A limit of the wavelets is that the basic functions are fixed, and thus do not should match all real signals.(Boudraa A.O et. al,nil)
2.5 EMPIRICAL MODE DECOMPOSITION (EMD)
Empirical mode decomposition, EMD is the method creates to overcome the classic Fourier analysis. This is because Fourier only limited to linear system only.(Huang N.E et al,1998) In reality, there are so many configurations in the pipe system. So the classic Fourier analysis is no longer useful in order to use in present system. Other reason is the data from natural phenomena usually non-stationary due to its transient nature. To simplify and analyze data in Fourier analysis, the data stationary often being assumed. Lastly the result exist are not exactly perfect. This will be another problem creates, beside the leakage problem we want to be solve.(Norden E.H,1998)