Ingarfield, K., McMahon, A. D. , Douglas, C. M., Savage, S.-A., Conway,
D.
I. and MacKenzie, K. (2019) Determinants of long-term survival in a
population-based cohort study of patients with head and neck cancer from
Scotland.
Head and Neck, 41(6), pp. 1908-1917.
There may be differences between this version and the published version.
You are advised to consult the publisher’s version if you wish to cite from
it.
Ingarfield, K., McMahon, A. D. , Douglas, C. M., Savage, S.-A., Conway,
D.
I. and MacKenzie, K. (2019) Determinants of long-term survival in a
population-based cohort study of patients with head and neck cancer from
Scotland. Head and Neck, 41(6), pp. 1908-1917. (doi:
10.1002/hed.25630
)
This article may be used for non-commercial purposes in accordance with
Wiley Terms and Conditions for Self-Archiving
.
http://eprints.gla.ac.uk/177792/
1
Determinants of long-term survival in a population-based cohort
study of head and neck cancer patients from Scotland
Article type: Original research article
Kate Ingarfield¹, Alex D. McMahon¹, Catriona M. Douglas³, Shirley-Anne Savage⁴, David I. Conway¹, Kenneth MacKenzie²
¹School of Medicine, Dentistry, and Nursing, University of Glasgow, Glasgow, UK
²Department of Otolaryngology – Head and Neck Surgery, Glasgow Royal Infirmary, Glasgow, UK ³ Department of Otolaryngology – Head and Neck Surgery, Queen Elizabeth University Hospital, Glasgow, UK
⁴Emergency Care and Medicine Directorate, Victoria Hospital, Kirkcaldy, UK
Funding/acknowledgments
The Scottish Audit of Head and Neck Cancer (SAHNC) was funded by the Clinical Resource and Audit Group, Scottish Executive Health Department, through the Scottish Cancer Therapy Network. The British Association of Head and Neck Oncologists (BAHNO) awarded the grant for the data linkage follow-up. Kate Ingarfield is funded via the NHS National Services Scotland (NSS) PhD Studentship. We would like to acknowledge the original SAHNC clinical teams and patients who participated. We also thank the Cancer Survival Group at the London School of Hygiene and Tropical Medicine for providing the life-tables required for the computation of net survival.
Corresponding author: Kate Ingarfield, School of Medicine, Dentistry, and Nursing, University of
Glasgow, 378 Sauchiehall Street, Glasgow, G2 3JZ, UK, +44(0)141 211 9750,
2
Abstract
Background: We investigated long-term survival from head and neck cancer using different survival
approaches.
Methods: Patients were followed-up from the Scottish Audit of Head and Neck Cancer. Overall and
disease-specific survival were calculated using the Kaplan-Meier method. Net survival was calculated by the Pohar-Perme method. Mutually adjusted Cox proportional hazards models were used to determine the predictors of survival.
Results: n = 1,820. Overall survival at 12-years was 26.3% (24.3%, 28.3%). Disease-specific survival
at 12-years was 56.9% (54.3%, 59.4%). Net survival at 12-years was 41.4% (37.6%, 45.1%).
Conclusion: 26.3% patients were alive 12-years after diagnosis, and the determinants associated
with long-term survival included age, stage, treatment modality, WHO performance status, alcohol consumption, smoking behaviour, and anatomical site. We recommend that net survival is used for long-term outcomes for HNC patients – it disentangles other causes of death, which are
overestimated in overall survival and underestimated in disease-specific survival.
3
Introduction
Head and neck cancer (HNC) accounted for more than 650,000 new cases and over 350,000 deaths
worldwide in 2012; and collectively HNC was the sixth most common cancer globally(1). There has
been an increase in the incidence of HNC in Scotland over the last three decades(2) and in 2015,
Scotland experienced 1,283new cases of head and neck cancer(3). Survival for HNC patients in
Scotland remains poor with little improvement since the 1980’s(4), and over the last ten years,
mortality rates in Scotland due to HNC have increased by 12% for men and 22% for women(5).
The influences on overall and disease-specific survival are well described for HNC patients – the determinants of short-term survival include age, stage, sex, socioeconomic status, smoking
behaviour, alcohol consumption, comorbidities(6-9), and, in recent years, human papillomavirus (HPV)
status which confers a survival advantage(10, 11). Disease recurrence is most likely to occur within the
first three years, and national guidelines recommend follow-up for five-years after a HNC diagnosis,
with the aim of detecting early disease recurrence and second primary HNC(12). Few studies focus on
the long-term outcomes of HNC patients(13, 14), and even less common is the use of net survival in the
examination of HNC patient survival(15, 16).
Overall survival considers the risk of death by all causes, whereas disease-specific survival methods only consider deaths by the disease of interest and ignores other causes deaths that may have been related to or occurred as a secondary effect to the disease of interest(17). Net survival is defined as
the excess mortality between the observed mortality of the patients under study and the expected mortality of the population – this provides a more accurate representation of the mortality from a particular disease of interest by disentangling other causes of death, and therefore only measuring causes of death that are related to the disease of interest via the use of excess mortality(18, 19).
The Scottish Audit of Head and Neck Cancer (SAHNC) is a population-based cohort which provides a unique opportunity to explore a wide range of factors in association with the long-term survival of
4
HNC patients. This study aims to investigate HNC survival via the use of overall survival, disease-specific survival and net survival analyses together to provide an in-depth and comprehensive picture of the survival of HNC patients. The secondary aim of this paper is to compare different survival methods to assess the association of patient, tumour and treatment factors with survival.
5
Materials and Methods
PatientsThe SAHNC cohort recruited patients between 1st September 1999 and 31st August 2001 – methods
have previously been described(20-23). During this two-year period, data were recorded on new HNC
patients diagnosed in Scotland. Quality assurance processes were carried out including cross-checking the data with medical and pathology results.
Data Linkage and approvals
The SAHNC cohort was linked to the National Records of Scotland (NRS) mortality data as at 30th
September 2013 by ISD Scotland. Records were linked using an established probability matching
technique based on the Howard Newcombe principle(24) which matches individual patients to their
national Community Health Index (CHI) number – the unique healthcare identifier used in the National Health Service (NHS) in Scotland. Information governance and data linkage approvals were obtained from the NHS Privacy Advisory Committee (now known as the Public Benefits and Privacy Panel).
Variables included in analysis
Patient (age at diagnosis, sex, socioeconomic status (SES), smoking behaviour, alcohol consumption, patient performance status), tumour (stage, anatomical site) and treatment (treatment modality, geographic location of treatment) factors were all collected at baseline. SES was determined using
area-based Carstairs Quintiles(25, 26) which ranks patients’ home postcodes into five categories using
2001 Census socioeconomic data – group 1 represents the most affluent areas and group 5 represents the most deprived areas. Smoking behaviour (‘current smoker’, ‘previous smoker’ and ‘never smoked’), and alcohol consumption (‘current problem drinker’, ‘previous problem drinker’ or ‘occasionally/never drinks’) were determined at the time of diagnosis and no further data were
6
collected on the patient’s habits following diagnosis. Patient performance status was classified at
diagnosis using the World Health Organisation (WHO) Performance Status (27), which groups patients
into one of five categories based on their level of physical ability (‘normal activity’, ‘strenuous activity restricted’, ‘up and about for more than 50% of waking hours’, ‘confined to a bed or chair for more than 50% of waking hours’, and ‘confined to a bed or chair for 100% of waking hours’). Stage was determined using the Tumour, Node and Metastases (TNM) Classification of Malignant Tumours
(28), and the cohort was grouped into stage I, II, III or IV. Anatomical site was classified using the
International Classification of Disease version 10 (29), grouped into seven categories – lip (C00.9),
larynx (C32), nasal cavity (C11.9, C30.0, C31), oral cavity (C02–C04, C05.0, C06, C14), oropharynx (C01, C05.1–, C09, C10), hypopharynx (C12, C13), and other or salivary gland (C07, C08, C30.1, C41,
C44, C76, C77).Treatment modality was grouped into seven categories: i) surgery only; ii)
radiotherapy only; iii) surgery combined with radiotherapy; iv) Surgery, radiotherapy and
chemotherapy; v) radiotherapy and chemotherapy; vi) chemotherapy with or without surgery; and vii) no treatment. Location of treatment was based on the service delivered in the Scottish Cancer Networks located in three geographic region – West of Scotland Network (WoSCAN) (which comprises health board areas of Ayrshire and Arran, Forth Valley, Greater Glasgow, Clyde and Lanarkshire); South East Scotland Cancer Network (SCAN) (Borders, Dumfries and Galloway, Fife, Lothian); and North of Scotland Cancer Network (NOSCAN) (Grampian, Highland, Orkney, Shetland, Tayside, Western Isles).
Statistical methods
Overall and disease-specific survival were calculated using the Kaplan-Meier method with 95% confidence intervals (CI’s). Disease-specific survival was computed using death certificates where the primary cause of death was recorded as a type of HNC using ICD10 codes. Forward stepwise
mutually adjusted multivariate Cox proportional hazards models were used to determine the variables with an independent association with overall and disease-specific survival – age at
7
diagnosis, cancer stage and treatment modality were forced into the model in the first instance due to their strong association with overall and disease-specific survival during unadjusted models (data not shown). As a precaution, the results were checked using a backwards stepwise routine, and we also performed sensitivity analyses by removing patients with oropharynx cancer or who did not receive any treatment. Since this was a large study, many of the p-values were very small and therefore, chi-square results have been added to the analysis as a simple way of visually ranking the importance of each determinant. All overall survival, disease-specific survival results and Cox proportional hazards models were calculated using SAS Software, version 9.4 (SAS Institute Inc.,
USA). Net survival with 95% CIs was calculated by the Pohar-Perme method(30, 31) using life-tables
provided by the Cancer Survival Group at the London School of Tropical Hygiene and Medicine(32).
These life-tables were standardised by age, sex and Carstairs 2001 quintile, and were computed using the stns command in Stata 14(33, 34).
8
Results
Cohort recruitment
The SAHNC cohort recruited 77% (n = 1,910) of HNC cases that were diagnosed and recorded in the
Scottish Cancer Registry over the study period from 1st September 1999 to 31st August 2001. Of the
1,910 patients in the baseline cohort, 1,895 were linked to 12-year mortality records – 15 patients were excluded as they were unable to be matched to CHI numbers for data linkage follow-up. A further 15 patients were excluded as they were unable to be matched to 2001 Carstairs quintiles and 60 patients over the age of 85 were also excluded (requirements for the successful computation of net survival), which left a remaining total of 1,820 patients included in the analyses. Cause of death information was available for all patients from death certificates for disease-specific survival.
Patient demographics
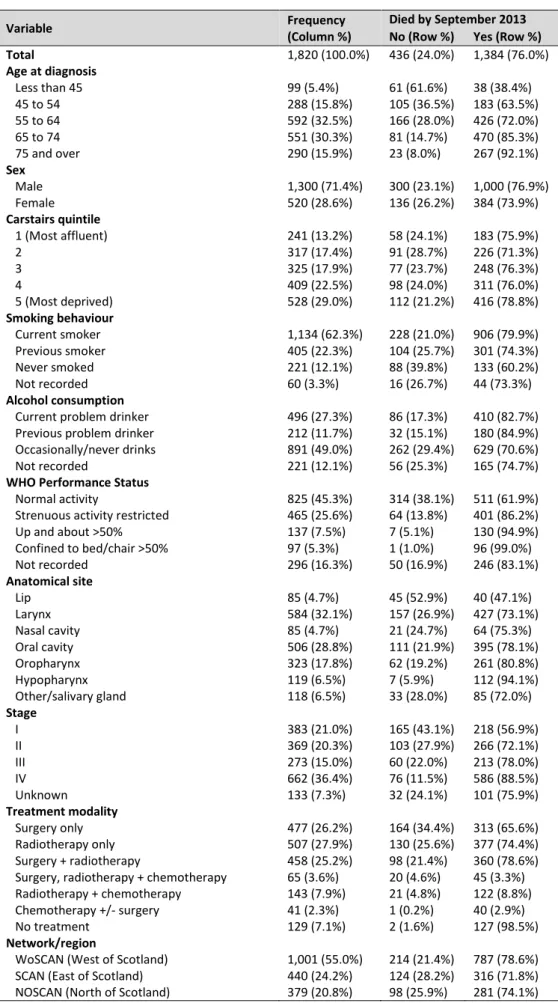
Table 1 outlines the demographic characteristics of the 1,820 patients that were followed up. The age at diagnosis ranged from 13 to 85 with a median age of 63 years, and there was a ratio of 2.5:1 of males to females. The majority of patients were from Carstairs quintiles 4 and 5 areas which accounted for more than half of the cohort. Current or previous smoking was reported in 84.6% of patients, and 39.0% of patients reported that they were current problem or previous problem drinkers. The most common anatomical site was the larynx, followed by the oral cavity, and 79.3% of patients were treated by either 'surgery only', 'radiotherapy only' or 'surgery and radiotherapy'. 55.0% of patients were treated in the West of Scotland, and a total of 1,384 (76.0%) of patients had died by September 2013.
Comparison of overall, disease-specific and net survival results
Overall, disease-specific and net survival proportions at one and 12-years for each of the patient, tumour and treatment factors are displayed in Table 2. Overall survival at one and 12-years was
9
76.0% (74.0%, 77.9%) and 26.3% (24.3%, 28.3%), respectively. Disease-specific survival at one- and 12-years was 82.3% (80.4%, 84.0%) and 56.9% (54.3%, 59.4%), respectively. Net survival at one- and 12-years was 78.3% (76.2%, 80.3%) and 41.4% (37.6%, 45.1%), respectively. One year after follow-up, males and females had approximately the same survival for all three measurements of survival; however, by 12-years males consistently had the lowest survival. At one year, there were clear gradients in survival by SES with the patients from the most affluent areas experiencing the highest survival for overall (83.4%, (78.1%, 87.5%)), disease-specific (88.0%, (83.9%, 92.2%)) and net (86.1%, (81.3%, 91.0%)) survival. By 12-years, these gradients were not as clear cut, however differences between those from the most affluent and the most deprived areas continued to exist, with patients from the most deprived areas having the lowest survival outcomes for overall, disease-specific and net survival than any other quintile. Patients who had never smoked had a survival advantage compared to the patients who were either current or previous smokers when using the overall, disease-specific and net survival methods, particularly by 12-years for patients who had never smoked with a net survival estimate of 70.6% (57.1%, 84.1%) compared with 32.4% (28.6%, 36.2%) for current smokers. Current and previous problem drinkers had approximately the same survival throughout all three methods of survival, which was substantially higher by 12-years for current problem drinkers using the disease-specific method (45.9% (40.5%, 51.1%)) compared to using the overall (18.2%, 95% CIs 14.9%, 21.7%) and net (23.5% (18.6%, 28.4%) survival methods. Those with normal activity levels had higher survival than patients who did not have normal activity levels using all three methods of survival. One year after diagnosis, patients with tumours of the lip experienced the highest overall (94.1%, 95% CIs 86.4, 97.5%), disease-specific (97.6%, (90.8%, 99.4%)) and net (97.7%, (92.4%, 100.3%)) survival, however this reduced substantially to 56.5% (45.3%, 66.2%) at 12-years using the overall survival method, but did not reduce significantly using the disease-specific or net survival methods, suggesting these patients are dying of other causes. Clear trends can be seen by stage for all three survival methods with those of stage I experiencing the highest survival. Patients who were treated with surgery alone experienced the highest overall, disease-specific and
10
net survival results, whereas patients who were treated in the West of Scotland network region generally had the lowest results. There were clear differences between overall, disease-specific and net survival results, with the disease-specific method presenting the highest outcome, followed by the net survival method and, as expected, the overall survival method displayed the lowest results.
Mutually adjusted Cox proportional hazards models for overall and disease-specific survival
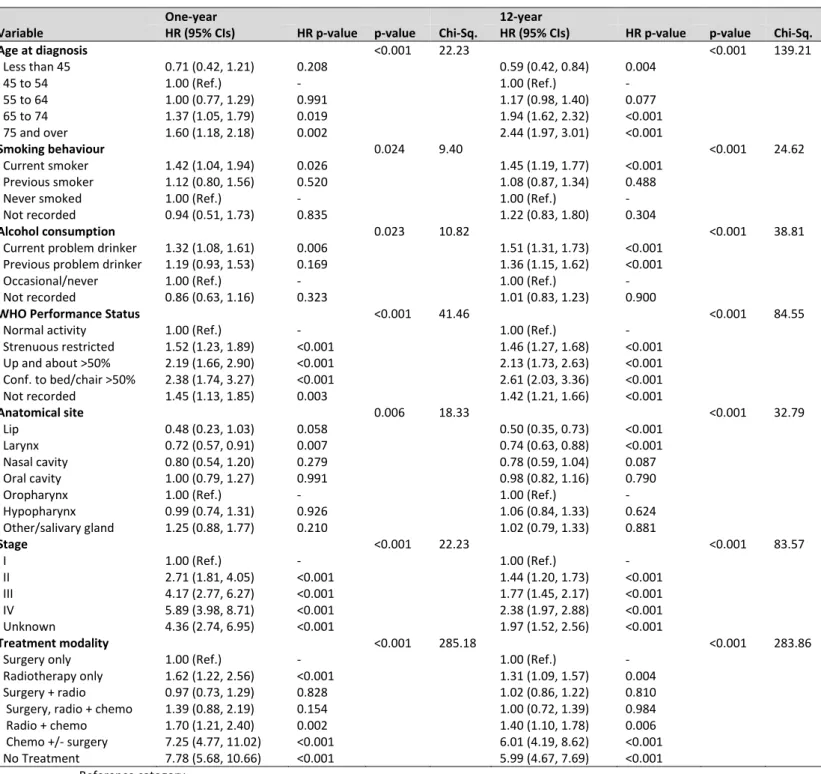
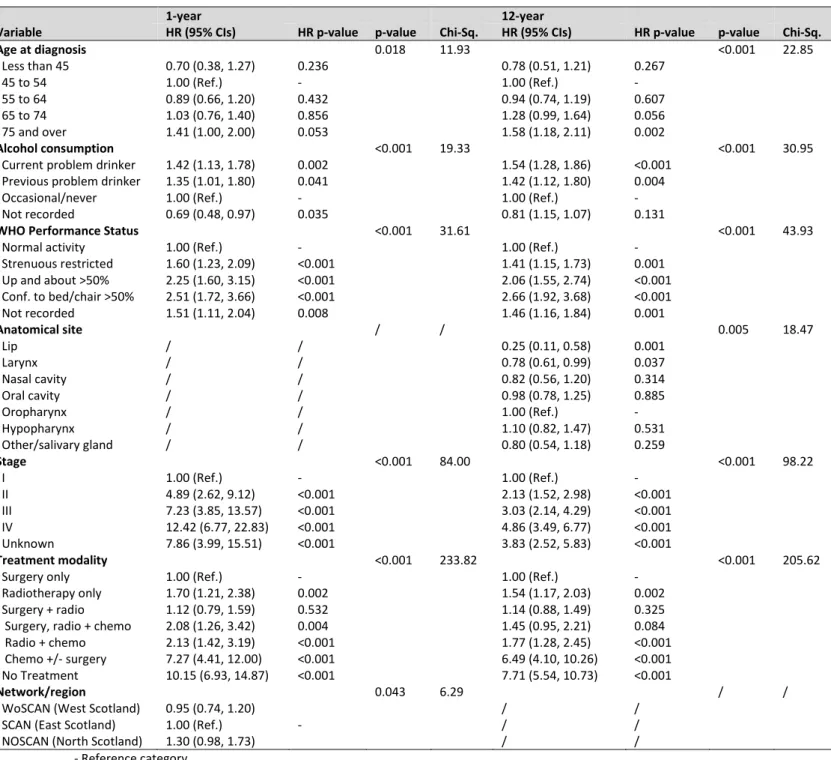
Mutually adjusted Cox proportional hazards models are displayed in Table 3 using the overall survival method, and Table 4 using the disease-specific survival method. In the order of which they were entered into the model, the determinants with an independent association with overall survival at both one and 12-years included age at diagnosis, cancer stage, treatment modality, WHO Performance Status, alcohol consumption, anatomical site and smoking status. Results for the mutually adjusted Cox proportional hazards models using disease-specific survival varied slightly – the determinants associated with disease-specific survival at one year included age at diagnosis, cancer stage, treatment modality, WHO Performance Status, network and alcohol consumption; however the determinants associated with 12-years disease-specific survival included age at diagnosis, cancer stage, treatment modality, WHO Performance status, alcohol consumption and anatomical site – interestingly, smoking was not an independent predictor for disease-specific survival at either time points. These results were also obtained when running a backwards
elimination method, and similar models were achieved when patients with oropharynx cancer and patients who did not receive treatment were removed (Supplementary Tables 1 and 2).
Discussion
Overall survival at one- and 12-years was 76.0% (74.0%, 77.9%) and 26.3% (24.3%, 28.3%),
respectively, while disease-specific survival was higher at both one- and 12-years at 82.3% (80.4%, 84.0%) and 56.9% (54.3%, 59.4%), respectively. Net survival estimates for one- and 12-years were 78.3% (76.2%, 80.3%) and 41.4% (37.6%, 45.1%), respectively. Following mutual adjustment, overall
11
survival of HNC patients was associated with age at diagnosis, cancer stage, treatment modality, WHO Performance Status, alcohol consumption, anatomical site and smoking status, and disease-specific survival was associated with age at diagnosis, cancer stage, treatment modality, WHO Performance Status, and alcohol consumption, with the addition of network at one-year and anatomical site by 12 years.
The association of stage reflects disease-specific deaths, whereas WHO performance status may be a representation of comorbidities in the cohort of patients, which have been described to have a
negative impact on the survival of HNC patients(35). Similarly, associations with smoking and alcohol
behaviours are common risk factors for HNC, and patients often present with many significant comorbidities including chronic obstructive pulmonary disease, heart disease, liver disease and
secondary cancers(36). The strong association of treatment is likely to reflect those who received
palliative care – particularly due to the inclusion of the patients who received 'no treatment', however sensitivity analyses excluding the patients who received no treatment generated similar results (Supplementary Table 1). The variance in survival of patients by anatomical site may be influenced by the inclusion of patients with cancer of the lip, who consistently had substantially improved survival compared with patients with cancers of other HNC sites.
There was a substantial difference between overall survival, disease-specific survival and net survival estimates in this study. Overall survival overestimates deaths as a result of HNC since all causes of death are considered in this measurement, whereas disease-specific survival may be an unreliable estimate when using death certificates as exact causes of death are often unclear. The difference between overall and disease-specific results suggest that patients are dying of other HNC-related causes, but these causes are not as a direct result of HNC and are therefore not documented on death certificates. Net survival estimates background mortality using a group of patients with the same demographics as the patient in the study and calculates the excess death that has occurred as a result of the disease of interest. There is no need to use death certificates to compute this
12
measurement and thus there is little inaccuracy as to the cause of death in the patient. Therefore, we feel that the use of net survival provides a good compromise to traditional methods, particularly in long-term studies, to estimate the true burden of HNC-specific deaths.
Over the last two decades, there has been an increase in the incidence of HNCs that are associated
with HPV(2, 37, 38). This is particularly common for patients with cancer of the oropharynx for whom
around one to two thirds of tumours may be HPV-driven(39), suggesting that one limitation of this
study is the absence of HPV data. Patients with HPV-positive tumours have considerably better prognoses than patients with HPV-negative tumours, even following adjustment for other baseline
covariates(40, 41). The primary focus of these analyses was to investigate the long-term survival of HNC
patients from Scotland diagnosed between the years of 1999 and 2001. The baseline data collection
for this study was ahead of the mainstream discovery of the association of HPV with HNC(42) and
therefore HPV data were not routinely collected or available in this study. However, aside from oropharynx patients, the majority of HNC diagnosed today are HPV-negative and these tumours are likely to be smoking- and alcohol-related(43, 44), and previous studies suggest that smoking, alcohol,
and HPV are three independent risk factors of HNC survival(45, 46). Furthermore, the oropharyngeal
patients in this study did not exhibit the clear survival advantage that is usually observed for
HPV-associated oropharyngeal cancer(41). Sensitivity analyses involving the exclusion of patients with
oropharynx cancer demonstrated similar results (Supplementary Table 2), however, we were unable to separate out patients with HPV positive tumour. Therefore, the SAHNC patients’ cancers are likely to be predominantly related to smoking and problem alcohol behaviours and we propose that our findings remain relevant to clinicians, researchers and other health professionals in gaining an understanding of the long-term prognosis of patients with non-HPV driven HNC, particularly since the prevalence of smoking and problem alcohol consumption was very high in this study.
The SAHNC cohort also pre-dates the use of organ preservation strategies that were introduced in
13
importance of ensuring clear margins in surgery in the treatment of HNC(48, 49). Therefore, due to the
high proportion of patients being treated with surgery in the SAHNC cohort, this study also remains relevant and may be used in treatment planning decisions for HNC patients. Moreover, these analyses were based on historical cases (1999 to 2001), which is a prerequisite for estimating long-term follow-up, which we would argue is a strength of the SAHNC cohort.
The SAHNC cohort represented 77% of all HNC cases on the Scottish Cancer Registry over a two-year period and was representative of HNC cases in Scotland. Previous analyses of the SAHNC cohort have outlined five-year overall and disease-specific survival(20-23). This study adds to the worldwide
literature on long-term HNC survival, and provides an in-depth analysis of overall, disease-specific and net survival of HNC patients using a national clinical cohort. This study also supports the use of net survival, particularly in analyses with long-term follow-up.
Conclusion
Overall survival at one- and 12-years was 76.0% (74.0%, 77.9%) and 26.3% (24.3%, 28.3%),
respectively, while disease-specific survival was higher at both one- and 12-years at 82.3% (80.4%, 84.0%) and 56.9% (54.3%, 59.4%), respectively. Following mutual adjustment, overall and disease-specific survival for HNC patients was associated with age at diagnosis, cancer stage, treatment modality, WHO Performance Status, alcohol consumption, anatomical site, smoking status and cancer network. Net survival estimates for one- and 12-years were 78.3% (76.2%, 80.3%) and 41.4% (37.6%, 45.1%), respectively. The substantial difference between overall survival, disease-specific survival and net survival demonstrates the overestimation of HNC-specific deaths when using overall survival, and the underestimation of disease-specific mortality when using death certificates where patients have died only from HNC. These results suggest that patients are dying of other causes that are related to their HNC but are not as a direct result of HNC. Therefore, the use of net survival seems to provide a good compromise to traditional methods to estimate the true burden of HNC in long-term follow-up studies.
14
Conflict of interest statement
15
References
1. Ferlay JS, I; Ervik, M; Dikshit, R; et al., F. GLOBOCAN 2012 v1.0, Cancer Incidence and Mortality Worldwide: IARC CancerBase No. 11. In. Lyon, France: International Agency for Research on Cancer; 2013.
2. Purkayastha M, McMahon AD, Gibson J, Conway DI. Trends of oral cavity, oropharyngeal and laryngeal cancer incidence in Scotland (1975-2012) - A socioeconomic perspective. Oral Oncol 2016;61:70-5.
3. ISD Scotland. Cancer in Scotland Summary. In: Information Services Division NNSS, editor. ISD Scotland. Scotland: Information Services Division, NHS National Services Scotland; 2014.
4. ISD Scotland. Latest Publications from ISD Scotland. In: Information Services Division NNSS, editor. Scotland: Information Services Division, NHS National Services Scotland; 2015.
5. Scotland IN. Cancer Mortality in Scotland (2016). 2017.
6. Ramroth H, Schoeps A, Rudolph E, et al. Factors predicting survival after diagnosis of laryngeal cancer. Oral Oncol 2011;47(12):1154-1158.
7. Faye-Lund H, Abdelnoor M. Prognostic factors of survival in a cohort of head and neck cancer patients in Oslo. European journal of cancer Part B, Oral oncology 1996;32B(2):83-90.
8. Paterson IC, John G, Adams Jones D. Effect of deprivation on survival of patients with head and neck cancer: a study of 20,131 cases. Clin Oncol (R Coll Radiol) 2002;14(6):455-8.
9. Smith EM, Rubenstein LM, Haugen TH, Pawlita M, Turek LP. Complex etiology underlies risk and survival in head and neck cancer human papillomavirus, tobacco, and alcohol: a case for multifactor disease. J Oncol 2012;2012:571862.
10. Evans M, Newcombe R, Fiander A, et al. Human Papillomavirus-associated oropharyngeal cancer: an observational study of diagnosis, prevalence and prognosis in a UK population. Bmc Cancer 2013;13:10.
11. Smith EM, Pawlita M, Rubenstein LM, Haugen TH, Hamsikova E, Turek LP. Risk factors and survival by HPV-16 E6 and E7 antibody status in human papillomavirus positive head and neck cancer. Int J Cancer 2010;127(1):111-117.
12. Fuller CD, Wang SJ, Thomas CR, Hoffman HT, Weber RS, Rosenthal DI. Conditional survival in head and neck squamous cell carcinoma - Results from the SEER dataset 1973-1998. Cancer 2007;109(7):1331-1343.
13. Tiwana MS, Wu J, Hay J, Wong F, Cheung W, Olson RA. 25 Year survival outcomes for squamous cell carcinomas of the head and neck: Population-based outcomes from a Canadian province. Oral Oncol 2014;50(7):651-656.
14. Peng KA, Grogan T, Wang MB. Head and Neck Sarcomas: Analysis of the SEER Database. Otolaryngology-Head and Neck Surgery 2014;151(4):627-633.
15. van der Schroeff MP, van de Schans SA, Piccirillo JF, Langeveld TP, Baatenburg de Jong RJ, Janssen-Heijnen ML. Conditional relative survival in head and neck squamous cell carcinoma: Permanent excess mortality risk for long-term survivors. Head Neck 2010;32(12):1613-8.
16. Guizard AV, Uhry Z, de Raucourt D, Mazzoleni G, Sanchez MJ, Ligier K. Trends in net survival from head and neck cancer in six European Latin countries: results from the SUDCAN population-based study. Eur J Cancer Prev 2017;26
17. dos Santos Silva I. Cancer Epidemiology: Principles and Methods. Lyon, France: International Agency for Research on Cancer; 1999. 441 p.
18. Schaffar R, Rachet B, Belot A, Woods LM. Estimation of net survival for cancer patients: Relative survival setting more robust to some assumption violations than cause-specific setting, a sensitivity analysis on empirical data. Eur J Cancer 2017;72:78-83.
19. Roche L, Danieli C, Belot A, et al. Cancer net survival on registry data: use of the new unbiased Pohar-Perme estimator and magnitude of the bias with the classical methods. Int J Cancer
16
20. MacKenzie K, Savage SAH, Birchall MA. Processes and outcomes of head and neck cancer patients from geographically disparate regions of the UK. A comparison of Scottish and English cohorts. Ejso 2009;35(10):1113-1118.
21. McMahon JD, Robertson GAJ, Liew C, et al. Oral and oropharyngeal cancer in the West of Scotland-long-term outcome data of a prospective audit 1999-2001. Br J Oral Maxillofac Surg 2011;49(2):92-98.
22. O'Hara J, MacKenzie K. Surgical versus non-surgical management of early stage oropharyngeal squamous cell carcinoma. Eur Arch Otorhinolaryngol 2011;268(3):437-442.
23. Robertson G, Greenlaw N, Bray CA, Morrison DS, Steering Grp Comm Scottish Audit H. Explaining the effects of socio-economic deprivation on survival in a national prospective cohort study of 1909 patients with head and neck cancers. Cancer Epidemiol 2010;34(6):682-688.
24. Newcombe HB, Kennedy JM, Axford SJ, James AP. Automatic Linkage of Vital Records. Science 1959;130(3381):954-959.
25. Carstairs V, Morris R. Deprivation, mortality and resource-allocation. Community Medicine 1989;11(4):364-372.
26. McLoone P. Carstairs Scores for the Scottish Postcode Sectors from the 1991 Census; 2000. 27. Oken MM, Creech RH, Tormey DC, et al. Toxicity and response criteria of the eastern-cooperative-oncology-group. Am J Clin Oncol 1982;5(6):649-655.
28. Wittekind C, Asamura H, Sobin LH. TNM Atlas. Sixth ed: Wiley-Blackwell; 2014.
29. Karjalainen A. International statistical classification of diseases and related health problems (icd-10) in occupational health. In. Geneva: World Health Organisation; 1999. p. 42.
30. Perme MP, Stare J, Esteve J. On estimation in relative survival. Biometrics 2012;68(1):113-20. 31. Pohar Perme M, Esteve J, Rachet B. Analysing population-based cancer survival - settling the controversies. BMC Cancer 2016;16(1):933.
32. London School of Tropical Hygiene and Medicine, Cancer Survival Group. 2018. UK Life Tables.
[ONLINE] Available at: http://csg.lshtm.ac.uk/tools-analysis/uk-life-tables/. [Accessed 1st Novemebr
2018]
33. StataCorp. Stata Statistical Software: Release 14. College Station, TX 2015;StataCorp LLC. 34. Clerc-Urmes I, Grzebyk M, Hedelin G. Net survival estimation with stns. The Stata Journal 2014;14(1):87-102.
35. Piccirillo JF. Importance of comorbidity in head and neck cancer. Laryngoscope 2000;110(4):593-602.
36. Boje CR, Dalton SO, Gronborg TK, et al. The impact of comorbidity on outcome in 12 623 Danish Head and Neck Cancer Patients: A population based study from the DAHANCA database. Acta Oncologica 2013;52(2):285-293.
37. Junor EJ, Kerr GR, Brewster DH. Oropharyngeal cancer. Fastest increasing cancer in Scotland, especially in men. BMJ 2010;340:c2512.
38. Chaturvedi AK, Anderson WF, Lortet-Tieulent J, et al. Worldwide trends in incidence rates for oral cavity and oropharyngeal cancers. J Clinical Oncol 2013;31(36):4550-9.
39. Kreimer AR, Clifford GM, Boyle P, Franceschi S. Human papillomavirus types in head and neck squamous cell carcinomas worldwide: A systematic review. Cancer Epidemiol Biomarkers Prev 2005;14(2):467-475.
40. Ragin CCR, Taioli E. Survival of squamous cell carcinoma of the head and neck in relation to human papillomavirus infection: Review and meta-analysis. Int J Cancer 2007;121(8):1813-1820. 41. Wang MB, Liu IY, Gornbein JA, Nguyen CT. HPV-Positive Oropharyngeal Carcinoma: A Systematic Review of Treatment and Prognosis. Otolaryngol Head Neck Surg 2015;153(5):758-769.
42. D'Souza G, Kreimer AR, Viscidi R, et al. Case-control study of human papillomavirus and oropharyngeal cancer. N Engl J M 2007;356(19):1944-56.
43. Herrero R, Castellsague X, Pawlita M, et al. Human papillomavirus and oral cancer: the
International Agency for Research on Cancer multicenter study. J Natl Cancer Inst 2003;95(23):1772-83.
17
44. Hashibe M, Brennan P, Chuang SC, et al. Interaction between tobacco and alcohol use and the risk of head and neck cancer: pooled analysis in the International Head and Neck Cancer
Epidemiology Consortium. Cancer Epidemiol Biomarkers Prev 2009;18(2):541-50.
45. Smith EM, Rubenstein LM, Haugen TH, Pawlita M, Turek LP. Complex etiology underlies risk and survival in head and neck cancer human papillomavirus, tobacco, and alcohol: a case for multifactor disease. Journal of oncology 2012;2012:571862.
46. Gillison ML, D'Souza G, Westra W, et al. Distinct risk factor profiles for human papillomavirus type 16-positive and human papillomavirus type 16-negative head and neck cancers. J Natl Cancer Inst 2008;100(6):407-20.
47. Scottish Intercollegiate Guidelines Network In Edinburgh: Healthcare Improvement Scotland; 2001-2014.
48. Gourin CG, Johnson JT. A Contemporary Review of Indications for Primary Surgical Care of Patients With Squamous Cell Carcinoma of the Head and Neck. Laryngoscope 2009;119(11):2124-2134.
49. Hormann K, Sadick H. Role of surgery in the management of head and neck cancer: a
contemporary view of the data in the era of organ preservation. J Laryngol Otol 2013;127(2):121-127.
18
Table 1 – Frequency of all patient, tumour and treatment characteristics and frequency of deaths for all cases
Variable Frequency
(Column %)
Died by September 2013
No (Row %) Yes (Row %)
Total 1,820 (100.0%) 436 (24.0%) 1,384 (76.0%) Age at diagnosis Less than 45 99 (5.4%) 61 (61.6%) 38 (38.4%) 45 to 54 288 (15.8%) 105 (36.5%) 183 (63.5%) 55 to 64 592 (32.5%) 166 (28.0%) 426 (72.0%) 65 to 74 551 (30.3%) 81 (14.7%) 470 (85.3%) 75 and over 290 (15.9%) 23 (8.0%) 267 (92.1%) Sex Male 1,300 (71.4%) 300 (23.1%) 1,000 (76.9%) Female 520 (28.6%) 136 (26.2%) 384 (73.9%) Carstairs quintile 1 (Most affluent) 241 (13.2%) 58 (24.1%) 183 (75.9%) 2 317 (17.4%) 91 (28.7%) 226 (71.3%) 3 325 (17.9%) 77 (23.7%) 248 (76.3%) 4 409 (22.5%) 98 (24.0%) 311 (76.0%) 5 (Most deprived) 528 (29.0%) 112 (21.2%) 416 (78.8%) Smoking behaviour Current smoker 1,134 (62.3%) 228 (21.0%) 906 (79.9%) Previous smoker 405 (22.3%) 104 (25.7%) 301 (74.3%) Never smoked 221 (12.1%) 88 (39.8%) 133 (60.2%) Not recorded 60 (3.3%) 16 (26.7%) 44 (73.3%) Alcohol consumption
Current problem drinker 496 (27.3%) 86 (17.3%) 410 (82.7%)
Previous problem drinker 212 (11.7%) 32 (15.1%) 180 (84.9%)
Occasionally/never drinks 891 (49.0%) 262 (29.4%) 629 (70.6%)
Not recorded 221 (12.1%) 56 (25.3%) 165 (74.7%)
WHO Performance Status
Normal activity 825 (45.3%) 314 (38.1%) 511 (61.9%)
Strenuous activity restricted 465 (25.6%) 64 (13.8%) 401 (86.2%)
Up and about >50% 137 (7.5%) 7 (5.1%) 130 (94.9%) Confined to bed/chair >50% 97 (5.3%) 1 (1.0%) 96 (99.0%) Not recorded 296 (16.3%) 50 (16.9%) 246 (83.1%) Anatomical site Lip 85 (4.7%) 45 (52.9%) 40 (47.1%) Larynx 584 (32.1%) 157 (26.9%) 427 (73.1%) Nasal cavity 85 (4.7%) 21 (24.7%) 64 (75.3%) Oral cavity 506 (28.8%) 111 (21.9%) 395 (78.1%) Oropharynx 323 (17.8%) 62 (19.2%) 261 (80.8%) Hypopharynx 119 (6.5%) 7 (5.9%) 112 (94.1%) Other/salivary gland 118 (6.5%) 33 (28.0%) 85 (72.0%) Stage I 383 (21.0%) 165 (43.1%) 218 (56.9%) II 369 (20.3%) 103 (27.9%) 266 (72.1%) III 273 (15.0%) 60 (22.0%) 213 (78.0%) IV 662 (36.4%) 76 (11.5%) 586 (88.5%) Unknown 133 (7.3%) 32 (24.1%) 101 (75.9%) Treatment modality Surgery only 477 (26.2%) 164 (34.4%) 313 (65.6%) Radiotherapy only 507 (27.9%) 130 (25.6%) 377 (74.4%) Surgery + radiotherapy 458 (25.2%) 98 (21.4%) 360 (78.6%)
Surgery, radiotherapy + chemotherapy 65 (3.6%) 20 (4.6%) 45 (3.3%)
Radiotherapy + chemotherapy 143 (7.9%) 21 (4.8%) 122 (8.8%)
Chemotherapy +/- surgery 41 (2.3%) 1 (0.2%) 40 (2.9%)
No treatment 129 (7.1%) 2 (1.6%) 127 (98.5%)
Network/region
WoSCAN (West of Scotland) 1,001 (55.0%) 214 (21.4%) 787 (78.6%)
SCAN (East of Scotland) 440 (24.2%) 124 (28.2%) 316 (71.8%)
19
Table 2 – One- and 12-year overall, net and disease-specific survival for all patient, tumour and treatment factors
Overall Disease-specific Net
Variable 1-year 12-years 1-year 12-year 1-year 12-year
Whole cohort 76.0 (74.0, 77.9) 26.3 (24.3, 28.3) 82.3 (80.4, 84.0) 56.9 (54.3, 59.4) 78.3 (76.2, 80.3) 41.4 (37.6, 45.1) Age at diagnosis Less than 45 90.9 (83.3, 95.2) 62.6 (52.3, 71.3) 94.8 (88.0, 97.8) 72.1 (61.7, 80.1) 91.1 (85.5, 96.8) 64.9 (55.0, 74.7) 45 to 54 83.7 (78.9, 87.5) 37.5 (31.9, 43.0) 86.5 (81.9, 90.0) 60.2 (53.8, 66.0) 84.2 (80.0, 88.6) 42.2 (35.9, 48.5) 55 to 64 78.4 (74.8, 81.5) 30.2 (26.6, 34.0) 83.1 (79.7, 85.9) 60.0 (55.5, 64.2) 79.6 (76.2, 83.0) 38.8 (34.0, 43.7) 65 to 74 73.1 (69.2, 76.6) 18.0 (14.9, 21.3) 81.7 (78.1, 84.8) 54.2 (49.1, 59.1) 75.9 (72.1, 79.8) 35.8 (29.5, 42.2) 75 and over 64.1 (58.3, 69.4) 10.3 (7.2, 14.2) 72.9 (67.2, 77.8) 45.3 (37.9, 52.4) 69.1 (63.2, 75.0) 43.2 (28.0, 58.4) Sex Male 76.2 (73.7, 78.4) 24.9 (22.6, 27.3) 82.0 (79.8, 84.1) 55.3 (52.2, 58.3) 78.5 (76.1, 80.9) 40.5 (36.2, 44.8) Female 75.8 (71.9, 79.2) 29.6 (25.8, 33.6) 82.8 (79.2, 85.9) 60.9 (56.0, 65.5) 77.6 (73.8, 81.4) 43.0 (36.1, 49.8) Carstairs quintile 1 (Most affluent) 83.4 (78.1, 87.5) 27.0 (21.5, 32.7) 88.8 (83.9, 92.2) 61.8 (54.4, 68.4) 86.1 (81.3, 91.0) 40.4 (30.7, 50.0) 2 78.6 (73.6, 82.7) 30.6 (25.6, 35.7) 83.2 (78.5, 86.9) 65.6 (59.6, 70.9) 80.9 (76.2, 85.5) 43.8 (35.0, 52.6) 3 76.3 (71.3, 80.6) 26.2 (21.5, 31.0) 82.2 (77.5, 86.1) 55.5 (49.2, 61.3) 78.6 (73.8, 83.3) 40.7 (31.5, 49.9) 4 75.1 (70.6, 79.0) 26.9 (22.7, 31.3) 81.8 (77.5, 85.3) 55.5 (49.9, 60.8) 77.2 (72.8, 81.5) 46.6 (38.4, 54.7) 5 (Most deprived) 71.8 (67.8, 75.4) 22.9 (19.4, 26.5) 79.1 (75.2, 82.4) 51.1 (46.0, 55.9) 73.7 (69.7, 77.6) 35.7 (29.6, 41.8) Smoking behaviour Current smoker 72.8 (70.1, 75.2) 22.3 (19.9, 24.8) 79.0 (76.4, 81.3) 53.2 (49.9, 56.5) 74.6 (71.9, 77.2) 32.4 (28.6, 36.2) Previous smoker 80.3 (76.0, 83.8) 27.4 (23.2, 31.8) 87.0 (83.2, 90.0) 59.8 (54.1, 65.0) 83.3 (79.2, 87.3) 49.9 (40.5, 59.2) Never smoked 85.5 (80.2, 89.5) 43.9 (37.3, 50.3) 89.3 (84.4, 92.8) 66.9 (59.8, 73.0) 87.9 (83.1, 92.7) 70.6 (57.1, 84.1) Not recorded 75.0 (62.0, 84.1) 28.3 (17.6, 40.0) 86.0 (73.9, 92.7) 67.3 (51.2, 79.1) 77.6 (66.2, 88.9) 40.3 (22.2, 58.5) Alcohol consumption
Current problem drinker 70.8 (66.6, 74.6) 18.2 (14.9, 21.7) 77.8 (73.7, 81.3) 45.9 (40.5, 51.1) 72.4 (68.3, 76.5) 23.5 (18.6, 28.4) Previous problem drinker 72.2 (65.6, 77.7) 17.0 (12.3, 22.3) 76.6 (70.2, 81.8) 49.7 (42.1, 56.9) 74.0 (67.9, 80.2) 23.4 (15.9, 30.9)
Occasional/never 79.2 (76.4, 81.8) 32.3 (29.3, 35.4) 85.0 (82.4, 87.2) 62.1 (58.5, 65.5) 81.7 (78.9, 84.4) 54.1 (48.0, 60.1)
Not recorded 78.7 (72.7, 83.6) 29.0 (23.1, 35.0) 86.7 (81.2, 90.6) 65.4 (57.6, 72.1) 81.3 (75.7, 86.9) 43.9 (33.8, 54.0)
WHO Performance Status
Normal activity 88.1 (85.7, 90.2) 40.6 (37.2, 43.9) 91.9 (89.8, 92.6) 70.4 (66.8, 73.7) 90.2 (88.0, 92.5) 59.0 (53.5, 64.9) Strenuous restricted 72.3 (68.0, 76.1) 16.1 (13.0, 19.6) 79.1 (74.9, 82.6) 49.7 (44.1, 55.0) 74.6 (70.5, 78.9) 33.1 (26.7, 41.1) Up and about >50% 50.4 (41.7, 58.4) 7.3 (3.7, 12.5) 62.0 (52.7, 70.0) 30.3 (21.2, 40.0) 52.2 (44.2, 61.6) 11.6 (5.9, 22.9) Confined >50% 34.0 (24.8, 43.4) 1.0 (0.1, 5.0) 44.8 (33.7, 55.2) 10.1 (2.8, 23.1) 35.6 (27.0, 46.8) 1.5 (0.3, 9.0) Not recorded 74.0 (68.6, 78.6) 19.3 (15.0, 23.9) 79.2 (74.0, 83.5) 50.2 (43.4, 56.7) 76.5 (71.5, 81.8) 31.2 (23.7, 41.1) Anatomical site Lip 94.1 (86.4, 97.5) 56.5 (45.3, 66.2) 97.6 (90.8, 99.4) 91.3 (81.5, 96.0) 97.7 (92.4, 100.3) 98.3 (76.3, 120.2) Larynx 81.9 (78.5, 84.8) 29.5 (25.8, 33.2) 85.9 (82.8, 88.5) 63.8 (59.2, 67.9) 84.4 (81.1, 87.6) 50.5 (43.4, 57.7) Nasal cavity 77.7 (67.2, 85.1) 25.9 (17.1, 35.5) 82.8 (72.6, 89.4) 52.6 (40.2, 63.6) 79.5 (70.4, 88.5) 31.9 (19.5, 44.4) Oral cavity 76.9 (67.2, 85.1) 23.7 (20.1, 27.5) 82.1 (78.4, 85.3) 55.4 (50.3, 60.3) 79.1 (75.3, 82.9) 36.8 (30.1, 43.6) Oropharynx 65.3 (59.9, 70.2) 21.4 (17.1, 26.0) 73.8 (68.5, 78.4) 45.8 (39.6, 51.8) 66.7 (61.4, 72.0) 25.7 (19.7, 31.8) Hypopharynx 55.5 (46.1, 63.9) 9.2 (4.9, 15.3) 68.4 (58.5, 76.4) 23.6 (14.5, 33.9) 57.0 (47.9, 66.2) 15.8 (7.0, 24.7) Other/salivary gland 79.7 (71.2, 85.9) 30.5 (22.5, 38.9) 87.7 (80.2, 92.6) 62.3 (51.0, 71.7) 81.6 (74.1, 89.0) 44.8 (29.9, 59.7) Stage I 97.1 (94.9, 98.4) 46.0 (40.9, 50.9) 98.7 (96.9, 99.5) 84.0 (79.4, 87.8) 99.9 (98.2, 101.7) 72.2 (62.7, 81.6) II 89.2 (85.5, 91.9) 30.4 (25.7, 35.1) 93.3 (90.2, 95.5) 65.6 (59.6, 70.9) 91.9 (88.6, 95.2) 51.8 (42.8, 60.9) III 74.7 (69.1, 79.5) 23.8 (18.9, 29.0) 81.7 (76.4, 85.9) 53.4 (46.2, 60.0) 76.6 (71.3, 81.9) 32.7 (24.4, 41.0) IV 57.6 (53.7, 61.2) 13.9 (11.4, 16.7) 66.2 (62.4, 69.8) 35.3 (31.0, 39.6) 59.1 (55.2, 63.0) 21.6 (17.1, 26.0) Unknown 73.7 (65.3, 80.3) 24.8 (17.9, 32.4) 80.3 (72.2, 86.2) 55.4 (45.4, 64.3) 76.2 (68.5, 83.9) 36.8 (24.5, 49.1) Treatment modality Surgery only 88.9 (85.7, 91.4) 36.7 (32.4, 41.0) 93.5 (90.8, 95.4) 72.8 (68.1, 77.0) 91.7 (88.8, 94.6) 61.7 (53.1, 70.2) Radiotherapy only 82.1 (78.4, 85.1) 27.6 (23.8, 31.6) 87.0 (83.7, 89.7) 63.1 (58.1, 67.7) 84.8 (81.3, 88.2) 44.3 (37.0, 51.5) Surgery + radio 83.0 (79.2, 86.1) 24.9 (21.0, 28.9) 86.4 (82.9, 89.3) 54.2 (48.8, 59.3) 84.9 (81.4, 88.5) 36.2 (29.7, 42.6)
Surgery, radio + chemo 69.2 (56.5, 78.9) 32.3 (21.4, 43.7) 70.7 (58.0, 80.2) 47.3 (34.3, 59.2) 70.5 (59.2, 81.9) 39.4 (23.4, 55.5)
Radio + chemo 70.6 (62.4, 77.4) 17.5 (11.8, 23.1) 77.5 (69.6, 83.6) 37.3 (28.3, 46.3) 72.0 (64.4, 79.6) 22.3 (13.8, 30.8)
Chemo +/- surgery 9.8 (3.1, 21.0) 2.4 (0.2, 11.0) 17.2 (5.6, 34.0) 4.3 (0.3, 17.9) 10.0 (1.3, 18.7) 2.6 (1.5, 6.8)
No Treatment 10.9 (6.2, 16.9) 1.6 (0.3, 5.0) 18.1 (10.7, 26.9) 5.6 (1.7, 13.1) 11.2 (6.8, 16.7) 1.7 (0.4, 3.9)
Network/region
WoSCAN (West Scotland) 75.3 (72.5, 77.9) 24.0 (21.4, 26.7) 82.5 (79.9, 84.8) 54.8 (51.1, 58.3) 77.4 (74.7, 80.2) 36.9 (32.0, 41.7)
SCAN (East Scotland) 76.4 (72.1, 80.1) 30.0 (25.8, 34.3) 82.0 (78.0, 85.4) 60.0 (54.8, 64.8) 78.7 (74.6, 82.8) 50.0 (42.0, 58.1)
20
Table 3 – Mutually adjusted forward stepwise Cox proportional hazard ratios at one- and 12-years for all patient, tumour and treatment factors for overall survival
One-year 12-year
Variable HR (95% CIs) HR p-value p-value Chi-Sq. HR (95% CIs) HR p-value p-value Chi-Sq.
Age at diagnosis <0.001 22.23 <0.001 139.21 Less than 45 0.71 (0.42, 1.21) 0.208 0.59 (0.42, 0.84) 0.004 45 to 54 1.00 (Ref.) - 1.00 (Ref.) - 55 to 64 1.00 (0.77, 1.29) 0.991 1.17 (0.98, 1.40) 0.077 65 to 74 1.37 (1.05, 1.79) 0.019 1.94 (1.62, 2.32) <0.001 75 and over 1.60 (1.18, 2.18) 0.002 2.44 (1.97, 3.01) <0.001 Smoking behaviour 0.024 9.40 <0.001 24.62 Current smoker 1.42 (1.04, 1.94) 0.026 1.45 (1.19, 1.77) <0.001 Previous smoker 1.12 (0.80, 1.56) 0.520 1.08 (0.87, 1.34) 0.488
Never smoked 1.00 (Ref.) - 1.00 (Ref.) -
Not recorded 0.94 (0.51, 1.73) 0.835 1.22 (0.83, 1.80) 0.304
Alcohol consumption 0.023 10.82 <0.001 38.81
Current problem drinker 1.32 (1.08, 1.61) 0.006 1.51 (1.31, 1.73) <0.001
Previous problem drinker 1.19 (0.93, 1.53) 0.169 1.36 (1.15, 1.62) <0.001
Occasional/never 1.00 (Ref.) - 1.00 (Ref.) -
Not recorded 0.86 (0.63, 1.16) 0.323 1.01 (0.83, 1.23) 0.900
WHO Performance Status <0.001 41.46 <0.001 84.55
Normal activity 1.00 (Ref.) - 1.00 (Ref.) -
Strenuous restricted 1.52 (1.23, 1.89) <0.001 1.46 (1.27, 1.68) <0.001 Up and about >50% 2.19 (1.66, 2.90) <0.001 2.13 (1.73, 2.63) <0.001 Conf. to bed/chair >50% 2.38 (1.74, 3.27) <0.001 2.61 (2.03, 3.36) <0.001 Not recorded 1.45 (1.13, 1.85) 0.003 1.42 (1.21, 1.66) <0.001 Anatomical site 0.006 18.33 <0.001 32.79 Lip 0.48 (0.23, 1.03) 0.058 0.50 (0.35, 0.73) <0.001 Larynx 0.72 (0.57, 0.91) 0.007 0.74 (0.63, 0.88) <0.001 Nasal cavity 0.80 (0.54, 1.20) 0.279 0.78 (0.59, 1.04) 0.087 Oral cavity 1.00 (0.79, 1.27) 0.991 0.98 (0.82, 1.16) 0.790
Oropharynx 1.00 (Ref.) - 1.00 (Ref.) -
Hypopharynx 0.99 (0.74, 1.31) 0.926 1.06 (0.84, 1.33) 0.624 Other/salivary gland 1.25 (0.88, 1.77) 0.210 1.02 (0.79, 1.33) 0.881 Stage <0.001 22.23 <0.001 83.57 I 1.00 (Ref.) - 1.00 (Ref.) - II 2.71 (1.81, 4.05) <0.001 1.44 (1.20, 1.73) <0.001 III 4.17 (2.77, 6.27) <0.001 1.77 (1.45, 2.17) <0.001 IV 5.89 (3.98, 8.71) <0.001 2.38 (1.97, 2.88) <0.001 Unknown 4.36 (2.74, 6.95) <0.001 1.97 (1.52, 2.56) <0.001 Treatment modality <0.001 285.18 <0.001 283.86
Surgery only 1.00 (Ref.) - 1.00 (Ref.) -
Radiotherapy only 1.62 (1.22, 2.56) <0.001 1.31 (1.09, 1.57) 0.004
Surgery + radio 0.97 (0.73, 1.29) 0.828 1.02 (0.86, 1.22) 0.810
Surgery, radio + chemo 1.39 (0.88, 2.19) 0.154 1.00 (0.72, 1.39) 0.984
Radio + chemo 1.70 (1.21, 2.40) 0.002 1.40 (1.10, 1.78) 0.006
Chemo +/- surgery 7.25 (4.77, 11.02) <0.001 6.01 (4.19, 8.62) <0.001
No Treatment 7.78 (5.68, 10.66) <0.001 5.99 (4.67, 7.69) <0.001
21
Table 4 – Mutually adjusted one- and 12-year overall for all patient, tumour and treatment factors for disease-specific survival
1-year 12-year
Variable HR (95% CIs) HR p-value p-value Chi-Sq. HR (95% CIs) HR p-value p-value Chi-Sq.
Age at diagnosis 0.018 11.93 <0.001 22.85 Less than 45 0.70 (0.38, 1.27) 0.236 0.78 (0.51, 1.21) 0.267 45 to 54 1.00 (Ref.) - 1.00 (Ref.) - 55 to 64 0.89 (0.66, 1.20) 0.432 0.94 (0.74, 1.19) 0.607 65 to 74 1.03 (0.76, 1.40) 0.856 1.28 (0.99, 1.64) 0.056 75 and over 1.41 (1.00, 2.00) 0.053 1.58 (1.18, 2.11) 0.002 Alcohol consumption <0.001 19.33 <0.001 30.95
Current problem drinker 1.42 (1.13, 1.78) 0.002 1.54 (1.28, 1.86) <0.001
Previous problem drinker 1.35 (1.01, 1.80) 0.041 1.42 (1.12, 1.80) 0.004
Occasional/never 1.00 (Ref.) - 1.00 (Ref.) -
Not recorded 0.69 (0.48, 0.97) 0.035 0.81 (1.15, 1.07) 0.131
WHO Performance Status <0.001 31.61 <0.001 43.93
Normal activity 1.00 (Ref.) - 1.00 (Ref.) -
Strenuous restricted 1.60 (1.23, 2.09) <0.001 1.41 (1.15, 1.73) 0.001 Up and about >50% 2.25 (1.60, 3.15) <0.001 2.06 (1.55, 2.74) <0.001 Conf. to bed/chair >50% 2.51 (1.72, 3.66) <0.001 2.66 (1.92, 3.68) <0.001 Not recorded 1.51 (1.11, 2.04) 0.008 1.46 (1.16, 1.84) 0.001 Anatomical site / / 0.005 18.47 Lip / / 0.25 (0.11, 0.58) 0.001 Larynx / / 0.78 (0.61, 0.99) 0.037 Nasal cavity / / 0.82 (0.56, 1.20) 0.314 Oral cavity / / 0.98 (0.78, 1.25) 0.885 Oropharynx / / 1.00 (Ref.) - Hypopharynx / / 1.10 (0.82, 1.47) 0.531 Other/salivary gland / / 0.80 (0.54, 1.18) 0.259 Stage <0.001 84.00 <0.001 98.22 I 1.00 (Ref.) - 1.00 (Ref.) - II 4.89 (2.62, 9.12) <0.001 2.13 (1.52, 2.98) <0.001 III 7.23 (3.85, 13.57) <0.001 3.03 (2.14, 4.29) <0.001 IV 12.42 (6.77, 22.83) <0.001 4.86 (3.49, 6.77) <0.001 Unknown 7.86 (3.99, 15.51) <0.001 3.83 (2.52, 5.83) <0.001 Treatment modality <0.001 233.82 <0.001 205.62
Surgery only 1.00 (Ref.) - 1.00 (Ref.) -
Radiotherapy only 1.70 (1.21, 2.38) 0.002 1.54 (1.17, 2.03) 0.002
Surgery + radio 1.12 (0.79, 1.59) 0.532 1.14 (0.88, 1.49) 0.325
Surgery, radio + chemo 2.08 (1.26, 3.42) 0.004 1.45 (0.95, 2.21) 0.084
Radio + chemo 2.13 (1.42, 3.19) <0.001 1.77 (1.28, 2.45) <0.001
Chemo +/- surgery 7.27 (4.41, 12.00) <0.001 6.49 (4.10, 10.26) <0.001
No Treatment 10.15 (6.93, 14.87) <0.001 7.71 (5.54, 10.73) <0.001
Network/region 0.043 6.29 / /
WoSCAN (West Scotland) 0.95 (0.74, 1.20) / /
SCAN (East Scotland) 1.00 (Ref.) - / /
NOSCAN (North Scotland) 1.30 (0.98, 1.73) / /
- Reference category / Not entered into model
22
Supplementary Tables
Supplementary Table 1 - Mutually adjusted Cox proportional hazards model results when excluding patients who received no treatment (n = 1,691)
Overall Disease-specific
1-year p-value Chi-Sq. 12-year p-value Chi-Sq. 1-year p-value Chi-Sq. 12-year p-value Chi-Sq.
Age <0.001 24.45 Age <0.001 140.09 Age 0.110 7.54 Age <0.001 18.93
Stage <0.001 102.76 Stage <0.001 90.68 Stage <0.001 86.82 Stage <0.001 104.10
Treatment <0.001 46.79 Treatment <0.001 25.34 Treatment <0.001 38.60 Treatment <0.001 28.04
WHO <0.001 46.77 WHO <0.001 93.65 WHO <0.001 32.13 WHO <0.001 51.71
Alcohol 0.004 13.52 Alcohol <0.001 34.77 Alcohol 0.001 15.82 Site <0.001 34.07
Site <0.001 30.47 Site <0.001 42.66 Site 0.007 17.62 Alcohol <0.001 25.90
Smoking 0.022 9.65 Smoking <0.001 27.49 Network 0.050 5.99 - - -
Supplementary Table 2 - Mutually adjusted Cox proportional hazards model results when excluding oropharynx patients (n = 1,497) with larynx as new reference group
Step Overall Disease-specific
1 1-year p-value Chi-Sq. 12-year p-value Chi-Sq. 1-year p-value Chi-Sq. 12-year p-value Chi-Sq.
2 Age 0.008 13.88 Age <0.001 102.99 Age 0.015 12.30 Age 0.003 16.53
3 Stage <0.001 81.75 Stage <0.001 84.89 Stage <0.001 67.36 Stage <0.001 89.54
4 Treatment <0.001 177.34 Treatment <0.001 155.18 Treatment <0.001 149.20 Treatment <0.001 119.32
5 WHO < 0.001 45.10 WHO <0.001 86.31 WHO <0.001 32.06 WHO <0.001 50.11
6 Alcohol 0.007 12.24 Alcohol <0.001 31.70 Alcohol 0.001 16.03 Alcohol <0.001 23.22
7 Site 0.008 15.50 Site <0.001 29.65 Network 0.004 11.14 Site 0.003 18.04
23
Supplementary Table 3 – Patient demographic, behavioural, tumour and treatment characteristics by Carstairs quintiles
Variable
Total (Col. %) Frequencies of Carstairs 2001 quintiles (Col. %)
Chi-square p-value 1 – Most affluent 2 3 4 5 – Most deprived
Whole cohort (Row %) 1,820 (100.0%) 241 (13.2%) 317 (17.4%) 325 (17.9%) 409 (22.5%) 528 (29.0%) -
Age at diagnosis 0.470 Less than 45 99 (5.4%) 16 (6.6%) 23 (7.3%) 16 (4.9%) 21 (5.1%) 23 (4.4%) 45 to 54 288 (15.8%) 35 (14.5%) 44 (13.9%) 45 (13.9%) 68 (16.6%) 96 (18.2%) 55 to 64 592 (32.5%) 70 (29.1%) 105 (33.1%) 108 (33.2%) 140 (34.2%) 169 (32.0%) 65 to 74 551 (30.3%) 72 (29.9%) 90 (28.4%) 111 (34.2%) 108 (26.4%) 170 (32.2%) 75 and over 290 (15.9%) 48 (19.9%) 55 (17.4%) 45 (13.9%) 72 (17.6%) 70 (13.3%) Sex 0.440 Male 1,300 (71.4%) 161 (66.8%) 227 (71.6%) 236 (72.6%) 289 (70.7%) 387 (73.3%) Female 520 (28.6%) 80 (33.2%) 90 (28.4%) 89 (27.4%) 120 (29.3%) 141 (26.7%) Smoking status <0.001 Current smoker 1,134 (62.3%) 118 (49.0%) 173 (54.6%) 191 (58.8%) 256 (62.6%) 396 (75.0%) Previous smoker 405 (22.3%) 60 (24.9%) 86 (27.1%) 68 (20.9%) 100 (24.5%) 91 (17.2%) Never smoked 221 (12.1%) 56 (23.2%) 45 (14.2%) 50 (15.4%) 41 (10.0%) 29 (5.5%) Not recorded 60 (3.3%) 7 (2.9%) 13 (4.1%) 16 (4.9%) 12 (2.9%) 12 (2.3%) Alcohol consumption <0.001
Current (problem) drinker 496 (27.3%) 51 (21.2%) 77 (24.3%) 80 (24.6%) 108 (26.4%) 180 (34.1%)
Previous (problem) drinker 212 (11.7%) 25 (10.4%) 29 (9.2%) 49 (15.1%) 47 (11.5%) 62 (11.7%)
Occasional/never drank 891 (49.0%) 138 (57.3%) 164 (51.7%) 150 (46.2%) 198 (48.4%) 241 (45.6%)
Not recorded 221 (12.1%) 27 (11.2%) 47 (14.8%) 46 (14.2%) 56 (13.7%) 45 (8.5%)
WHO performance status 0.003
Normal activity 825 (45.3%) 137 (56.9%) 169 (53.3%) 137 (42.3%) 177 (43.3%) 205 (38.8%)
Strenuous activity restricted 465 (25.6%) 54 (22.4%) 66 (20.8%) 94 (28.9%) 102 (24.9%) 149 (28.2%)
Up and about > 50% 137 (7.5%) 18 (7.5%) 23 (7.3%) 17 (5.2%) 33 (8.1%) 46 (8.7%) Confined to bed/chair >50% 97 (5.3%) 8 (3.3%) 18 (5.7%) 22 (6.8%) 26 (6.4%) 23 (4.4%) Not recorded 296 (16.3%) 24 (10.0%) 41 (12.9%) 55 (16.9%) 71 (17.4%) 105 (19.9%) Anatomical site 0.470 Lip 85 (4.7%) 11 (4.6%) 17 (5.4%) 18 (5.5%) 23 (5.6%) 16 (3.0%) Larynx 584 (32.1%) 71 (29.5%) 102 (32.2%) 103 (31.7%) 143 (35.0%) 165 (31.3%) Nasal cavity 85 (4.7%) 12 (5.0%) 14 (4.4%) 22 (6.8%) 15 (3.7%) 22 (4.2%) Oral cavity 506 (27.8%) 76 (31.5%) 93 (29.3%) 78 (24.0%) 97 (23.7%) 162 (30.7%) Oropharynx 323 (17.8%) 40 (16.6%) 53 (16.7%) 63 (19.4%) 69 (16.9%) 98 (18.6%) Hypopharynx 119 (6.5%) 12 (5.0%) 19 (6.0%) 20 (6.2%) 35 (8.6%) 33 (6.3%) Other/salivary gland 118 (6.5%) 19 (7.9%) 19 (6.0%) 21 (6.5%) 27 (6.6%) 32 (6.1%) Stage 0.023 I 383 (21.0%) 58 (24.1%) 85 (26.8%) 75 (23.1%) 73 (17.9%) 92 (17.4%) II 369 (20.3%) 48 (19.9%) 62 (19.6%) 65 (20.0%) 88 (21.5%) 106 (20.1%) III 273 (15.0%) 37 (15.4%) 42 (13.3%) 40 (12.3%) 80 (19.6%) 74 (14.0%) IV 662 (36.4%) 79 (32.8%) 102 (32.2%) 125 (38.5%) 145 (35.5%) 211 (40.0%) Unknown 133 (7.3%) 19 (7.9%) 26 (8.2%) 20 (6.2%) 23 (5.6%) 45 (8.5%) Treatment modality 0.064 Surgery only 477 (26.2%) 72 (29.9%) 83 (26.2%) 86 (26.5%) 106 (25.9%) 130 (24.6%) Radiotherapy only 507 (27.9%) 74 (30.7%) 99 (31.2%) 98 (30.2%) 117 (28.6%) 119 (22.5%) Surgery + radiotherapy 458 (25.2%) 59 (24.5%) 82 (25.9%) 73 (22.5%) 101 (24.7%) 143 (27.1%)
Chemo +/- radio +/- surgery 249 (13.7%) 23 (9.5%) 34 (10.7%) 48 (14.8%) 56 (13.7%) 88 (16.7%)
No treatment 129 (7.1%) 13 (5.4%) 19 (6.0%) 20 (6.2%) 29 (7.1%) 48 (9.1%)
Network <0.001
WoSCAN (West Scotland) 1,001 (55.0%) 85 (35.3%) 110 (34.7%) 149 (45.9%) 244 (59.7%) 413 (78.2%)
SCAN (East Scotland) 440 (24.2%) 83 (34.4%) 85 (26.8%) 108 (33.2%) 108 (26.4%) 56 (10.6%)