Smooth Simultaneous Structural Graph
Matching and Point-Set Registration
Gerard Sanrom`a1, Ren´e Alqu´ezar2, and Francesc Serratosa1
1 Departament d’Enginyeria Inform`atica i Matem`atiques,
Universitat Rovira i Virgili, Tarragona (Spain) {gerard.sanroma,francesc.serratosa}@urv.cat
2 Institut de Robtica i Informtica Industrial, CSIC-UPC, Barcelona (Spain)
Abstract. We present a graph matching method that encompasses both a model of structural consistency and a model of geometrical deforma-tions. Our method poses the graph matching problem as one of mixture modelling which is solved using the EM algorithm. The solution is then approximated as a succession of assignment problems which are solved, in a smooth way, using Softassign. Our method allows us to detect out-liers in both graphs involved in the matching. Unlike the outlier rejectors such as RANSAC and Graph Transformation Matching, our method is able to refine an initial the tentative correspondence-set in a more flexible way than simply removing spurious correspondences. In the experiments, our method shows a good ratio between effectiveness and computational time compared with other methods inside and outside the graphs’ field. Keywords: correspondence problem, expectation-maximization, softas-sign, affine registration
1
Introduction
The correspondence problem arises in many computer vision applications. Tentative correspondences can be computed on the basis of the local image contents around some interest points [8][14]. However, a refinement process is often needed in order to remove erroneous correspondences in the tentative-set. This is the case of RANSAC [6] and Graph Transformation Matching [2], which remove outlying correspondences by enforcing some kind of global con-sistency. The main drawback of these methods is that their success strongly depends on the reliability of the tentative-set. Since they are unable either to generate new correspondences or to modify the existing ones, a tentative-set with few successes may lead to sparse estimates. This is illustrated in figure 1.
Attributed Graph Matching techniques are another approach to refine the tentative correspondences which do not suffer from the aforementioned problem of the outlier rejectors.
Hancock et al. [13][4][11] present graph matching approaches that jointly solve the correspondence and alignment problems. The advantages of posing the
(a) Tentative correspondences computed by a matching by correlation method. The red dots are unmatched points. There are several misplaced correspondences.
(b) Only a few inliers are found by RANSAC. This may not be suitable in the cases when more dense correspondence-sets are needed.
Fig. 1.Matching results for two sample images from the class Resid (from ref. [1]) with superposed Harris corners [8]. Green lines represent the correspondences found by (a) a correlation method and (b) RANSAC applied to the correlation results.
graph matching as a joint correspondence and alignment problem, are twofold. On one hand, structural information may contribute to disambiguate the recov-ery of the alignment. On the other hand, geometrical information may aid to clarify the recovery of the correspondences in the case of structural corruption. In [4][18][17], Hancocket al. propose a principled way of detecting outliers that consists in measuring the net effects of a node deletion in a reconfigured graph. This is a one-direction model, i.e., data-graph constraints are evaluated on the model-graph side. This implies that outliers can only be detected in the data-graph side, a practical limitation in computer vision where outliers can be found indistinguishably in both sides.
Gold and Rangarajan present Graduated Assignment [7], an optimization technique aimed at graph matching. They use Softassign [16][15][10] to handle continuous correspondences and to provide two-way constraints satisfaction.
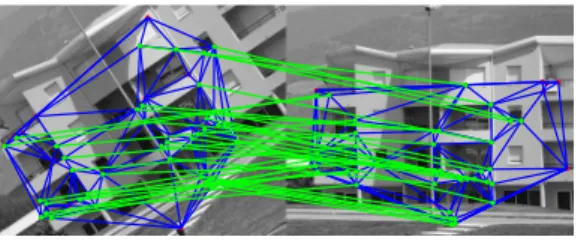
We propose a method to solve the graph matching problem as one of mixture modelling [4][12]. Our mixture model evaluates the geometrical arrangement of the nodes as well as their structural relations. We use the EM algorithm to approximate the solution, in a principled way, as a succession of assignment problems which are solved using Softassign. This allows us to gradually move from continuous to discrete correspondences while being able to detect outliers in both graphs in a smooth way. We provide computational time results sug-gesting that our method can be used at specific moments during a real-time operation (e.g., when the tentative-sets are insufficient). Figure 2 shows that our approach arrives at a correct dense correspondence-state, while still leaving a few unmatched outliers in both images.
2
A Mixture Model
Consider two graph representationsG= (V, D, X) andH = (W, E, Y), extracted from two images (e.g., figure 2).
Fig. 2.The green lines are the result of applying our method using, as starting point, the tentative-set of figure 1(a). Nodes are placed in the locations of the Harris corners. Blue lines represent the edges generated by means of Delaunay triangulations on the Harris corners. Our method still detects a few outliers in both graphs.
The node-setsV ={va,∀a∈I} and W ={wα,∀α∈J} contain the symbolic
representations of the nodes, whereI=1...|V|andJ=1...|W|are their index-sets. The vector-setsX ={xa= (xaab, xora), ∀a∈I}andY ={yα= (yαab, yαor),∀α∈J},
contain the column vectors of the two-dimensional coordinates (abscissa and or-dinate) of each node.
The adjacency matricesD and E contain the edge-sets, representing some kind of structural relation between pairs of nodes (e.g., connectivity or spatial proximity). Hence,Dab=
1 if va and vb are linked by an edge
0 otherwise (the same
ap-plies forEαβ).
We use continuous correspondence indicatorsS so, we denote assaα ∈ S,
the probability of nodeva∈V being in correspondence with nodewα∈W.
It is satisfied that
X
α∈J
saα≤1, ∀a∈ I (1)
where, 1−P
αsaα is the probability of nodeva being an outlier.
Our aim is to recover the correspondence indicatorsS and the registration parameters Φ that maximize the incomplete likelihood of the observed graph,
P(G|S, Φ). The standard procedure to build likelihood functions for mixture distributions consists in factorizing over the observed data (i.e., observed graph nodes) and summing over the hidden variables (i.e., their corresponding reference nodes). Hence, P(G|S, Φ) =Y a∈I X α∈J P(va, wα|S, Φ) (2)
where P(va, wα|S, Φ) is the conditional likelihood of correspondence between
nodesva ∈V andwα∈W.
Following a similar development than Luo and Hancock [12] we factorize, using the Bayes rules, the conditional likelihood in the right hand side of equation (2) into terms of individual correspondence indicators, in the following way.
P(va, wα|S, Φ) =Kaα Y b∈I Y β∈J P(va, wα|sbβ, Φ) (3)
where Kaα = [1/P(va|wα,Φ)]
|I|×|J |−1
. If we assume that the observed nodeva is
conditionally dependant on the reference nodewαand the registration
parame-tersΦonly in the presence of the correspondence matchesS, thenP(va|wα, Φ) =
P(va). Further assuming equiprobable priorsP(va), we can safely discard these
quantities in the maximization of equation (2), since they do not depend neither onS orΦ.
We propose a measure for the conditional likelihood of equation (3) that uses the same model for the structural errors as in [12], augmented with a geometric compatibility measure.
On one hand, given two corresponding pairs of points (va, vb) →(wα, wβ),
we consider that there will be lack of edge-support (i.e., Dab = 0∨Eαβ = 0)
with a constant probability Pe. On the other hand, we consider that it is an
affine-invariant density measurement on the point position errors P(xb,yβ|Φ)
(for brevityPbβ), that it is appropriate for weighting the conditional likelihood
in the case of correspondence between nodesvbandwβ. In the case of no
corre-spondence we assign a constant probabilityρthat controls the outlier process. Accordingly, our expression for the conditional likelihood is
P(va, wα|sbβ, Φ) = h (1−Pe)Pbβ iDabEαβsbβh PePbβ i(1−DabEαβ)sbβh Peρ i(1−sbβ) (4) Substituting equation (4) into equation (3), the final expression for the cor-respondence likelihood betweenva andwα, expressed in the exponential form,
is P(va, wα|S, Φ) = exp X b∈I X β∈J sbβDabEαβln 1−Pe Pe +sbβln P bβ ρ + lnρ (5)
3
Expectation Maximization
The EM algorithm has been previously used by other authors to solve the Graph Matching problem [4] [12]. We seek the affine registration parametersΦand the correspondence indicatorsS, that maximize the expected log-likelihood of our mixture distribution. Dempsteret al.[5] showed that this could be posed as an iterative estimation of a weighted sum of log-likelihoods.
Accordingly, we seek the parameters ˆS,Φˆthat maximize the following objec-tive function ΛS,ˆ Φˆ|S(n) , Φ(n) =X a∈I X α∈J P(wα|va, S(n), Φ(n)) lnP va, wα|S,ˆ Φˆ (6) where P(wα|va, S(n), Φ(n)) are the posterior probabilities of the missing data
given the most recent available parametersS(n), Φ(n).
The basic idea is to alternate between Expectation and Maximization steps until convergence is reached. The expectation step involves computing the a posteriori probabilities of the missing data using the most recent available pa-rameters. In the maximization phase, the parameters are updated in order to maximize the expected log-likelihood of the incomplete data.
3.1 Expectation
In the expectation step, the posteriori probabilities of the missing data (i.e., the reference graph measurements wα) are computed using the current parameter
estimatesS(n), Φ(n).
The posterior probabilities can be expressed in terms of conditional likeli-hoods, using the Bayes rule, in the following way
P(wα|va, S(n), Φ(n)) = P(va, wα|S(n), Φ(n)) P α′P(va, wα′|S(n), Φ(n))≡R (n) aα (7)
We substitute the conditional likelihoods of the above equation by the ex-pression of equation (5).
3.2 Maximum Likelihood Affine Registration Parameters
ML affine registration parameters and correspondence indicators are recovered in separate steps.
We are interested in the registration parametersΦ(n+1)that lead to the max-imum likelihood of equation (6). We use the expressions in equations (7) and (5) for the posterior probability and conditional likelihood terms, respectively. Dis-carding the terms that are constant w.r.t. the registration parameters we obtain the following expression
Φ(n+1)= arg max ˆ Φ X a∈I X α∈J Raα(n) X b∈I X β∈J s(n) bβln Pˆbβ ρ (8) Rearranging and further removing other terms constant w.r.t. the registration parameters, we get Φ(n+1)= arg max ˆ Φ ( P b∈I P β∈J s(n) bβln Pˆbβ ρ P a∈I P α∈J R(aαn) ) =arg max ˆ Φ ( P b∈I P β∈J s(n) bβln ˆPbβ ) (9) We assume that the geometrical compatibilities ˆPbβ follow a multivariate
gaussian distribution of the point errors.
Substituting ˆPbβby its appropriate expression and, removing constant terms,
we arrive to the minimization of the following objective function
F =X b∈I X β∈J s(n) bβ ˜ xb−Φˆy˜β T Σ−1x˜b−Φˆ˜yβ (10) where ˜xb and ˜yβ are the augmented vectors of homogeneous coordinates, Φ=
φ11φ12φ13 φ21φ22φ23 0 0 1
is the matrix of affine registration parameters and,Σ is diagonal matrix of variances.
Affine registration parameters are computed by solving the set of linear equa-tionsδF/δφij= 0.
3.3 Maximum Likelihood Correspondence Indicators
One of the key points in our work, is to approximate the solution of the graph matching problem by a succession of easier assignment problems. As it is done in Graduated Assignment [7], we use the Softassign [16][15][10] to solve the assignment problems in a continuous way.
According to the EM development, we compute the correspondence indica-torsS(n+1) that maximize equation (6). Substituting equations (7) and (5) into (6) and, discarding the constant term lnρof equation (5), we obtain
S(n+1) = arg max ˆ S X a∈I X α∈J R(n) aα X b∈I X β∈J ˆ sbβ DabEαβln 1−Pe Pe + ln Pbβ(n) ρ (11) Rearranging we obtain the following assignment problem [7]
S(n+1) = arg max ˆ S X b∈I X β∈J ˆ sbβQ(n)bβ (12) where Q(n) bβ = X a∈I X α∈J R(n) aα h DabEαβln 1−Pe Pe + lnPbβ ρ i (13) is the benefit coefficient for the assignmentvb→wβ.
Softassign computes the correspondence indicators in two steps. First, the correspondence indicators are updated with the exponentials of the benefit co-efficients
sbβ= exp (µ Qbβ) (14)
where µ is a control parameter. Second, two-way constraints are imposed by alternatively normalizing across rows and columns the matrix of exponentiated benefits. This is known as theSinkhorn normalization and, it is applied either until convergence of the normalized matrix or, a predefined number of times.
Note that, as the control parameterµof equation (14) approaches to∞, the correspondence indicators sbβ tend to discrete values (sbβ = {0,1}) after the
Sinkhorn normalization.
3.4 Outlier Rejection
Outliers can dramatically affect the performance of a matching and therefore, it is important to develop techniques aimed at minimizing their influence [3].
According to our purposes, a nodevb∈v(orwβ∈w) will be considered an
outlier to the extent that there is no nodewβ,∀β∈J (orvb,∀b∈I) which presents
a matching benefitQ(n)
bβ above a given threshold.
Note that, ρestablishes the threshold at which the geometrical terms (i.e., ln (Pbβ/ρ)) contribute positively (i.e., ρ < Pbβ) or negatively (i.e., ρ > Pbβ) to
Our strategy for controlling the outlier process is the following. We set the outlying threshold to zero and, create an augmented benefit matrix ˜Q(n) by adding to Q(n) an extra row and column of zeros (the
slack variables of the Softassign [7]). Then, we apply the Softassign (exponentiation and Sinkhorn normalization) to the augmented benefit matrix. Last, the slack variables are removed leading to the resulting matrix of correspondence parametersS(n+1).
Note that, as the control parameterµ of the Softassing increases, the rows and columns of S(n+1) associated to the outlier nodes, tend to zero. This fact reduces the influence of these nodes in the maximization phases of the next iteration that, in turn, lead to even lower benefits, and so on.
It is now turn to define the value of the outlying thresholdρ. Sinceρ is to be compared with Pbβ, it is convenient to define it in terms of a multivariate
gaussian of a distance threshold. This is,
ρ= 1 2π|Σ|1/2exp −1 2d TΣ−1d (15) where,Σ= diag(σab)2,(σor)2is a diagonal variance matrix and,d= (dab, dor) is a column vector with the abscissa and ordinate thresholding distances.
Cancelling the gaussian constant terms in the numerator and denominator of the geometrical term and, expressing the thresholding distance proportionally to the standard deviations of the data (i.e., d= (N σab, N σor)), the expression ofρto be compared withPbβ becomes
ρ= exp ( −1 2 " N σab σab 2 + N σor σor 2#) = exp −N2 (16)
So, we defineρas a function of the numberN of standard deviations permit-ted in the registration errors, in order to consider a plausible correspondence.
4
Experiments and Results
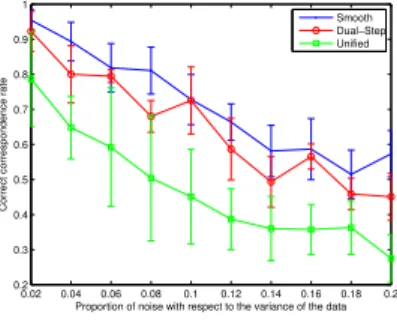
In the first set of experiments, we have evaluated the effectiveness of our method in front of non-rigid deformations in the positions of the features (i.e., nodes). In each experiment, a pattern of 15 randomly generated points is matched against a deformed version of itself. Deformations are introduced by applying gaussian noise, independently, to each point. Graphs’ edges are generated by Delaunay triangulations on the point-sets. Figure 3 shows the comparison of our method (denoted as Smooth) to the graph matching + alignment methods in refs. [4] (Dual-Step) and [13] (Unified). We have used the values Pe = 0.3 and ρ =
exp −1.92
for our method. The parameters of the other methods have been accurately set to have a good performance. All the methods have been initialized by the correspondences obtained by simple nearest neighbour association.
The mean execution times of the MATLAB implementations of each method are:Smooth 0.66 sec.,Dual-Step14.08 sec. and,Unified 0.91 sec. TheDual-step
0.02 0.04 0.06 0.08 0.1 0.12 0.14 0.16 0.18 0.2 0.2 0.3 0.4 0.5 0.6 0.7 0.8 0.9 1
Proportion of noise with respect to the variance of the data
Correct correspondence rate
Smooth Dual−Step Unified
Fig. 3.Correct correspondence rate vs. noise level (represented as a proportion of the data variance). Each point is the mean of 25 experiments (5 random patterns by 5 random deformations of each pattern).
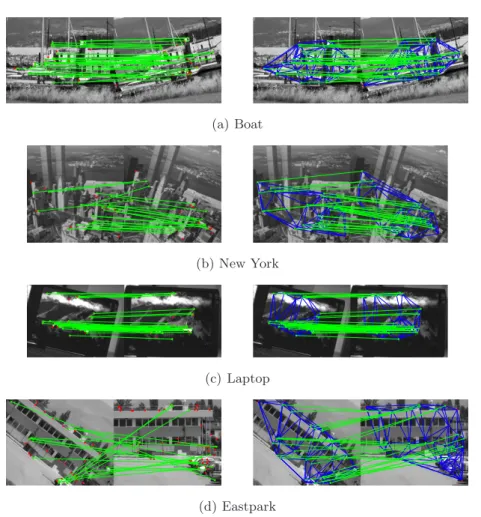
The last set of experiments evaluates the matching performance on real im-ages under zoom and rotation from the database in [1]. Features are extracted with the Harris operator [8] and edges with Delaunay triangulations. Figure 4 show the results of applying our method to some images. We have used the val-uesPe= 0.3 and ρ= exp −1.32
for our method. The value of ρhas been set so as to enable an actual detection of outliers.
We have compared some methods with explicit outlier detection mechanisms. These are the outlier rejectorsRANSAC [6] and Graph Transformation Match-ing (GTM) [2] and, the graph matching method Dual-Step [4] (with the out-lier detection scheme enabled). All the methods have been initialized with the matching by correlation (Corr) results.
From the resulting correspondences of each method, we have estimated the corresponding homographies with the DLT algorithm [9]. Since it is available the ground truth homography between each pair of images, we have measured the mean projection error (MPE) of the feature-points in the origin images. Table 1 shows the results.
Resid Boat NewYork Laptop Eastpark Methods MPE time MPE time MPE time MPE time MPE time
Corr 835.4 1.5 24.48 1.5 31.1 0.98 0.28 1.34 463.4 1.62
Smooth 1.5 13.8 0.72 18.2 0.69 3.6 0.29 8.18 1.08 19.7
Dual-Step 1.33 3615 1.68 3794 0.69 1429 0.3 2693 153.46 3027
RANSAC 20.23 0.2 1.6 0.1 17.11 0.12 0.28 0.11 350.13 0.42
GTM 24.15 0.02 0.8 0.1 3.2 0.02 0.34 0.02 359.9 0.04 Table 1. Mean Projection Error (MPE, in pixels) and execution times (in seconds) obtained by each method using a MATLAB implementation. In the case of accurate correlation results (e.g., Laptop), slight errors may be introduced due to the approx-imations done by each method in the model assumptions such as the affine one (in
(a) Boat
(b) New York
(c) Laptop
(d) Eastpark
Fig. 4.Right column shows the results of our method using the correlation results (left column) as starting point.
5
Conclusions
We have presented a method that uses the EM algorithm to approximate the graph matching problem as a succession of assignment problems which are then solved in a smooth way using Softassign. Our method refines an initial tentative correspondence-set in a more flexible way than the outlier rejectors such as RANSAC and Graph Transformation Matching that are only able to remove the spurious correspondences. Furthermore, it is capable of detecting outliers in both graphs. Results show that our method performs faster and better than other graph matching methods in the literature in the matching of synthetic graphs. Results in the matching of real images show that our method performs generally better than the others, within an admissible time. Methods with comparable efficiency than ours show computational times of two orders of magnitude higher.
Acknowledgements. This research is supported by Consolider Ingenio 2010 (CSD2007-00018), by the CICYT (DPI 2010-17112) and by project DPI-2010-18449.
References
1. Http://www.featurespace.org/
2. Aguilar, W., Frauel, Y., Escolano, F., Martinez-Perez, M.: A robust graph trans-formation matching for non-rigid registration. Image and Vision Computing 27, 897–910 (2009)
3. Black, M., Rangarajan, A.: On the unification of line processes, outlier rejection, and robust statistics with applications in early vision. International Journal of Computer Vision 19(1), 57–91 (JUL 1996)
4. Cross, A., Hancock, E.: Graph matching with a dual-step em algorithm. IEEE Trans. Pattern Analysis and Machine Intelligence 20(11), 1236–1253 (NOV 1998) 5. Dempster, A., Laird, N., Rubin, D.: Maximum likelihood from incomplete data via
the em algorithm. Journal Royal Stat. Soc., Series B 39(1), 1–38 (1977)
6. Fischler, M.A., Bolles, R.C.: Random sample consensus: a paradigm for model fitting with applications to image analysis and automated cartography. Comuni-cations of the ACM 24(6), 381–395 (1981)
7. Gold, S., Rangarajan, A.: A graduated assignment algorithm for graph matching. IEEE Trans. Pattern Analysis and Machine Intelligence 18(4) (April 1996) 8. Harris, C., Stephens, M.: A combined corner and edge detection. In: Proceedings
of The Fourth Alvey Vision Conference. pp. 147–151 (1988)
9. Hartley, R., Zisserman, A.: Multiple View Geometry in Computer Vision. Cam-bridge University Press (2003)
10. Kosowsky, J., Yuille, A.: The invisible hand algorithm - solving the assignment problem with statistical physics. Neural Networks 7(3), 477–490 (1994)
11. Luo, B., Hancock, E.: Feature matching with procrustes alignment and graph edit-ing. In: 7th Int. Conf. on Image Proc. and Apps. pp. 72–76. No. 465 (1999) 12. Luo, B., Hancock, E.: Structural graph matching using the em algorithm and
singular value decomposition. IEEE Transactions on Pattern Analysis and Machine Intelligence 23(10) (October 2001)
13. Luo, B., Hancock, E.: A unified framework for alignment and correspondence. Computer Vision and Image Understanding 92(1), 26–55 (OCT 2003)
14. Mikolajczyk, K., Schmid, C.: A performance evaluation of local descriptors. IEEE Trans. on Pattern Analysis and Machine Intelligence 27(10), 1615–1630 (2005) 15. Rangarajan, A., Gold, S., Mjolsness, E.: A novel optimizing network architecture
with applications. Neural Computation 8(5), 1041–1060 (JUL 1 1996)
16. Sinkhorn, R.: Relationship between arbitrary positive matrices + doubly stochastic matrices. Annals of Mathematical Statistics 35(2), 876–& (1964)
17. Wilson, R., Cross, A., Hancock, E.: Structural matching with active triangulations. Computer Vision and Image Understanding 72(1), 21–38 (OCT 1998)
18. Wilson, R., Hancock, E.: Structural matching by discrete relaxation. IEEE Trans. Pattern Analysis and Machine Intelligence 19(6), 634–648 (JUN 1997)
![Fig. 1. Matching results for two sample images from the class Resid (from ref. [1]) with superposed Harris corners [8]](https://thumb-us.123doks.com/thumbv2/123dok_us/1990076.2795615/2.892.224.699.181.266/matching-results-sample-images-resid-superposed-harris-corners.webp)