CEBR
ICT, Innovation
and Productivity Growth
ICT, Innovation and Productivity
Growth
Henrik Fosse hf.eco@cbs.dk Joannes Jacobsen, jj.cebr@cbs.dk Anders Sørensen as.eco@cbs.dkCEBR – Centre for Economic and Business Research Copenhagen Business School
Table of Contents
Table of Contents ... 1 1 Sammenfatning ... 3 2 Executive summary ... 10 3 Overview ... 17 3.1 Introduction ... 173.2 Hypothesis under investigation ... 17
3.3 Data used in the analyses ... 18
3.4 Approach to the analyses ... 19
3.5 Main results ... 21
3.6 The case of product innovation ... 22
3.7 Demand and Supply innovation ... 27
3.8 Technology upgrading and organizational changes ... 32
4 Descriptive analysis ... 36
4.1 Motivation ... 36
4.2 Hypothesis under investigation ... 36
4.3 Approach to descriptive statistics ... 38
4.4 The Data ... 38
4.5 Innovation Activities and ICT expenditures ... 44
4.6 Productivity growth ... 49
5 Quantitative analysis ... 57
5.1 Approach to the analyses ... 57
5.2 Results ... 62
1
Sammenfatning
Denne CEBR-rapport præsenterer nye analyseresultater, der peger på, at investeringer i informations- og kommunikationsteknologi (IKT) kan stimulere innovation. På denne måde kan IKT-investeringer være en effektiv vej til at forøge produktiviteten i danske virksomheder.
BOX S.1.1 HOVEDRESULTATER
Vores grunddata viser, at:
IKT-intensive virksomheder i 2007 havde mellem 5,8 og 12,4 procentpoint større sandsynlighed for at engagere sig i fire innovationsaktiviteter (produkt-, markedsførings-, proces- og/eller organisatorisk innovation) end IKT-ikke-intensive virksomheder.
IKT-intensive virksomheder havde i gennemsnit 2,4 procentpoint højere årlig produktivitetsvækst end IKT-ikke-intensive virksomheder i perioden 2007-2010.
Henholdsvis 26,3 %, 22,5 %, 18,3 % og 19,2 % af forskellen i den årlige produktivitetsvækst på 2,4 procentpoint mellem IKT-intensive og IKT-ikke-IKT-intensive virksomheder kan forklares ved IKT-drevet produkt-, markedsførings-, proces- og organisatorisk innovation.
En kombination af produkt- og markedsføringsinnovation forklarer 32,5 % af forskellen i den årlige produktivitetsvækst på 2,4 procentpoint mellem IKT-intensive og IKT-ikke-intensive virksomheder.
Proces og organisatorisk innovation kan ikke forklare forskellen i den årlige produktivitetsvækst på 2,4 procentpoint mellem IKT-intensive og IKT-ikke-IKT-intensive virksomheder.
Ved brug af et supplerende datasæt finder vi, at:
Kombinationen af organisatoriske forandringer og implementering af IKT-integreret produktionsudstyr (i modsætning til f.eks. logistikudstyr) kan forklare 60 % af forskellen på 3,5 procent point i gennemsnitlig årlig produktivitetsvækst i perioden 2007-2010 mellem virksomheder, der gennemførte disse aktiviteter, og virksomheder, som ikke foretog nogen af delene.
Sammenhængen mellem IKT og produktivitetsvækst
Det er generelt accepteret, at IKT er en såkaldt ‘general purpose technology’, som skaber en bred platform for effektiv innovation i virksomhederne. IKT gør det lettere at udføre innovationsaktiviteter, for eksempel med hensyn til nye produkter, omkostningsreduktioner, forbedring af produktionsprocesser og værdikæder. Derudover er innovation på disse og andre områder også selvstændigt en vigtig kilde til produktivitetsvækst.
Den mekanisme, der sammenkæder IKT-investeringer og produktivitetsvækst, har ikke tidligere været undersøgt for danske virksomheder. Med udgangspunkt i en unik kombination af register- og spørgeskemadata for danske virksomheder analyserer vi i denne CEBR-rapport følgende hypotese:
Interaktionen mellem IKT-investeringer og innovationsaktivitet er en vigtig kilde til produktivitetsvækst i danske virksomheder.
Vi undersøger hypotesen ved at søge svar på to specifikke
spørgsmål:
Har IKT-intensitet betydning for innovationsaktiviteten i danske virksomheder?
Er samspillet mellem IKT-investeringer og
innovationsaktiviteter vigtigt for produktivitetsvæksten i danske virksomheder?
Analyse og resultater
I det første trin i analysen undersøger vi, om intensiv brug af IKT er forbundet med en højere sandsynlighed for at være engageret i de fire innovationsaktiviteter produktinnovation, procesinnovation, markedsføringsinnovation og organisatorisk innovation.
Vi kategoriserer virksomhederne i datasættet som IKT-intensive, hvis de tilhører den halvdel af virksomhederne i stikprøven, som havde de største IKT-udgifter per medarbejder i 2007. Modsat kategoriserer vi virksomheder som IKT-ikke-intensive, hvis de tilhører den halvdel af virksomhederne i stikprøven, som havde de laveste IKT-udgifter per medarbejder i 2007.
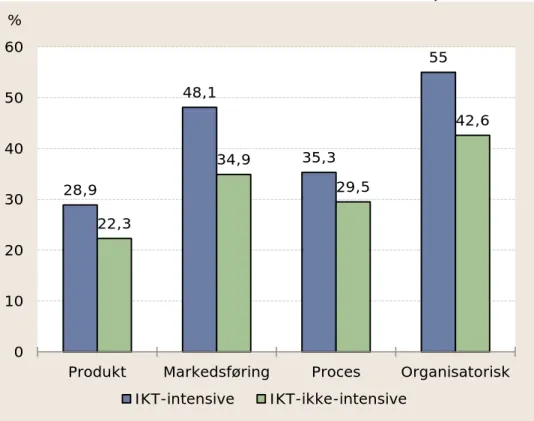
Som vist i figur S.1.1 nedenfor har IKT-intensive virksomheder en klart højere sandsynlighed for at være engageret i innovationsaktiviteter end IKT-ikke-intensive virksomheder.
FIGUR S.1.1 IKT-INTENSITET OG INNOVATIONSHYPPIGHED,2007
Note: De viste hyppigheder bygger på analyse af en stikprøve på 781 virksomheder. “IKT-passiv” omfatter de 390 virksomheder i stikprøven, som havde IKT-udgifter per medarbejder under median-niveauet i 2007. “IKT-intensiv” omfatter de 391 virksomheder i stikprøven, som havde IKT-udgifter per medarbejder på eller over median-niveauet in 2007.
Kilde: CEBR-analyse på register- og spørgeskemadata fra Danmarks Statistik.
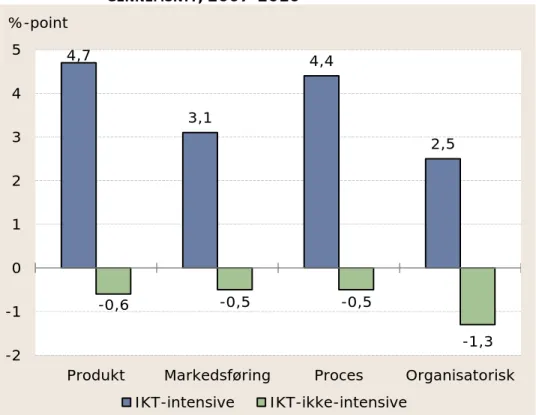
Figur S.1.2 nedenfor viser, at IKT-intensive virksomheder har højere produktivitetsvækst end IKT-ikke-intensive virksomheder. For eksempel viser de to søjler længst til venstre i figuren, at IKT-intensive virksomheder, der er engageret i produktinnovation, havde en gennemsnitlig, årlig produktivitetsvækst i perioden 2007 til 2010, der var 4,7 procentpoint højere end produktivitetsvæksten i stikprøven som helhed. De IKT-ikke-intensive virksomheder havde på den anden side en gennemsnitlig, årlig produktivitetsvækst i samme periode, der var 0,6 procentpoint lavere end produktivitetsvæksten i stikprøven som helhed. Figuren viser tilsvarende resultater for de tre øvrige innovationsaktiviteter.
Samlet set havde de IKT-intensive virksomheder i gennemsnit 2,4 procentpoint højere, årlig produktivitetsvækst end de IKT-ikke-intensive virksomheder i perioden 2007-2010.
28,9 48,1 35,3 55 22,3 34,9 29,5 42,6 0 10 20 30 40 50 60
Produkt Markedsføring Proces Organisatorisk %
FIGUR S.1.2 IKT-INTENSITET I 2007 OG GENNEMSNITLIG, ÅRLIG PRODUKTIVITETSVÆKST I FORHOLD TIL SAMLET GENNEMSNIT,2007-2010
Note: De viste vækstrateforskelle bygger på en stikprøve på 781 virksomheder. Produktivitetsvækstraterne er opgjort relativt til det samlede stikprøvegennemsnit på -3,3 %.
Kilde: CEBR-analyse på register- og spørgeskemadata fra Danmarks Statistik.
Tabel S.1.1 viser, at IKT-drevne innovationsaktiviteter kan forklare en væsentlig andel af mervæksten i produktivitet i gruppen af IKT-intensive virksomheder relativt til gruppen af IKT-ikke-IKT-intensive virksomheder (resten af forskellen skyldes forskelle i virksomheds-størrelse, uddannelsessammensætning af virksomhedernes arbejdskraft etc.). 4,7 3,1 4,4 2,5 -0,6 -0,5 -0,5 -1,3 -2 -1 0 1 2 3 4 5
Produkt Markedsføring Proces Organisatorisk %-point
TABEL
S.1.1 AVIRKSOMHEDERNDEL AF MERVÆKST I PRODUKTIVITET FOR , DER KAN FORKLARES AF IKT-IKT-INTENSIVE DREVET
INNOVATION Produkt-innovation Markedsførings-innovation Proces-innovation Organisations-innovation Andel 26,3 %*** 22,5 %*** 18,3 %*** 19,2 %**
Note: Baseret på en stikprøve på 781 virksomheder. *** angiver, at den pågældende andel er beregnet på grundlag af estimater, der er statistisk signifikante på 1 %-niveau. ** angiver, at den pågældende andel er beregnet på grundlag af estimater, der er statistisk signifikante på 5 %-niveau.
Kilde: CEBR-analyse på register- og spørgeskemadata fra Danmarks Statistik.
Interaktion mellem innovationsaktiviteter
Hvis en virksomhed er engageret i én type innovationsaktivitet, så er det overvejende sandsynligt, at den også er engageret i én eller flere andre innovationsaktiviteter. Effekten af de individuelle innovations-aktiviteter kan derfor ikke opgøres uafhængigt af hinanden.
For at tage højde for mulige samspilseffekter mellem innovationsaktiviteterne grupperer vi de fire innovationsaktiviteter i to ny kategorier:
Efterspørgselsinnovation, der omfatter produkt- og
markedsføringsinnovation
Udbudsinnovation, der omfatter proces- og organisatorisk
innovation
De to søjler længst til venstre i figur S.1.3 nedenfor viser, at IKT-intensive virksomheder, der var engageret i produkt- og markedsføringsinnovation, havde en gennemsnitlig, årlig produktivitetsvækst i perioden 2007 til 2010, der var 3,6 procentpoint
højere end produktivitetsvæksten i stikprøven som helhed. De
IKT-ikke-intensive virksomheder, der var engageret i produkt- og markedsføringsinnovation, havde på den anden side en gennemsnitlig, årlig produktivitetsvækst i perioden 2007 til 2010 der var 1,1 procentpoint lavere end den gennemsnitlige produktivitetsvækst i hele stikprøven.
De to søjler længst til højre i figur S.1.3 viser, at IKT-intensive virksomheder, der var engageret i proces- og organisatorisk innovation, havde en gennemsnitlig, årlig produktivitetsvækst i perioden 2007 til 2010, der var 1,5 procentpoint højere end produktivitetsvæksten i datasættet som helhed. De IKT-ikke-intensive virksomheder, der var engageret i proces- og organisatorisk innovation, havde til gengæld en gennemsnitlig, årlig
produktivitetsvækst i perioden 2007 til 2010 der var 1,7 procent point
lavere end produktivitetsvæksten i hele datasættet.
FIGUR S.1.3 IKT-INTENSITET 2007 OG GENNEMSNITLIG, ÅRLIG PRODUKTIVITETSVÆKST I FORHOLD TIL DEN GENNEMSNITLIGE PRODUKTIVITETSVÆKST I STIKPRØVEN
2007-2010
Note: De viste vækstrateforskelle bygger på en stikprøve på 781 virksomheder. Produktivitetsvækstraterne er opgjort relativt til det samlede stikprøvegennemsnit på -3,3 %.
Kilde: CEBR-analyse på register- og spørgeskemadata fra Danmarks Statistik.
Vores analyse viser, at IKT-drevet efterspørgselsinnovation kan forklare en væsentlig andel af mervæksten i produktivitet i gruppen af IKT-intensive virksomheder engageret i efterspørgselsinnovation relativt til gruppen af IKT-ikke-intensive virksomheder engageret i efterspørgselsinnovation. Den første kolonne i tabel S.1.2 nedenfor viser, at kombinationen af produkt- og markedsføringsinnovation forklarer 32,5 % af mervæksten i produktivitet på 2,4 procentpoint i gruppen af intensive virksomheder i forhold til gruppen af IKT-ikke-intensive virksomheder. 3,6 1,5 -1,1 -1,7 -2 -1 0 1 2 3 4
Produkt og Markedsføring Proces og Organisatorisk %-point
TABEL S.1.2 ANDEL AF MERVÆKST I PRODUKTIVITET FOR IKT-INTENSIVE VIRKSOMHEDER, DER KAN FORKLARES AF IKT-DREVET INNOVATION
Produkt,
Markedsføring Proces, organisation
Andel 32,5 %*** 14,6 %
Note: Baseret på en stikprøve på 781 virksomheder. *** angiver, at den pågældende andel er beregnet på grundlag af estimater, der er statistisk signifikante på 1 %-niveau. ** angiver, at den pågældende andel er beregnet på grundlag af estimater, der er statistisk signifikante på 5 %-niveau.
Kilde: CEBR-analyse på register- og spørgeskemadata fra Danmarks Statistik.
Den anden kolonne i tabellen viser, at IKT-drevne udbudsinnovationsaktiviteter kun kan forklare en lille andel (der statistisk set ikke er forskellig fra 0) af produktivitetsmervæksten blandt IKT-intensive virksomheder, der er engageret i udbudsinnovation, i forhold til IKT-ikke-intensive virksomheder, der ligeledes er engageret i udbudsinnovation.
For at undersøge denne overraskende mangel på effekt af IKT-drevet udbudsinnovation lidt nærmere, inddrager vi en spørgeskemaundersøgelse fra 2007, hvor 2.840 virksomheder har svaret på spørgsmål om implementering af teknologiske og organisatoriske ændringer.
Ved hjælp af dette datasæt finder vi, at IKT-drevet udbudsinnovation faktisk bidrager til produktivitetsvækst. Bidraget til produktivitets-væksten kommer dog primært fra implementering af nye IKT-integrerede maskiner, der bruges i selve produktionsprocessen fremfor i forbindelse med logistik, distribution osv.
Produktivitetseffekten fra IKT-drevet udbudsinnovation er særlig stor i virksomheder, der kombinerer implementering af nye IKT-integrerede maskiner med organisatoriske ændringer. Denne kombination kan forklare 60 % af forskellen på 3,5 procent point i gennemsnitlig årlig produktivitetsvækst i perioden 2007-2010 mellem på den ene side virksomheder, der både investerede i nye IKT-integrerede maskiner og gennemførte organisatoriske ændringer, og på den anden side virksomheder, der ikke gjorde nogen af delene.
2
Executive summary
This CEBR report presents new evidence which suggests that investments in Information and Communication Technology (ICT) further productivity growth in Danish firms by stimulating innovation activities.
BOX S.2.1 MAIN RESULTS
Analysis using our main data sample shows that:
ICT intensive firms are more often engaged in innovative activities than ICT non-intensive firms. Across 4 innovation activities (product, marketing, process, and organizational innovation), ICT intensive firms had between 5.8 and 12.4 percentage points higher probability of being engaged in the specific innovation activity than ICT non-intensive firms in 2007. ICT intensive firms had on average 2.4 percentage point higher annual productivity growth than ICT non-intensive firms over the period 2007 to 2010.
Analyzed individually, ICT induced product, marketing, process, and organizational innovation explain 26.3 %, 22.5 %, 18.3 % and 19.2 %, respectively, of the actual 2.4 percentage point productivity growth difference between the ICT intensive group and the ICT non-intensive group.
A combination of product and marketing innovation explains 32.5 % of the 2.4 percentage point excess productivity growth of ICT intensive firms relative to ICT non-intensive firms.
A combination of process and organizational innovation does not explain any of the excess productivity growth of ICT intensive firms relative to ICT non-intensive firms.
Further analysis using an alternative data sample shows that: A combination of organizational changes and implementation of
machinery embedding ICT technology specifically related to the production process (rather than e.g. logistics) explains 60 % of the actual 3.5 percentage point productivity growth difference over the period 2007-2010 between firms who both invested in new machines embedding ICT technology and introduced organizational changes and firms who did neither.
Linking ICT and productivity growth
It is widely accepted that ICT is a ‘general purpose technology’ which creates a basis for effective business innovation. ICT facilitates innovation in firms with respect to for example new products, costs reductions, process streamlining and value chain improvements. Innovation, in turn, is a significant contributor to productivity growth. The strength of the ICT-to-productivity-growth mechanism has not been evaluated in a Danish context before. This CEBR report utilizes a unique combination of register and survey data for Danish firms to analyze a hypothesis which states that:
The interaction between new technology in the form of ICT and innovation is an important driver of productivity growth in Danish firms.
We investigate the stated hypothesis by obtaining answers to the following specific questions:
Is ICT intensity an important driver of innovation in Danish firms?
Is the interaction between ICT investments and innovation activities important for the productivity of Danish firms?
Analysis and results
In the first step of the analysis we investigate whether intensive use of ICT is related to higher probability of being engaged in the following four innovation activities: product innovation, process
innovation, marketing innovation, and organizational innovation.
We categorize the firms in the data set as ICT intensive if they belonged to the 50 % of the sample who spent the most on ICT per employee in 2007. Conversely, we categorize firms as ICT
non-intensive if they were part of the 50 % of the sample who spent the
least on ICT per employee.
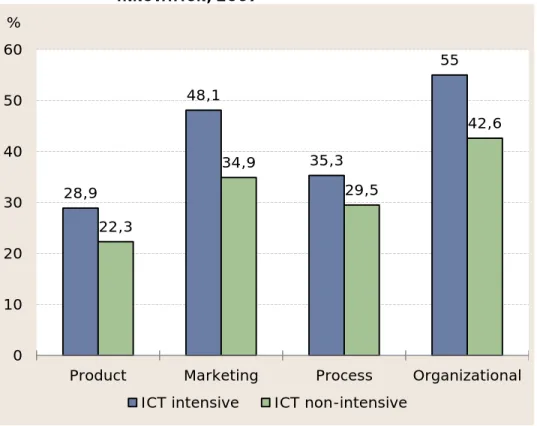
As shown in Figure ES.2.1 below, ICT intensive firms are clearly more
FIGURE ES.2.1 ICT INTENSITY AND SHARE OF FIRMS ENGAGED IN INNOVATION,2007
Notes: The results are based on analysis of a sample of 781 firms. “ICT non-intensive” refers to those 390 firms in the sample who had lower than median ICT expenditure per employee in 2007. “ICT intensive” refers to those 391 firms in the sample who had median ICT expenditure per employee in 2007 or higher.
Source: Statistics Denmark and CEBR analysis.
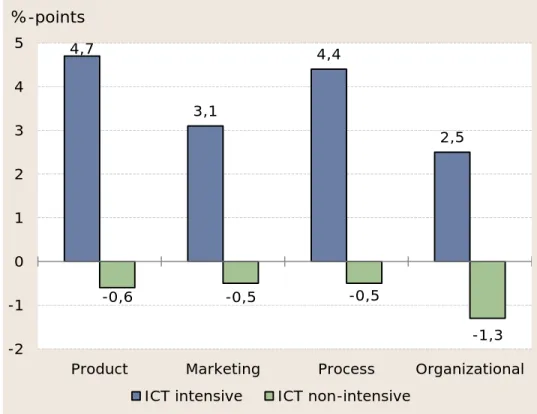
Figure ES.2.2 below illustrates that ICT intensive firms have higher
productivity growth than ICT non-intensive firms. For example, the
first two columns in the figure show that ICT intensive firms engaged in product innovation had 4.7 percentage point higher average annual productivity growth than the firms in the data set as a whole, while ICT non-intensive firms engaged in product innovation had 0.6 percentage point lower productivity growth than the firms in the data set as a whole. The figure shows qualitatively similar results with respect to the other three innovation activities.
Across the whole sample of firms, ICT intensive firms had on average 2.4 percentage point higher annual productivity growth than IKT non-intensive firms over the period 2007-2010
28,9 48,1 35,3 55 22,3 34,9 29,5 42,6 0 10 20 30 40 50 60
Product Marketing Process Organizational
%
FIGURE ES.2.2 ICT INTENSITY IN 2007 AND AVERAGE ANNUAL PRODUCTIVITY GROWTH RELATIVE TO TOTAL SAMPLE GROWTH 2007-2010
Notes: The analysis is based on a sample of 781 firms. Productivity growth rates are measured relative to the average total sample productivity growth rate, which equals -3.3 %.
Source: Statistics Denmark and CEBR analysis.
Table ES.2.1 shows that ICT induced innovation activities can explain
a significant part of the 2.4 percentage points excess productivity growth of the ICT intensive firms relative to the ICT non-intensive firms (the rest being accounted for by differences in size, education
mix of employees etc.).
TABLE ES.2.1 SHARE OF EXCESS PRODUCTIVITY GROWTH OF ICT INTENSIVE FIRMS EXPLAINED BY ICT INDUCED INNOVATION
Product
innovation innovation Marketing innovation Process Organizational innovation
Share 26.3 %*** 22.5 %*** 18.3 %*** 19.2 %**
Notes: The results are based on analysis of a sample of 781 firms. *** refers to shares calculated on the basis of estimates that are statistically significant at the 1 % level. ** refers to share calculated on the basis of estimates that are statistically significant at the 5 % level. Source: Statistics Denmark and CEBR analysis.
4,7 3,1 4,4 2,5 -0,6 -0,5 -0,5 -1,3 -2 -1 0 1 2 3 4 5
Product Marketing Process Organizational
%-points
Innovation interactions
It is very likely that if a firm is engaged in one line of innovation activity it will also be engaged in one or more of the other innovation activities. Therefore, the effects of the individual innovation activities cannot be fully separated from each other.
To account for the possibility of synergies between innovation activities we group the four innovation categories into two new categories;
Demand innovation, which covers product and marketing
innovation activities
Supply innovation, which covers process and organizational
innovation activities
The first two columns in Figure ES.2.3 below show that ICT intensive firms engaged in product and marketing innovation had 3.6 percentage points higher average annual productivity growth over the period 2007-2010 than the firms in the data set as a whole, while ICT non-intensive firms engaged in product and marketing innovation had 1.1 percentage points lower productivity growth over the period 2007-2010 than the firms in the data set as a whole.
The last two columns in Figure ES.2.3 show that ICT intensive firms engaged in process and organizational innovation had 1.5 percentage points higher average annual productivity growth over the period 2007-2010 than the firms in the data set as a whole, while ICT non-intensive firms engaged in process and organizational innovation had 1.7 percentage point lower productivity growth over the period 2007-2010 than the firms in the data set as a whole.
FIGURE ES.2.3 ICT INTENSITY 2007 AND AVERAGE ANNUAL PRODUCTIVITY GROWTH RELATIVE TO TOTAL SAMPLE GROWTH 2007-2010
Notes: The analysis is based on a sample of 781 firms. Productivity growth rates are measured relative to the average total sample productivity growth rate, which equals -3.3 %.
Source: Statistics Denmark and CEBR analysis.
We find that ICT induced demand innovation activities can explain a
significant part of the excess productivity performance of ICT intensive firms engaged in demand innovation relative to ICT non-intensive firms engaged in demand innovation. The first column in
Table ES.2.2 below shows that the product and marketing innovation
combination explains 32.5 % of the 2.4 percentage point excess productivity growth of the ICT intensive firms relative to the ICT non-intensive firms. 3,6 1,5 -1,1 -1,7 -2 -1 0 1 2 3 4
Product and Marketing Process and Organizational %-points
TABLE ES.2.2 SHARE OF EXCESS PRODUCTIVITY GROWTH OF ICT INTENSIVE FIRMS EXPLAINED BY ICT INDUCED INNOVATION
Product,
Marketing Process, organizational
Share 32.5 %*** 14.6 %
Notes: The results are based on analysis of a sample of 781 firms. *** refers to share calculated on the basis of estimates that are statistically significant at the 1 % level.
Source: Statistics Denmark and CEBR analysis.
The second column in the table shows that ICT induced supply
innovation activities can only explain a small and statistically insignificant part of the 2.4 percentage point excess productivity performance of ICT intensive firms engaged in supply innovation relative to ICT non-intensive firms engaged in supply innovation.
In order to investigate the surprising lack of an effect of ICT induced supply innovation on productivity growth a bit more closely, we introduce a 2007 survey of 2,840 firms concerning implementation of technological changes and organizational changes, respectively. From this extended sample we find that productivity gains from ICT induced supply innovation do exist, but the gains are primarily related to implementation of machinery embedding ICT technology which is used specifically in the production process rather than in logistics, distribution etc.
The productivity effect is even stronger for firms that combined new machines embedding ICT technology and organizational changes. In fact, this combination accounts for 60 % of the actual 3.5 percentage point productivity growth difference over the period 2007-2010 between firms who both invested in new machines embedding ICT technology and introduced organizational changes, and the group of firms who did neither.
3
Overview
This chapter provides a non-technical and easy to read overview of the implementation of this project, i.e. the motivation for and set-up of the hypotheses analyzed, the data used in the analyses, the approach used for the analyses of the stated hypotheses, and the results obtained. Full results and technical details are provided in the following chapters.
3.1
Introduction
A high standard of living in Denmark depends on the existence of a plentiful supply of competitive and productive firms who create a large pool of high paying jobs.
Product and marketing innovation result in new and better products that can obtain better prices in markets, while process and organizational innovation results in more efficient production processes that lower production costs. Thus, innovation is an important determinant of competitive advantage for firms and productivity growth for society as a whole.
A widely held hypothesis holds that information and communications technology (ICT) creates a basis for effective innovation activities. Until now, this hypothesis has not been tested on Danish data. This CEBR report utilizes a unique combination of register- and survey data for Danish firms in order to remedy this omission.
The report documents that the interaction between ICT investments and innovation activities is an important driver of productivity growth. Specifically, we document that ICT intensive firms in general obtain a large productivity growth effect through increased potential for a combination of product and marketing innovation. We also document that a combination of organizational innovation and a specific type of ICT investments in process innovation, i.e. automation of the production process, results in higher productivity growth.
3.2
Hypothesis under investigation
Theoretical links between ICT, innovation, and productivity growth
One possible mechanism through which digitalization impacts innovation activity and productivity growth is that digitalization leads
to product and process innovation which results in new and better products and processes. Further, digitalization may cause productivity growth through organizational innovation, for example with respect to management techniques and business models.
On a more fundamental level, the argument is that digitalization changes the way firms work with innovation, and that this change creates opportunities for permanent increases in innovation activities and productivity growth (Brynjolfsson, 2011).
Gretton, Gali and Parham (2004) for example emphasize that ICT investments are a determinant of innovation. Their argument is that ICT is a so called 'general purpose technology' which provides a platform for innovation. Therefore, ICT makes it relatively easier and cheaper to develop new productivity enhancing innovation.
ICT is thus a valuable facilitator of innovation in firms as ICT makes it possible to reduce transaction costs, improve internal processes, improve coordination with suppliers, slice the value chain both horizontally, vertically and geographically, and increase diversification (Koellinger, 2005).
Hypothesis under investigation
On the basis of these proposed theoretical mechanisms in the academic literature we will analyze a hypothesis which states that:
The interaction between new technology in the form of ICT and innovation is an important driver of productivity growth in Danish firms.
We investigate the stated hypothesis by obtaining answers to the following specific questions:
Is ICT intensity an important driver of innovation in Danish firms?
Is the interaction between ICT investments and innovation activities important for the productivity of Danish firms?
3.3
Data used in the analyses
Primary data set
Based on the hypotheses under investigation our main interest is in data on ICT expenditure, innovation activity and productivity growth. We have therefore constructed a data set with information on firm ICT
expenditure per employee in 2007, four possible innovation activities within Danish firms in 2007 (product innovation, process innovation, marketing innovation, and organizational innovation), and average annual productivity growth for each firm over the period 2007-2010. The numbers on ICT expenditure and the information on innovation activity within each firm are gathered from two separate surveys conducted by Statistics Denmark, while the data on productivity growth are constructed from firm register data also from Statistics Denmark. Combining the survey and register data we can construct a sample of 781 firms which we will use for most of the statistical analyses.
Alternative data set
We also use data from a third survey conducted by Statistics Denmark together with register data to construct a data set with 2,840 firms that we use to perform some robustness checks of some of the results obtained with our main data set.
The main idea in the statistical analyses is to control for the influence of other firm characteristics that may determine innovation potential and productivity growth in order to isolate the relationship between ICT expenditure, innovation activity, and productivity growth. In addition to the data on the main variables, we therefore have data on firm characteristics that may also influence innovation activity and productivity growth such as firm size, exporter status etc.
3.4
Approach to the analyses
This section describes our approach to the analyses in this report. The results obtained from the analyses are discussed in the following sections.
ICT intensive and ICT non-intensive firms
With respect to the presentation of the results of the analyses, the main idea is to construct two separate groups of firms according to their level of ICT expenditure per employee and then compare these two groups with respect to innovation activity and productivity growth.
Specifically, we sort the firms according to ICT expenditure per employee and find the median firm with respect to amount of ICT expenditure per employee in 2007, i.e. the firm which had higher ICT
expenditure than one half of the firms in the sample and lower ICT expenditure than the other half of the firms in the sample.
We then construct two groups of firms: One group with those firms with lower ICT expenditure per employee than the median firm and one group with those firms with higher ICT expenditure per employee than the median firm (the median firm itself is placed in the high ICT expenditure group) so that there are 390 firms in the ICT non-intensive group and 391 firms in the ICT non-intensive group.
Descriptive statistics
We first use basic descriptive statistics to describe the relationship between ICT investments, innovation activities, and growth performance within these two groups and the differences in these relationships between the two groups.
Two step procedure for individual innovation activities
We then use a two step statistical procedure to investigate whether we can attribute part of any found difference in growth performance between these two groups to differences in the average ICT expenditure per employee and innovation activity amongst them. First, we investigate whether intensive use of ICT leads to a more pronounced tendency for engaging in one or more of the four different innovation activities: Product innovation, process innovation, marketing innovation, and organizational innovation.
In order to analyze the relationship between ICT investments and innovation activities we utilize a statistical model – a so called probability model - which estimates a firm’s innovation tendency based on observable firm characteristics such as ICT investments, size, education mix of employees etc.
Second, we investigate whether differences in innovation tendency leads to differences in productivity growth. In order to analyze the relationship between innovation tendency and productivity growth, we utilize another statistical model which explains a firm’s productivity growth based on the estimated innovation tendency from the first step in the statistical analysis. As for the analyses in the first step, we control for the influence of other observable factors such as the size of the firm’s capital stock and education mix of the employees.
Two step procedure for combinations of innovation activities
The results from the two step procedure above can be criticized for not taking into account that the firm’s choices of which innovation activities to engage in are at least to some extent interrelated which implies that we cannot fully separate the effects of the individual innovation activities from each other.
We therefore repeat the two step statistical procedure with the only difference that we this time around use a so called bivariate probability model in the first step which is able to take into account this interaction between the choices of different innovation activities. Therefore, using the bivariate probability model we can estimate the tendency for a firm to engage in different combinations of innovation activities rather than just the tendency to engage in individual innovation activities.
We can then use the results from the bivariate probability model in the second step to investigate whether differences in the tendency to engage in different combinations of innovation activities leads to differences in productivity growth.
Further exploration using alternative data
Third, we use the alternative data set in order to further explore one particular aspect of the ICT, innovation, productivity growth nexus, namely the relationship between a particular type of ICT investment, process and organizational innovation, and productivity growth.
3.5
Main results
For easy reference, this section summarizes the main results. The following sections then elaborate on the main conclusions listed here. Using descriptive statistics to compare the ICT intensive group of firms with the ICT non-intensive group of firms we find that:
ICT intensive firms are more often engaged in innovative activities than ICT non-intensive firms.
ICT intensive firms have higher productivity growth than ICT non-intensive firms.
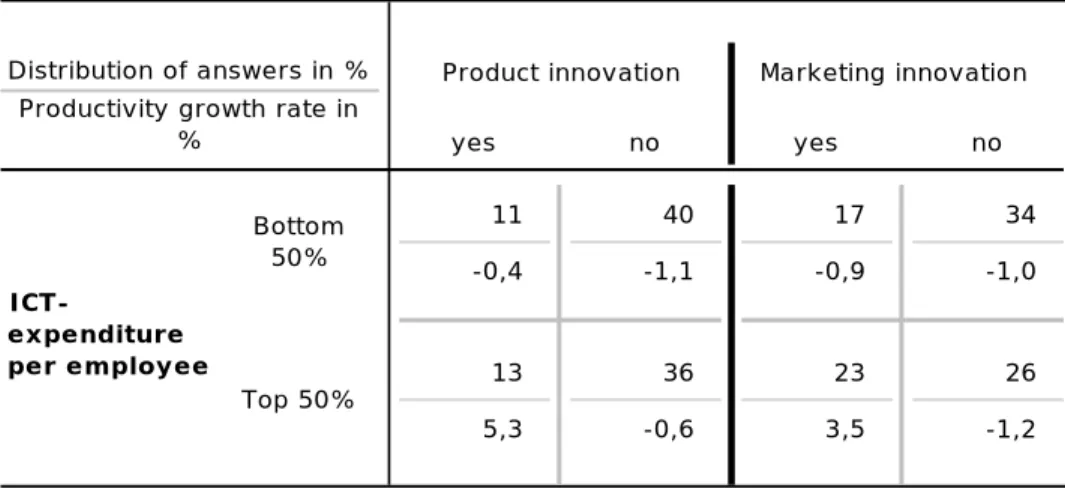
ICT expenditure is more important for productivity growth for firms who engage in product innovation than for firms who do not engage in innovation activity.
In the first round of our two step statistical procedure to control for various firm characteristics that influence productivity growth, we find that:
ICT induced product, marketing, process, and organizational innovation explain 26.3 %, 22.5 %, 18.3 % and 19.2 %, respectively, of the actual 2.4 percentage point productivity growth difference between the ICT intensive group and the ICT non-intensive group.
In the second round of our two step statistical procedure to control for various firm characteristics that influence productivity growth, we find that:
The combination of product and marketing innovation explains 32.5 % of the actual 2.4 percentage point productivity growth difference between the ICT intensive group and the ICT non-intensive group.
Process and organizational innovation do not explain any of the excess productivity growth of ICT intensive firms relative to ICT non-intensive firms.
Using the alternative data sample to investigate the effect of organizational innovation and a more narrowly defined type of process innovation on productivity, we find that:
A combination of ICT induced organizational changes and process innovation defined as the implementation of machinery embedding ICT technology used specifically in the production process (rather than in logistics, distribution etc.) explains 60 % of the actual productivity growth difference between firms who both invested in new machines embedding ICT technology and introduced organizational changes and firms who did neither.
3.6
The case of product innovation
ICT and product innovation
In order to present the results as clearly as possible we focus on the most important results. The full array of results and technical details about how they are obtained can be found in the following chapters.
Here we present the case of the relationship between ICT investments and product innovation. Chapter 4 provides full results for all four innovation types.
In Table 3.1 below we use the construction with one group of ICT non-intensive firms and one group of ICT intensive firms to show the relationship between ICT expenditure and product innovation activity within the firms in our sample.
TABLE 3.1 ICT INTENSITY AND PRODUCT INNOVATION 2007
Engaged in product innovation
Share of firms Yes No Total
ICT non-intensive 10.7 % 39.3 % 50.0 %
ICT intensive 13.7 % 36.3 % 50.0 %
Total 24.4 % 75.6 % 100.0 %
Notes: Based on a sample of 781 firms. The table shows the relationship between ICT expenditure per employee and product innovation activity. “ICT non-intensive” refers to those 390 firms in the sample who had lower than median ICT expenditure per employee in 2007. “ICT intensive” refers to those 391 firms in the sample who had median ICT expenditure per employee in 2007 or higher.
Source: Statistics Denmark and CEBR analysis.
The table shows that 21.4 % of the firms in the ICT non-intensive group (i.e. 10.7 % of the firms in the full sample) were engaged in product innovation, while 27.4 % of the firms in the ICT intensive group (i.e. 13.7 % of the firms in the full sample) were engaged in product innovation. This implies a 6.0 percentage point difference in product innovation activity between the two groups of firms.
ICT, product innovation, and productivity growth
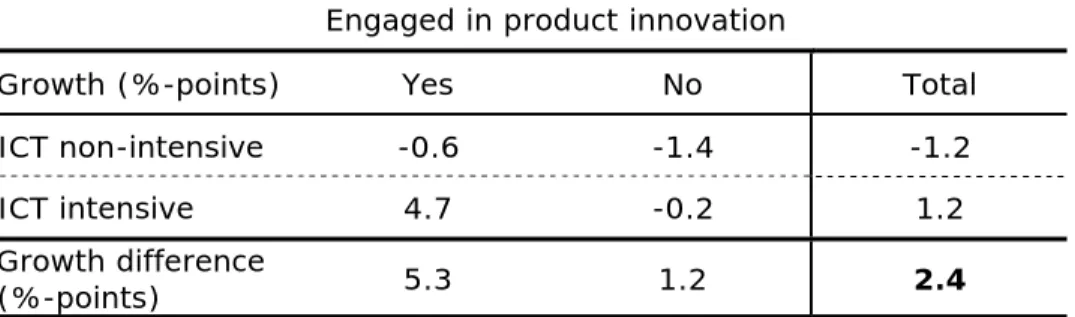
Table 3.2 below shows there was a 2.4 percentage point difference in average productivity growth between the ICT intensive and ICT non-intensive groups over the period 2007-2010. In our statistical analyses a main objective will be to find out how much of this 2.4 percentage point difference can be explained by ICT induced differences in innovation tendency between the two groups of firms.
Table 3.2 ICT INTENSITY, PRODUCT INNOVATION, AND UNADJUSTED PRODUCTIVITY GROWTH
Engaged in product innovation
Growth (%-points) Yes No Total
ICT non-intensive -0.6 -1.4 -1.2
ICT intensive 4.7 -0.2 1.2
Growth difference
(%-points) 5.3 1.2 2.4
Notes: Based on a sample of 781 firms. The average growth rate for the whole sample is -3.3 percentage points. Growth rates are measured relative to the total sample growth rate. “ICT non-intensive” refers to those 390 firms in the sample who had lower than median ICT expenditure per employee in 2007. “ICT intensive” refers to those 391 firms in the sample who had median ICT expenditure per employee in 2007 or higher.
Sources: Statistics Denmark and CEBR analysis.
The table also shows that firms who engaged in product innovation in 2007 had higher average annual productivity growth in 2007-2010 than firms who did not engage in product innovation.
An interesting finding in the table is that the growth differential
between the ICT intensive group and the ICT non-intensive group is larger for firms who engage in product innovation – 5.3 percentage
points - than for firms who did not engage in product innovation in 2007 – 1.2 percentage points.
This is a clear indication of complementarities between innovation activity and ICT expenditure with respect to productivity growth, i.e. that ICT expenditure is more important for productivity growth for firms who engage in product innovation than for firms who do not engage in innovation activity.
ICT expenditure and innovation activity is correlated with other firm characteristics, such as size, industry, export status, educational mix of the firm workforce, which also determine productivity performance and which may account for the pattern that we see in the data. Therefore, we cannot use the pattern in Table 3.2 to say with certainty that there are complementarities between ICT expenditure and innovation activity.
Marketing, process, and organizational innovation
As detailed in Chapter 4, the pattern in the data on the relationship between ICT intensity, the other three innovation activities – marketing, process, and organizational innovation, respectively – and productivity growth are qualitatively similar to the results for product innovation. Specifically, only firms who engage in the specific
innovation activity and are in the ICT intensive group have higher than average annual productivity growth.
And as is the case for product innovation, there is also a clear indication of complementarities between innovation activity and ICT expenditure with respect to productivity growth for the other innovation activities, as ICT expenditure is more important for productivity growth for firms who engage in a specific innovation activity than for firms who do not engage in the innovation activity.
Innovation potential and adjusted productivity growth
To find how much of the 2.4 percentage point growth difference between the ICT intensive group and the ICT non-intensive group can be attributed to ICT expenditure and innovation activity, we start by estimating the strength of the relationship between ICT expenditure per employee and innovation activity while we are careful to control for the effects of firm size, industry, exporter status and educational mix of the firm workforce.
Combining the obtained strength of the relationship with the numbers for ICT expenditure per employee for the two groups, we can find the innovation tendency for the two groups and thus measure the share of the difference between the average innovation tendencies for the two groups that can be attributed to differences in ICT expenditure. The results are shown in Table 3.3 below.
We find that there is a 6.3 percentage point difference in product innovation tendency between the two groups that can be attributed to differences in ICT expenditure.
TABLE 3.3 ICT INTENSITY AND PRODUCT INNOVATION TENDENCY
Product innovation
Innovation tendency for ICT non-intensive 20.9 % Innovation tendency for ICT intensive 27.2 % Difference in innovation potential (%-points) 6.3
Notes: Based on a sample of 781 firms. “ICT non-intensive” refers to those 390 firms in the sample who had lower than median ICT expenditure per employee in 2007. “ICT intensive” refers to those 391 firms in the sample who had median ICT expenditure per employee in 2007 or higher.
The estimated differences in innovation potential for marketing, process, and organizational innovation activities are 8.9 percentage points, 6.1 percentage points and 8.6 percentage points, respectively (see Chapter 3).
To find out what these differences in innovation tendencies related to differences in ICT expenditure imply for productivity growth differences between the two groups, we estimate growth regressions where we in separate regressions estimate the effects of each of the innovation tendencies for the four innovation activities on firm productivity growth from 2007 to 2010.
The result for product innovation is shown in Table 3.4 below. The first row shows a predicted 0.63 percentage point difference in productivity growth from ICT induced product innovation. Thus, ICT
induced product innovation explains 26.3 % of the actual 2.4 percentage point productivity growth difference between the ICT intensive group and the ICT non-intensive group.
TABLE 3.4 GROWTH DIFFERENCE BETWEEN “ICT NON-INTENSIVE”-GROUP AND “ICT INTENSIVE”-GROUP FROM ICT INDUCED PRODUCT INNOVATION
Product innovation
Growth difference top-bottom explained
by ICT induced innovation (%-points) 0.63*** Growth difference top-bottom in
unadjusted data (%-points) 2.4
Share of growth difference explained by
ICT induced innovation potential 26.3 %***
Notes: Based on a sample of 781 firms. “ICT non-intensive” refers to those 390 firms in the sample who had lower than median ICT expenditure per employee in 2007. “ICT intensive” refers to those 391 firms in the sample who had median ICT expenditure per employee in 2007 or higher. *** refers to numbers calculated on the basis of estimates that are statistically significant at the 1 % level.
Source: Statistics Denmark and CEBR analysis.
The estimated average annual productivity growth differences induced by ICT potential for marketing, process, and organizational innovation activities are 0.54 percentage points, 0.44 percentage points and 0.46 percentage points, respectively (see Chapter 4). Thus, ICT induced
marketing, process, and organizational innovation explain 22.5 %, 18.3 % and 19.2 %, respectively, of the actual 2.4 percentage point productivity growth difference between the ICT intensive group and the ICT non-intensive group.
3.7
Demand and Supply innovation
The results above are established by analysis of each of the four innovation activities separately. The results can be criticized for not taking into account that if a firm is engaged in one innovation activity there is a tendency for it to also being engaged in one or more of the other innovation activities which implies that we cannot fully separate the effects of the individual innovation activities from each other. We therefore modify our approach slightly in order to account for this possibility of interrelated effects. A firm can become more productive – i.e. raise the value of a unit of production relative to the cost of a unit of production - in two basic ways: Through increased demand which allows the firm to charge higher prices for any given number of units of its products or through lower supply costs of any given number of units of its products.
The four innovation activities of the firms that are surveyed in our data can be thus grouped into two distinct categories which we label
Demand innovation and Supply innovation:
Product and Marketing innovation aim to affect customers’ demand for the firms’ output. In economists’ terms, Product and Marketing innovation aim to shift the demand curve that the firm faces outwards, i.e. to increase the demand for any given price that the firm demands for its products. For the purposes of this report, we therefore group Product and
Marketing innovation together under the heading “Demand Innovation”.
Process and Organizational innovation aim to affect the efficiency with which the firm is able to satisfy customer’s demand for the firms’ output. Process and Organizational innovation thus aim to shift the supply curve of the firm downwards, i.e. to decrease the cost of supplying any given amount of products to customers. For the purposes of this report, we therefore group Process and Organizational
innovation together under the heading “Supply Innovation”.
The statistical analysis in Junge, Severgnini and Sørensen (2012b) confirms that demand innovation activities and supply innovation activities also empirically are two distinct, non-overlapping categories. Based on these considerations we analyze the relationship between ICT expenditure, the two demand innovation activities, and productivity growth together and the relationship between ICT
expenditure, the two supply innovation activities, and productivity growth together.
The case of demand innovation
With two innovation activities under consideration simultaneously, the statistical procedure used to find the relationship between ICT investments and innovation activity is in principle the same as for only one innovation activity. But the procedure gets a little bit messier as firms do not choose between either engaging in a specific innovation activity or not but rather choose between four options, two for each of the two innovation activities under consideration simultaneously. With respect to demand innovation they can choose to engage in:
Both product and marketing innovation
Product innovation but not marketing innovation Marketing innovation but not product innovation Neither product innovation or marketing innovation
We now look at the two demand innovation components – product innovation and marketing innovation – together. We group the firms in the sample into four types according to whether they were engaged in product innovation in 2007 or not and whether they were engaged in marketing innovation in 2007 or not. Together with the split of the firms into those with above median and below median ICT expenditure per employee, this gives us 8 firm categories.
ICT, demand innovation, and unadjusted productivity
The unadjusted growth performance of these 8 firm groups is displayed in Table 3.5 below. We see a clear indication of complementarities between ICT expenditure and innovation activity as the difference in average annual productivity growth between the top and bottom groups according to ICT expenditure increases with innovation activity: more active firms with respect to innovation have a higher growth rate in absolute terms but also in relative terms if they are in the ICT intensive group. Of course, the total growth differential between the two groups is still 2.4 percentage points.
TABLE 3.5 DEMAND INNOVATION AND UNADJUSTED GROWTH FOR “ICT NON-INTENSIVE”-GROUP AND “ICT INTENSIVE”-GROUP
Growth
(%-points) Product and marketing
Product but not marketing Not product but marketing Not product and not marketing Total ICT non-intensive 0.7 1.0 -1.7 -1.3 -1.2 ICT intensive 5.5 1.0 1.0 -0.9 1.2 Growth difference (%-points) 4.8 4.4 2.7 0.4 2.4
Notes: Based on a sample of 781 firms. “ICT non-intensive” refers to those 390 firms in the sample who had lower than median ICT expenditure per employee in 2007. “ICT intensive” refers to those 391 firms in the sample who had median ICT expenditure per employee in 2007 or higher.
Source: Statistics Denmark and CEBR analysis.
Demand innovation potential and adjusted productivity growth
To find out how much of the growth difference of 2.4 percentage points can be attributed to ICT expenditure and innovation activity, we first investigate the link between ICT expenditure per employee and demand innovation activity via statistical analysis where we control for other determinants of innovation activity such as firm size, industry, exporter status and educational mix of the firm workforce. Combining the obtained statistical link between ICT expenditure and innovation activity with the numbers for average ICT expenditure per employee for the two groups (above median ICT expenditure and below median ICT expenditure), we can for each of the four possible demand innovation combinations find the differences between the innovation tendency for the two groups that can be attributed to differences in ICT expenditure.
The results are shown in the bottom row of Table 3.6. For example, we find that the difference in ICT expenditure per employee in the two groups corresponds to a predicted 6.0 percentage point difference in combined product and marketing innovation tendency between the two groups that can be attributed to differences in ICT expenditure. In total, we find that a randomly chosen firm from the ICT non-intensive group has a 43.4 % demand innovation tendency while a randomly chosen firm from the ICT intensive group has a 52.5 % demand innovation tendency for a total difference of 9.1 percentage points.
TABLE 3.6 DEMAND INNOVATION POTENTIAL FOR “ICT NON-INTENSIVE ”-GROUP AND “ICT INTENSIVE”-GROUP
Product,
marketing Product, not marketing
Not product, marketing Not product, not marketing Innovation potential
for ICT non-intensive
16.3 % 5.9 % 20.1 % 56.6 %
Innovation potential
for ICT intensive 22.3 % 5.9 % 23.1 % 47.5 %
Difference in
innovation potential
(%-points) 6.0 0.1 3.0 -9.1
Notes: Based on a sample of 781 firms. “ICT non-intensive” refers to those 390 firms in the sample who had lower than median ICT expenditure per employee in 2007. “ICT intensive” refers to those 391 firms in the sample who had median ICT expenditure per employee in 2007 or higher.
Source: Statistics Denmark and CEBR analysis.
To find out what these differences in innovation tendencies related to differences in ICT expenditure imply for productivity growth differences between the two groups, we estimate a growth regression from which we obtain estimates of the effects of being in one of the three innovation active groups (product and marketing, only product, only marketing) on firm productivity growth relative to the last group (neither product nor marketing) which is taken to be the reference group.
The results are shown in Table 3.7 below. The table shows a predicted
0.78 percentage point difference in productivity growth from ICT induced product and marketing innovation, which is 32.5 % of the 2.4 percentage point unadjusted productivity growth difference between firms in the upper and lower half of the ICT distribution. The
estimated 0.78 percentage point difference in productivity growth from ICT induced product and marketing innovation is highly statistically significant. That the difference in ICT induced combined product and marketing innovation tendency alone can explain almost a third of the actual difference in productivity growth between the two groups is a remarkable result.
TABLE 3.7 GROWTH DIFFERENCE BETWEEN “ICT NON-INTENSIVE”-GROUP AND “ICT INTENSIVE”-GROUP FROM ICT INDUCED DEMAND INNOVATION Product, marketing Product, not marketing Not product, marketing Growth difference
top-bottom from ICT induced innovation (%-points)
0.78*** -0.01 -0.25 Growth difference
top-bottom in unadjusted data
(%-points) 2.4 2.4 2.4
Share of growth difference explained by ICT induced
innovation potential 32.5 %*** -0.4 % -10.4 %
Notes: Based on a sample of 781 firms. “ICT non-intensive” refers to those 390 firms in the sample who had lower than median ICT expenditure per employee in 2007. “ICT intensive” refers to those 391 firms in the sample who had median ICT expenditure per employee in 2007 or higher. Growth differences top-bottom from ICT induced innovation are measured relative to group of firms who engaged in neither product, nor marketing innovation in 2007. *** refers to shares calculated on the basis of estimates that are statistically significant at the 1 % level.
Source: Statistics Denmark and CEBR analysis.
To find the total effect of ICT induced demand innovation potential on productivity growth we should then add up the contributions from the three demand innovation combinations (relative to the fourth category which is neither product nor marketing innovation). But actually, the point estimates for the product innovation only and marketing innovation only groups in the growth regression are not statistically different from zero. We therefore conclude that the growth contribution from ICT induced innovation comes only from the firms who implement the product-marketing innovation combination.
The case of supply innovation
When we do the same analysis for the possible effect of supply innovation, i.e. process and organizational innovation either separately or in combination, on productivity growth we do not find any statistically significant effect from supply innovation on growth (see Chapter 4 for details). None of the 2.4 percentage point productivity growth rate difference between the ICT intensive and the ICT non-intensive group can therefore be attributed to ICT induced supply innovation.
This is a surprising result. A possible explanation is that the question put to the firms regarding their process innovation activities in the questionnaire from Statistics Denmark is specified in very broad terms: it asks about a variety of aspects of firm processes such as
logistics, distribution, production processes etc., all under the same heading of “process innovation”. Thus, there might still be a link between ICT, supply innovation, and productivity growth through particular aspects of process innovation.
In the subsection below, we use the alternative data set which we have constructed in order to investigate whether we can find a link between investments in ICT, supply innovation and productivity growth when we employ a narrower definition of process innovation.
3.8
Technology upgrading and
organizational changes
In order to investigate whether the broad definition of process innovation in the survey from which we get the data might explain the lack of a relationship between ICT induced supply innovation potential and productivity growth we utilize the third survey mentioned in section 3.3 above. This survey contains answers to a question that specifically concerns the firms’ production activity (rather than, for example, logistics).
The two questions in the survey which we use ask firms whether they in 2007:
Had introduced new machines embedding ICT technology? Had introduced organizational changes in 2007?
ICT, supply innovation, and unadjusted productivity growth
In Table 3.8 below we group the 2,840 firms into 4 groups according to whether they answer “yes” or “no” to the two questions about implementing technological changes and about implementing organizational changes, respectively. We take the group of firms which answer “no” to both questions to be the reference group.
The table shows the connection between this form of technology upgrading and organizational changes in 2007, and productivity growth over the period 2007-2010 for the firms in our sample. The productivity growth in the group of firms who did not invest either in new machines embedding ICT technology or in organizational changes is normalized to 0.0 % and the three other individual cells show the deviation from this normalized mean for each of the other three subgroups of firms.
TABLE 3.8 TECHNOLOGY UPGRADING AND ORGANIZATIONAL CHANGES, UNADJUSTED RELATIVE GROWTH RATES
Organizational changes
Growth (%-points) Yes No Total
New machines embedding ICT technology Yes 3.5 3.1 3.2 No -0.8 0.0 -0.1 Total 2.9 1.8
Notes: Based on a sample of 2,840 firms. Growth rates are measured relative to group of firms who neither invested in new machines embedding ICT technology nor organizational innovation in 2007. Sources: Statistics Denmark and CEBR analysis.
The first cell in the figure shows that the firms in the sample who answered “yes” both to the question about whether they had introduced new machines embedding ICT technology in 2007 and the question about whether they had introduced organizational changes in 2007 on average had a 3.5 percentage point higher annual productivity growth than the reference group over the period 2007-2010. The group of firms who introduced organizational changes but did not invest in technology upgrading actually had 0.8 percentage point lower average annual productivity growth over the period 2007-2010 than the reference group. Finally, the group of firms who invested in new machines embedding ICT technology but did not make organizational changes had 3.1 percentage point higher average annual productivity growth over the period 2007-2010 than the reference group.
Thus, the figure shows very clearly that firms which introduced new machines embedding ICT technology in 2007 had the highest average productivity growth the following three years of the four groups of firms, particularly if the new machines were introduced in conjunction with organizational changes.
The figure indicates that the main driver of differences in productivity growth is whether a firm had introduced new machines embedding ICT technology as the average difference in productivity growth between firms who answered “yes” and “no” to this question is 3.3 % while the average productivity growth difference between firms who answered “yes” and “no” respectively to whether they had introduced organizational changes was 1.1 %.
We again underscore that this result is only indicative as there are relevant factors that we have not controlled for although it does lend credence to our hypothesis of a connection between ICT-driven innovation and firm productivity growth. We now control for these other determinants of productivity growth in order to isolate the relationship between investments in new machines embedding ICT technology, organizational changes, and productivity growth.
ICT, supply innovation, and adjusted productivity growth
Table 3.9 provides an answer to the question of whether there is a connection between investments in new machines embedding ICT technology and firm productivity growth. In the table we control for the possible influence of firm industry, change in the size of the capital stock, and change in number of employees over the period 2007-2010. Formally, the table presents the results of a regression of average firm productivity growth over the period 2007-2010 on variables indicating whether there was technological upgrading in the form of investments in new machines embedding ICT-technology, and organizational change, respectively, within the firm in 2007.
The table shows that firms which implemented new machines embedding ICT technology in 2007 but did not make organizational changes on average had about 1.0 percentage point higher annual productivity growth over the period 2007-2010 than firms which neither implemented new machines embedding ICT technology nor implemented organizational changes. However, our statistical estimate of 1.0 percentage point higher annual growth is not statistically significant. Firms which only introduced organizational changes on average had 1.6 percentage point higher annual productivity growth than the baseline group but this estimate is also not statistically significant.
TABLE 3.9 TECHNOLOGY UPGRADING AND ORGANIZATIONAL CHANGES, ADJUSTED RELATIVE GROWTH RATES
Organizational changes
Growth (%-points) Yes No
New machines embedding ICT technology
Yes 2.1*** 1.0 No 1.6 0.0
Notes: Based on a sample of 2,840 firms. Growth rates are measured relative to group of firms who neither invested in new machines embedding ICT technology nor organizational innovation in 2007. *** implies statistical significance at the 1 % level.
Source: Statistics Denmark and CEBR analysis.
In contrast, firms which introduced both new machines embedding ICT technology and organizational changes in 2007 had on average 2.1 percentage point higher annual productivity growth over the period 2007-2010 than firms which introduced neither. This estimate is highly statistically significant.
This result is also economically highly significant as it implies that 60
% (2.1 percentage points as a share of 3.5 percentage points) of the actual productivity growth difference between the group of firms who both invested in new machines embedding ICT technology and introduced organizational changes and the group of firms who did neither can be attributed to the combination of investment in new machines embedding ICT technology and introduction of organizational changes. The rest of the difference (1.4 percentage
points) is accounted for by other factors such as differences across the groups in average firm size, exporter/non-exporter status etc. This result thus points to large productivity benefits from suitable investments in production machinery and accompanying organizational adjustments.
4
Descriptive analysis
This chapter and the next provide full results and technical details of the implementation of this project. This chapter provides the motivation for and set-up of the hypotheses analyzed, an overview of the data used in the analyses, and descriptive statistics which provide a first look at what the data has to say about the hypotheses analyzed in the report. The next chapter documents the approach used for the formal statistical analyses of the stated hypotheses, and the results obtained. Some supplementary descriptive statistics, that are not central to the analyses, are relegated to an appendix.
4.1
Motivation
A high standard of living in Denmark depends on the existence of a plentiful supply of competitive and productive firms as a foundation for a large pool of high paying jobs.
Innovation results in better products that can obtain better prices in markets and more efficient production processes that lower production costs. Thus, innovation is an important determinant of competitive advantage for firms and productivity growth for society as a whole.
A widely held hypothesis holds that information and communications technology (ICT) creates a basis for effective innovation activities. Until now, this hypothesis has not been tested on Danish data. This CEBR report utilizes a unique combination of register- and survey data for Danish firms in order to remedy this omission.
The report documents that the interaction between ICT investments and innovation activities is an important driver of productivity growth in Danish firms. Specifically, we document that ICT intensive firms in general obtain a large productivity growth effect through increased potential for a combination of product and marketing innovation. We also document that a combination of organizational innovation and a specific type of ICT investments in process innovation, i.e. automation of the production process, results in higher productivity growth.
4.2
Hypothesis under investigation
One possible mechanism through which digitalization impacts innovation activity and productivity growth is that digitalization leads to product and process innovation resulting in new and better
products and processes. Furthermore, digitalization may cause productivity growth through organizational innovation, for example with respect to management techniques and business models.
On a more fundamental level, the argument is that digitalization changes the way firms work with innovation, and that this change creates opportunities for permanent increases in innovation activities and productivity growth (Brynjolfsson, 2011).
Gretton, Gali and Parham (2004) for example emphasize that ICT investments are a determinant of innovation. Their argument is that ICT is a so called 'general purpose technology' which provides a platform for innovation. Therefore, ICT makes it relatively easier and cheaper to develop new productivity enhancing innovation, for example product and process innovation.
Thus, ICT is a valuable facilitator of innovation in firms because ICT facilitates reduction of transaction costs, improves internal processes, improves coordination with suppliers, slices the value chain both horizontally, vertically and geographically, and increases diversification (Koellinger, 2005).
On the basis of these proposed theoretical mechanisms we will analyze whether the interaction between new technology in the form of ICT and new knowledge, for example created through market driven innovation, is an important driver of productivity growth in Danish firms. Specifically, the analyses will focus on obtaining answers to the following questions:
Is ICT intensity an important driver of innovation in Danish firms?
Is the interaction between ICT investments and innovation activities important for the productivity of Danish firms?
The descriptive analysis in this chapter will not give definitive answers to the questions posed above. We perform more sophisticated statistical analysis in the following chapter to deliver better answers to how much extra value added can be obtained from investments in ICT.
The descriptive analysis in this chapter should therefore be viewed as a first few steps down the path that will lead us to answers to these two questions. We will argue that our data can say something useful about our two key questions, and we will show that the results imply
that there is reason to believe that the answer to both questions is “yes”.
4.3
Approach to descriptive statistics
This chapter presents an overview of our data sample including the specific survey questions posed to the firms and the number of observations from each of the three surveys used to address the questions on innovation activities, ICT expenditure and productivity. We present various characteristics of the firms used in the analysis such as average number of employees, average expenditure on ICT, and the share of firms in the sample that earn at least some of their revenue from exports. We compare the characteristics of the firms in our sample with the characteristics of the full population of Danish firms and show the coverage of our sample in terms of share of total revenue or total number of employees in Danish firms.
We take a preliminary look at connections between ICT expenditure and innovation activity by presenting simple correlations in graphic or tabular form. Specifically, we descriptively investigate a connection between characteristics such as ICT expenditure per employee and innovation activity within the firm. These investigations concern the first of our two questions.
Finally, we take a preliminarily address our second question concerning whether a connection exists between innovation activities within the firm and subsequent firm productivity growth.
4.4
The Data
The surveys
To carry out the analyses we use different samples for different questions. The reason is that we rely on three different surveys containing answers from Danish firms to different questions needed to perform our analyses. The main characteristics of the three surveys are presented in Table 4.1 on page 40. The surveys are, in short name format, FUI, VITA, and VITU. These three surveys are matched with very rich employer-employee-matched registry data. All data are from Statistics Denmark.