Bus travel time reliability
analysis: a case study
Xiaobo QuPhD
Lecturer, Griffith School of Engineering, Griffith University, Gold Coast, Australia
Erwin OhPhD
Senior Lecturer, Griffith School of Engineering, Griffith University, Gold Coast, Australia
Jinxian WengPhD
Associate Professor, MOE Key Laboratory for Urban Transportation Complex Systems Theory and Technology, Beijing Jiaotong University, Beijing, China
Sheng JinPhD
Assistant Professor, College of Civil Engineering and Architecture, Zhejiang University, Hangzhou, China
The travel time reliability of buses has become increasingly important for public transit companies. In this study, a novel approach is proposed to evaluate and analyse the travel time reliability of bus services provided by TransLink in Queensland, Australia. In view of their stochastic features, the two components of travel time – dwell time and driving time – are represented by discrete distributed and normally distributed random variables respectively. Accordingly, the travel time could be described by Gaussian mixture models. Based on the proposed model, impact analysis shows that bus line reliability would increase by around 15% if onboard top-up for ‘go cards’ (electronic tickets) was not offered by TransLink. It was found that not providing this top-up method would not significantly harm the benefit of go card users, but it would substantially increase the total social benefit thanks to improved bus line reliability.
Notation
Ai arrival time at stopi
ai scheduled time in the timetable b time for doors opening and closing Dk dwell time at bus stopk
fs(xìs,ó2 s
) component density function of Gaussian mixture model
mk number of alighting passengers Na,i number of alighting passengers at stopi Nb,i number of boarding passengers at stopi N(ìi,ó2i) normal distribution with a meanìiand a
varianceó2i
nk number of boarding passengers
ps weight coefficient of Gaussian mixture model q punctuality of bus at bus stopi
r reliability for bus line
Ta time spent on alighting per passenger Tb time spent on boarding per passenger Ti driving time from stopi1 to stopi Tj driving time at intervalj
ti expected value of driving time from stopi1 to stopi(as shown in the timetable)
åi random term that depends on traffic state, traffic signals and so on
ìi mean value ofTi
ó2
i variance ofTi
1. Introduction
Public transport provides a basic mobility service to various types of activities including employment, education, recreation and medical care. It also helps to reduce road congestion, vehicle
emissions and oil consumption – all of which benefit both riders and non-riders (Rojo et al., 2011; Yan et al., 2013; Yu et al., 2010). Public transport has thus become an increasingly cost-effective solution to overcome the challenges associated with land availability, economics, energy and the environment (Liu et al., 2013; Szeto and Wu, 2011; Yanet al., 2012). In this regard, land transport authorities have been trying to promote and encourage public transport, especially in compact urban cities with limited land availability. It is well recognised that the attractiveness of public transport services would be seriously undermined by system unreliability (Chen et al., 2009; Mazloumi et al., 2011a, 2011b; Meng and Qu, 2012a; Orth et al., 2011; Vu and Khan, 2010). Consequently, improving the reliability of public transit services is a key priority and primary focus for the TransLink Transit Authority (Queensland), as stated in the 2010–2011 annual report (TransLink, 2010).
Bus schedule reliability is an essential attribute of a bus system, and is consistently ranked as one of the major concerns of passengers (Ng et al., 2011; Orth et al., 2012; Sorratini et al., 2008; Xuan et al., 2011). Therefore, in order to encourage the use of public transit systems, it is of utmost significance to enhance the reliability of bus services. Bus travel time is naturally unstable since a small disturbance, such as a delay in boarding or alighting, can start a vicious cycle that results in bus unpunc-tuality. The bus travel time on a route can be divided into dwell time and driving time (Dorbritz et al., 2009; Meng and Qu, 2013). The former is the time for passengers boarding and alighting at bus stops, including doors opening and closing, and the latter is the time when buses are actually moving from one stop to another. Both components possess variability. The driving
time usually fluctuates at an expected time given in the timetable. Mathematically this is expressed as
Ti¼tiþåi 1:
whereTi is the driving time from stop i1 to stopi, ti is the expected value of driving time from stopi1 to stopi(as shown in the timetable) and åi is a random term that depends on the state of traffic state, traffic signals and so on. Taylor (1982) showed that driving time follows a symmetrical distribution (i.e. normal) distribution. Jordan and Turnquist (1979) showed that driving time at rush hours had a skewed distribution and a gamma distribution provided the best fit. Mazloumiet al.(2009) analysed factors that contribute to driving time variability.
Bus dwell time is considered to be a function of the number of alighting and boarding passengers and the amount of time required for opening and closing of bus doors (Levinson, 1983). Since the 1980s, a few regression models have been developed to estimate the bus dwell time in a deterministic manner (Guenthner and Hamat, 1988; Jaiswalet al., 2010; Tirachini, 2013). The basic assumption in these regression models is that the boarding and alighting times for different passengers are similar. However, different passengers may have significantly different boarding times.
Dorbritzet al.(2009) discussed the impact of onboard ticket sales on bus dwell time variance. In Queensland, more than 80% of passengers use a ‘go card’ (an electronic ticket) to tap in and out of the bus (TransLink, 2010). The average boarding time for this category of passenger is around 3 s. By contrast, paper ticket buyers take at least 10 s per passenger for boarding. In Queens-land, passengers can also top up their go cards on TransLink buses, and this takes at least 30 s per passenger. The other top-up alternatives are on line, by phone, at most convenience stores and/ or supermarkets, on any ferry, at any train station and at some big bus stops. Therefore, random variables are more correct alter-natives due to the intrinsic stochastic nature of these parameters. In this study, a model was developed to evaluate the punctuality of the bus service in Queensland, Australia, by taking into account the stochasticity of both driving time and dwell time. A new index is proposed to evaluate the reliability of a bus line. This is followed by a case study to analyse the impact of onboard travel card top-up on travel time reliability. The impact analysis shows that bus line reliability would increase by around 15% if onboard top-up were completely replaced by the other six top-up alternatives. Removal of the onboard top-up facility would thus, in fact, increase the total social benefit.
2. Data description
2.1 Bus line 709
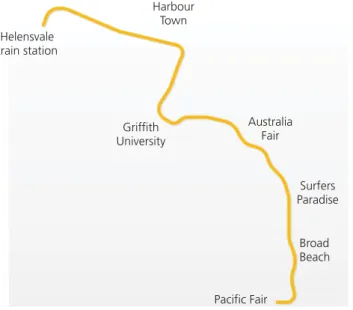
As shown in Figure 1, bus line 709 in Queensland connects Helensvale train station to Pacific Fair by way of Broad Beach,
Surfers Paradise, Australia Fair and Griffith University and Harbour Town. The bus line links Gold Coast central business district to the train station (leading to Brisbane), which is one of the busiest bus lines in Gold Coast. Several minutes’ delay results in passengers not being able to catch the subsequent train service and having to wait for another 30 min for the next train.
2.2 Dwell time
Bus dwell time is defined as the time spent by a bus at a bus stop for passenger alighting and boarding, including the time for opening and closing of bus doors (Jaiswal et al., 2010). As mentioned in Section 1, onboard top-up is offered by TransLink. Passengers could thus be categorised into four types in terms of their distinct boarding times for the bus
j travel card users (tapping in)
j travel card users (topping up onboard) j passengers with disabilities
j single paper ticket users.
The boarding times for 150 boarding passengers were collected. The average boarding times per passenger and the proportion of users in the four categories are presented in Table 1.
2.3 Driving time
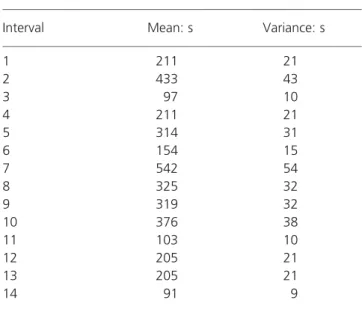
The driving time from one stop to another usually fluctuates with a given time. Without loss of generality, it was assumed that the driving times of various intervals follow a normal distribution (Table 2). The mean values are the given times from the timetable of bus line 709 and the variances are assumed to be a proportion of mean values.
The reliability of a bus service will also be affected by the number of boarding and alighting passengers. In this study,
Helensvale train station Harbour Town Griffith University Australia Fair Surfers Paradise Broad Beach Pacific Fair
passengers’ arrival and departure patterns are represented by Table 3. It should be noted that many passengers alight at the destination stop (Helensvale train station) and these passengers do not affect dwell time.
3. Reliability analysis
3.1 Punctuality analysis
If a bus arrives at a bus stop within 3 min of the scheduled time, it is considered punctual at this stop. The arrival timeAiat stopi can be calculated using
Ai¼ Xi j¼1 Tjþ Xi1 k¼1 Dk 2:
whereTjis the driving time at intervalj(Table 2) andDk is the dwell time at bus stopk, represented by
Dk¼max(nkTbþb, mkTaþb)
3:
where nk and mk are the numbers of boarding and alighting passengers respectively, Tb and Ta represent the time spent on boarding and alighting per passenger andbis the time for doors opening and closing. The time for doors opening and closing is taken as 2 s from the survey. Variability in dwell time can also be a result of variations in the number of passengers. In order to evaluate the impact of onboard travel card top-up, in this study it is assumed that the number of passengers is known and remains unchanged. However, the boarding time per passenger is repre-sented by random variables
Tb¼ 45 s, p1¼0.02 3 s, p2¼0.82 30 s, p3¼0.10 20 s, p4¼0.06 8 > > > > < > > > > : 4:
wherep1,p2,p3andp4refer to the proportions of different users as detailed in Table 1. Number of users Proportion of users: % Average boarding time per passenger: s Disabled passengers 3 2 45
Travel card users (tap in) 123 82 3
Travel card users (onboard top-up) 15 10 30
Single paper ticket users 9 6 15
Table 1.Boarding times and proportion of different types of users
Interval Mean: s Variance: s
1 211 21 2 433 43 3 97 10 4 211 21 5 314 31 6 154 15 7 542 54 8 325 32 9 319 32 10 376 38 11 103 10 12 205 21 13 205 21 14 91 9
Table 2.Driving time distribution
Bus stop Number of passengers
Boarding Alighting 1 4 2 2 6 4 3 2 2 4 6 2 5 4 8 6 3 3 7 14 8 8 6 2 9 8 4 10 10 4 11 2 2 12 6 2 13 2 4 14 2 3
Table 3.Number of boarding and alighting passengers for the Helensvale train station to Pacific Fair line
From Table 3, we can see thatDk is determined by the boarding times at all bus stops. Therefore, Pik¼11Dk are also discrete distributed random variables
Xi1 k¼1 Dk¼(i1)bþ Xi1 k¼1 nkTb 5:
As Tj follows a normal distribution, Pij¼1Tj are also normally distributed random variables. The mean value and variance can be calculated as ìi¼ì X i j¼1 Tj 0 @ 1 A¼X i j¼1 ì(Tj) 6: ó2 i ¼ó2 Xi j¼1 Tj 0 @ 1 A¼X i j¼1 ó2(T j) 7: Accordingly Ai¼(i1)bþp1 Xi1 k¼1 (45 s3nk) þN(ìi,ó2i)þp2X i1 k¼1 (3 s3nk)þN(ìi,ó2i) þp3X i1 k¼1 (30 s3nk)þN(ìi,ó2i) þp4X i1 k¼1 (15 s3nk)þN(ìi,ó2i) 8: where Pik¼11(45 s3nk), Pki¼11(3 s3nk), Pki¼11(30 s3nk) and Pi1
k¼1(15 s3nk) are deterministic values.
Ai¼(i1)bþp1N ìiþ Xi1 k¼1 (45 s3nk), ó2i ! þp2N ìiþX i1 k¼1 (3 s3nk), ó2i ! þp3N ìiþX i1 k¼1 (30 s3nk),ó2i ! þp4N ìiþ Xi1 k¼1 (15 s3nk), ó2i ! 9:
Accordingly,Aifollows a Gaussian mixture distribution, which is a weighted sum of four component normally distributed random variables. The Gaussian mixture model and its derivatives have been widely used in transportation analysis (Jin et al., 2011; Meng and Qu, 2012b; Qu and Meng, 2012). Its probability density function is f(ai)¼ X4 s¼1 psfs(xìs,ó2s ) 10:
wherepsis the weight and fs(xìs,ó2 s
) is the component density function with meanìsand varianceó2
s:
If the bus arrives a stop within 3 min after the scheduled time, the bus is considered punctual at this stop. Therefore, the punctuality of the bus line at bus stopicould be calculated by
q¼P(Ai<aiþ3) 11:
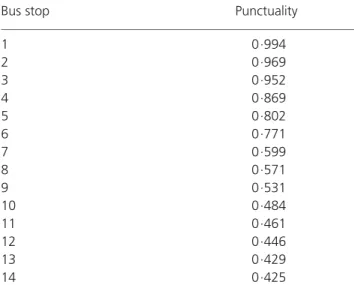
where ai is the scheduled time in the timetable. The calculated punctualities at various bus stops are presented in Table 4.
3.2 Bus line reliability
As can be seen in Table 4, the punctualities at various stops are not the same. In this regard, a proper weighting system needs to be proposed in order to evaluate the reliability for a particular bus line. In this study, a higher weight is given for bus stops with more boarding and alighting passengers. Mathematically, this is represented by r¼X I i¼1 (Nb,iþNa,i)qi 12:
where Nb,i and Na,i are the number of boarding and alighting passengers at stop irespectively and qi is the punctuality of the bus at stopi. According to Equation 12, the reliability of the bus line is 0.6533.
3.3 Impact analysis of travel card onboard top-up
As already mentioned, there are seven options for travel card top-up – onboard a bus, on line, by phone, at convenience stores and/ or supermarkets, on vessels linking cities to recreational islands, at any train station and at some big bus stops. Onboard top-up causes significant delays and reduces the calculated punctuality and reliability, which will consequently discourage use of bus services. An impact analysis was carried out to assess the effect on calculated punctuality and reliability if TransLink were to cease provision for onboard top-up, leaving users with the option of topping up through the other six alternatives. The calculated punctualities at various stops are presented in Table 5 and Figure
2. According to Equation 12, bus line reliability without onboard top-up is 0.8052. With the withdrawal of onboard top-up, the overall improvement in terms of bus line reliability is 15.18%. As can be seen in Figure 2, there is no change in punctuality at bus stop 1 when changing the boarding options. This is because the accumulated delay caused by onboard top-up for the first several stops is still generally less than 3 min (see Equation 11). How-ever, as the delay accumulates, the bus line will become more and more unpunctual for both cases (with and without onboard top-up).
3.4 Sensitivity analysis for driving time variability
The impact of driving time variability on bus line reliability was evaluated. The variance in driving time was assumed to be 5%, 10% and 15% of the mean driving time. Table 6 shows that bus line variability is mainly caused by the dwell time variability (5% against 25.18% for 5% variance in driving time, 10% versus 24.67% for the 10% scenario and 15% against 23.97% for the 15% scenario 15%). As shown in Table 6, the removal of the onboard top-up option would result in increases in bus line reliability of 22.21%, 15.19%, and 15.02% for the three scenar-ios.
4. Discussion, lessons learnt and conclusion A model was developed to evaluate the calculated punctual-ities and reliability of bus services in Queensland, Australia by taking into account variability in dwell time and driving time. In view of their characteristics, discrete distributed and normally distributed random variables were used to represent dwell time and driving time respectively. Accordingly, the total travel time could be described by Gaussian mixture models. Based on the model, reliability indices were proposed to assess punctuality/reliability of bus stops and bus lines. An impact analysis was carried out to examine the effects of
Bus stop Punctuality
With onboard top-up Without onboard top-up 1 0.994 0.999 2 0.969 0.989 3 0.952 0.982 4 0.869 0.946 5 0.802 0.905 6 0.771 0.889 7 0.599 0.785 8 0.571 0.764 9 0.531 0.729 10 0.484 0.698 11 0.461 0.683 12 0.446 0.666 13 0.429 0.652 14 0.425 0.641
Table 5.Result of impact analysis
0·5 0·6 0·7 0·8 0·9 1·0 0 1 2 3 4 5 6 7 8 9 10 11 12 13 14 Punctuality Bus stop
With onboard top-up Without onboard top-up
Figure 2.Punctualities at various bus stops
Variance in driving time: %
Bus line reliability With onboard top-up Without onboard top-up 5 0.6982 0.9203 10 0.6533 0.8052 15 0. 6108 0.7610
Table 6.Sensitivity analysis for driving time variability
Bus stop Punctuality
1 0.994 2 0.969 3 0.952 4 0.869 5 0.802 6 0.771 7 0.599 8 0.571 9 0.531 10 0.484 11 0.461 12 0.446 13 0.429 14 0.425
passengers topping up their electronic tickets on board the bus.
According to sensitivity analysis, low bus line reliability is mainly caused by dwell time uncertainty, especially with regard to onboard card top-up, single paper ticket holders and passengers with disabilities. Boarding assistance for disabled passengers must be guaranteed to ensure equity and access to public transport services and it is desirable to offer single paper tickets for those who do not have a ‘go card’ (e.g. tourists). However, onboard top-up appears to disadvantage all passengers as it significantly reduces bus line punctuality and reliability. Six convenient alternatives for top-up are already provided to go card users and it is therefore suggested that, for overall total social benefit, onboard travel card top-up should not be offered by TransLink.
Acknowledgements
This research was supported by the Griffith NRG scheme and the National Science Foundation of China (grant 51208462). The corresponding author for this paper is Dr Sheng Jin.
REFERENCES
Chen X, Yu L, Zhang Y and Guo J(2009) Analyzing urban bus service reliability at the stop, route, and network levels. Transportation Research Part A43(8): 722–734.
Dorbritz R, Luthi M, Weidmann UA and Nash A(2009) Effects of onboard ticket sales on public transport reliability.
Transportation Research Record2110: 112–119. Guenthner R and Hamat K(1988) Transit dwell time under
complex fare structure.Journal of Transportation Engineering ASCE114(3): 367–379.
Jaiswal S, Bunker J and Ferreira L(2010) Influence of platform walking on BRT station bus dwell time estimation: Australian analysis.Journal of Transportation Engineering, ASCE
136(12): 1173–1179.
Jin S, Qu X and Wang D(2011) Assessment of expressway traffic safety using Gaussian mixture model based on time to collision.International Journal of Computational Intelligence Systems4(6): 1122–1130.
Jordan WC and Turnquist MA(1979) Zone scheduling of bus routes to improve service reliability.Transportation Science
13(3): 242–268.
Levinson H(1983) Transit travel time performance. Transportation Research Record915: 1–6.
Liu Z, Yan Y, Qu X and Zhang Y(2013) Bus stop-skipping scheme with random travel time.Transportation Research Part C: Emerging Technologies35: 46–56.
Mazloumi E, Currie G and Rose G(2009) Using GPS data to gain insight into public transport travel time reliability.Journal of Transportation Engineering136(7): 623–631.
Mazloumi E, Rose G, Currie G and Sarvi M(2011a) An integrated framework to predict bus travel time and its variability using traffic flow data.Journal of Intelligent Transportation Systems15(2): 75–90.
Mazloumi E, Moridpour S, Currie G and Rose G(2011b) Exploring the value of traffic flow data in bus travel time prediction.Journal of Transportation Engineering138(4): 436–446.
Meng Q and Qu X(2012a) Uncertainty propagation in quantitative risk assessment modelling for fire in road tunnels.IEEE Transactions on Systems, Man, and
Cybernetics Part C: Applications and Reviews42(6): 1454– 1464.
Meng Q and Qu X(2012b) Estimation of rear-end vehicle crash frequencies in urban road tunnels.Accident Analysis and Prevention48: 254–263.
Meng Q and Qu X(2013) Bus dwell time estimation at a bus bay: a probabilistic approach.Transportation Research Part C: Emerging Technologies36: 61–71.
Ng M, Szeto WY and Waller ST(2011) Distribution-free travel time reliability assessment with probability inequalities. Transportation Research Part B: Methodological45(6): 852– 866.
Orth H, Dorbritz R and Weidmann U(2011) Public transport capacity and quality – development of an LOS-based evaluation scheme.Proceedings of 11th Swiss Transport Research Conference, Ascona, Switzerland.
Orth H, Weidmann U and Dorbritz R(2012) Development of a public transport performance measurement system. Presented at the91st Transportation Research Board Annual Meeting, Washington, DC, USA.
Qu X and Meng Q(2012) The economic importance of the straits of Malacca and Singapore: an extreme-scenario analysis. Transportation Research Part E48(1): 258–265. Rojo M, Gonzalo-Orden H, Dell’Olio L and Ibeas A(2011)
Modeling gender perception of quality in interurban bus services.Proceedings of the Institution of Civil Engineers – Transport164(1): 43–53, http://dx.doi.org/10.1680/ tran.9.00031.
Sorratini JA, Liu R and Sinha S(2008) Assessing bus transport reliability using micro-simulation.Transportation Planning and Technology31(2): 303–324.
Szeto WY and Wu Y(2011) A simultaneous bus route design and frequency setting problem for Tin Shui Wai, Hong Kong.European Journal of Operational Research209(2): 141–155.
Taylor M(1982) Travel time variability – the case of two public models.Transportation Science16(4): 507–521.
Tirachini A(2013) Bus dwell time: the effect of different fare collection systems, bus floor level and age of passengers.Transportmetrica A: Transport Science9(1): 28–49.
TransLink (TransLink Transit Authority (Queensland))(2010) Annual Report 2010–2011. TransLink, Brisbane, Australia. Vu NH and Khan AM(2010) Bus running time prediction using a
statistical pattern recognition technique.Transportation Planning and Technology33(7): 625–642.
Xuan Y, Argote J and Daganzo CF(2011) Dynamic bus holding strategies for schedule reliability: optimal linear control and
performance analysis.Transportation Research Part B45(10): 1831–1845.
Yan Y, Meng Q, Wang S and Guo X(2012) Robust optimization model of schedule design for a fixed bus route.
Transportation Research Part C25: 113–121. Yan Y, Liu Z, Meng Q and Yu J(2013) Robust network
design for bus transit system with stochastic travel time. Journal of Transportation Engineering139(6): 625–634. Yu B, Yang ZZ and Wang J(2010) Bus travel-time prediction based on bus speed.Proceedings of the Institution of Civil Engineers – Transport163(1): 3–7, http://dx.doi.org/ 10.1680/tran.2010.163.1.3.
WHAT DO YOU THINK?
To discuss this paper, please email up to 500 words to the editor at [email protected]. Your contribution will be forwarded to the author(s) for a reply and, if considered appropriate by the editorial panel, will be published as a discussion in a future issue of the journal.
Proceedingsjournals rely entirely on contributions sent in by civil engineering professionals, academics and students. Papers should be 2000–5000 words long (briefing papers should be 1000–2000 words long), with adequate illustra-tions and references. You can submit your paper online via www.icevirtuallibrary.com/content/journals, where you will also find detailed author guidelines.