Comparison of Graph Databases and Relational
Databases When Handling Large-Scale Social Data
A Thesis Submitted to the
College of Graduate Studies and Research
in Partial Fulfillment of the Requirements
for the degree of Master of Science
in the Department of Computer Science
University of Saskatchewan
Saskatoon
By
Chen, Yaowen
c
Permission to Use
In presenting this thesis in partial fulfilment of the requirements for a Postgraduate degree from the University of Saskatchewan, I agree that the Libraries of this University may make it freely available for inspection. I further agree that permission for copying of this thesis in any manner, in whole or in part, for scholarly purposes may be granted by the professor or professors who supervised my thesis work or, in their absence, by the Head of the Department or the Dean of the College in which my thesis work was done. It is understood that any copying or publication or use of this thesis or parts thereof for financial gain shall not be allowed without my written permission. It is also understood that due recognition shall be given to me and to the University of Saskatchewan in any scholarly use which may be made of any material in my thesis. Requests for permission to copy or to make other use of material in this thesis in whole or part should be addressed to:
Head of the Department of Computer Science 176 Thorvaldson Building 110 Science Place University of Saskatchewan Saskatoon, Saskatchewan Canada S7N 5C9
Abstract
Over the past few years, with the rapid development of mobile technology, more people use mobile social applications, such as Facebook, Twitter and Weibo, in their daily lives, and there is an increasing amount of social data. Thus, finding a suitable storage approach to store and process the social data, especially for the large-scale social data, should be important for the social network companies. Traditionally, a relational database, which represents data in terms of tables, is widely used in the legacy applications. However, a graph database, which is a kind of NoSQL databases, is in a rapid development to handle the growing amount of unstructured or semi-structured data. The two kinds of storage approaches have their own advantages. For example, a relational database should be a more mature storage approach, and a graph database can handle graph-like data in an easier way.
In this research, a comparison of capabilities for storing and processing large-scale social data between relational databases and graph databases is applied. Two kinds of analysis, the quantitative research analysis of storage cost and executing time and the qualitative analysis of five criteria, including maturity, ease of programming, flexibility, security and data visualization, are taken into the comparison to evaluate the performance of relational databases and graph databases when handling large-scale social data. Also, a simple mobile social application is developed for experiments. The comparison is used to figure out which kind of database is more suitable for handling large-scale social data, and it can compare more graph database models with real-world social data sets in the future research.
Acknowledgements
There are so many people I want to thank for helping me through this journey. First of all, I must acknowledge the irreplaceable contribution of my supervisor, Dr. Ralph Deters. With his continuous support and advice throughout my graduate studies at the University of Saskatchewan. His guidance helped me in all the time of research and writing of this thesis. I learned a lot from him, and it is my fortunate to have him as my supervisor.
Also, I would like to express my heartfelt thanks to the other members of my committee, Dr. Julita Vassileva, Dr. Gordon McCalla, and my external examiner Dr. Anh Dinh for their encouraging words, thoughtful criticism, valuable comments and constructive suggestions to help me to complete my studies and write this thesis.
Moreover, I am very thankful to Gwen Lancaster and other staffs at the Department of Computer Science and my colleagues from Multi-Agent, Distributed, Mobile and Ubiquitous Computing (MADMUC) Lab for their help throughout my graduate studies.
Finally, I need to acknowledge the love and support from my parents, Shengzhan and Ruyu. Thank them for their encouragement to keep me focusing on my studies, for their understanding, and for their endless love throughout my graduate studies.
Contents
Permission to Use i Abstract ii Acknowledgements iii Contents iv List of Tables viList of Figures vii
List of Abbreviations viii
1 Introduction 1
2 Problem Definition 3
3 Literature Review 5
3.1 Relational Database . . . 5
3.1.1 ACID . . . 7
3.1.2 Primary Key and Foreign Key . . . 8
3.1.3 Database Normalization . . . 10 3.2 Graph Database . . . 12 3.2.1 NoSQL . . . 12 3.2.2 Property Graphs . . . 15 3.2.3 Hypergraphs . . . 16 3.2.4 RDF Triples . . . 16 3.3 Database Benchmark . . . 19 3.4 Social Network . . . 20
3.4.1 Social Network Analysis . . . 23
3.5 Mobile Computing . . . 25
3.5.1 Cross-platform Mobile Application development . . . 27
3.6 Summary . . . 30
4 Design and Architecture 35 4.1 Data Generation . . . 35
4.2 Mobile Social Application . . . 36
4.2.1 Architecture . . . 37 4.2.2 Design Requirements . . . 38 4.3 Kernel Description . . . 39 4.3.1 Kernel One . . . 39 4.3.2 Kernel Two . . . 40 4.3.3 Kernel Three . . . 41 4.3.4 Kernel Four . . . 42 4.3.5 Kernel Five . . . 43 4.3.6 Kernel Six . . . 44 4.4 Summary . . . 44 5 Implementation 46
5.1 Workload Characterization . . . 46
5.2 Hardware and Software Setting . . . 47
5.2.1 Neo4j . . . 48
5.2.2 MySQL . . . 50
5.3 Mobile Application Implementation . . . 50
6 Experiments 58 6.1 Quantitative Analysis . . . 58 6.1.1 Storage Cost . . . 58 6.1.2 Execution Time . . . 60 6.2 Qualitative Analysis . . . 63 6.2.1 Maturity/Level of Support . . . 63 6.2.2 Ease of Programming . . . 65 6.2.3 Flexibility . . . 68 6.2.4 Security . . . 71 6.2.5 Data Visualization . . . 71 6.3 Summary . . . 74
7 Conclusion and Future Work 76 7.1 Future Work . . . 77
7.1.1 Database Benchmark . . . 77
7.1.2 Comparing More Database Systems . . . 77
7.1.3 Storing and Processing Practical Social Graph Data . . . 77
List of Tables
3.1 Relational Database Example . . . 6
3.2 Relational Model Terminology . . . 7
3.3 Data Redundancy Example . . . 10
3.4 RDF subject-predicate-object . . . 17
3.5 Literature Summary . . . 31
6.1 Databases with Size . . . 59
6.2 Data Insertion in ms . . . 60
6.3 Data Searching in ms . . . 61
6.4 Graph Databases with Query Languages and API . . . 66
6.5 People Table . . . 68
6.6 Relationship Table . . . 69
6.7 Statement Table . . . 69
6.8 Pet Table . . . 70
6.9 Security Services Comparison between MySQL and Neo4j . . . 72
6.10 People Table . . . 73
6.11 Relationship Table . . . 73
6.12 Statement Table . . . 74
List of Figures
1.1 Social Graph[49] . . . 1
3.1 Primary Key and Foreign Key Example[79] . . . 9
3.2 Database Normalization Process[1] . . . 11
3.3 NoSQL Databases[67] . . . 13
3.4 Graph Database Example[4] . . . 14
3.5 Property Graph[3] . . . 15
3.6 Hypergraph Example . . . 16
3.7 RDF Triple[2] . . . 17
3.8 A Social Network in a Graph[25] . . . 20
3.9 Strong Ties and Weak Ties . . . 21
3.10 Different Kinds of Mobile Application[72] . . . 29
4.1 Scale-free Graph and Random Graph[22] . . . 35
4.2 Architecture of Application . . . 37
5.1 Data Schema . . . 46
5.2 Graph data example . . . 47
5.3 Neo4j Web Admin Consolo . . . 49
5.4 Neo4j Web Browser . . . 49
5.5 MySQL workbench . . . 50
5.6 Login Page . . . 54
5.7 Application Workflow . . . 56
6.1 Graph Traversal Time in ms . . . 61
6.2 Built-in Function in ms . . . 62
6.3 Data Union and Intersection in ms . . . 63
6.4 Relationship of A and B . . . 69
6.5 Relationship of A , B and C . . . 70
List of Abbreviations
LOF List of Figures
LOT List of Tables
ACID Atomicity, Consistency, Isolation and Durability
GDB Graph Database
RDB Relational Database
PK Primary Key
FK Foreign Key
NF Normalization Form
RDF Resource Description Framework
NoSQL Not Only SQL
OS Operation System
RDBMs Relational Database Management System
HTTP Hypertext Transfer Protocol
IDE Integrated Development Environment
WWW World Wide Web
W3C World Wide Web Consortium
API Application Programming Interface
Chapter 1
Introduction
In recent years, there has been increasing importance in storing and processing data in the form of graphs, which is one of the basic data structures in computer science. According to Mashaghi[52], it can use graphs for modeling purposes in many types of relations and processes in physical, biological, social and information systems, and also for representing many practical problems. Meanwhile, several companies, especially the social media companies, which are interested in representing social networks in graphs, are trying to apply graph models for practical applications.
A graph contains lots of nodes and edges[77], and in a social graph, the nodes refer to the social actors in the social network, and the edges represent the social relationships between the social actors. An edge can describe what it is, where it comes from, and where it goes to. Lots of social information is implicit in social graphs. Also, graph structure can enable users to process several graph operations, such as graph transposing, graph complement, graph product and graph minor, on the social data[77]. These operations offer more possibilities to process the social data to explore more social information. Therefore, there is an increasing need to store and query the graphs.
In these contexts, it may be unsuitable to use the relational database management systems, which is a traditional storage approach storing data in terms of tables, to handle the graph data, since they hardly represent the inherent graph structure, and even the best relational database systems so for may not match the requests for serving social graph data, although they are ACID (Atomicity, Consistency, Isolation, and Durability) compliant and have high performance when handling large-scale data. Meanwhile, a new storage approach, called GDBs (Graph Database Systems), is emerging to provide a solution for storing and working with graphs.
Graph databases, the new storage model, have been adopted in the past few years. They use graph structure to represent and store data, and enable consequently semantic queries with nodes, edges and properties[7]. Thus, a graph database can offer a cost-saving solution for storing graph-like data, compared with the relational model. For example, processing some graph operations to query data from relational databases can be very inefficient, because it may need complex join operations or subqueries to assist. On the other hand, it can be easily handled in graph databases.
This research provides a benchmark study to compare the performance and capabilities of the relational databases and the graph databases on storing and processing large-scale social graph data. The main high-lights of this thesis will include the following three points:
• 1. By comparing the performances of relational database systems and graph database systems on storing
and processing large-scale social graph data, this thesis highlights the capabilities of the relational databases and the graph databases.
• 2. The designed queries can be used to implement a database benchmark for analyzing the capabilities
of relational databases and graph databases for storing and processing large-scale graph data.
• 3. This research implements a simple mobile social application, which applies relational databases and
graph databases as the backend data storage approaches. It can be used to simulate the practical social applications for evaluating the performances of relational databases and graph databases in real-world social applications.
The rest of this thesis is organized as follows: Chapter 2 discusses the problem definition. Chapter 3 provides the literature review associated with relational databases, graph databases, database benchmarks and other work related to the thesis. Chapter 4 describes the database setup and the kernels of the bench-mark. Chapter 5 focuses on social graph generation and implementation of the social mobile application and the middleware. Chapter 6 provides the experiments, experimental results, and evaluation and discussion. Chapter 7 concludes this thesis with directions for future work.
Chapter 2
Problem Definition
This research is focusing on comparing the performances and capabilities of graph databases and relational databases on storing and processing large-scale social graph data. Besides comparing the storage cost and query performance, the proposed simple mobile social application can be used to evaluate relational databases and graph databases in real-world applications with qualitative analysis based on five subjective judgments, including maturity and level of support, ease of programming, flexibility, security and data visualization.
In order to achieve the goal of this research, the following key questions should be answered in this thesis:
• 1. What are the advantages of applying the graph databases and the relational databases to store and
process large-scale social graphs data?
1. From the hardware perspective, which kind of the storage approaches can reduce the storage cost for storing large-scale social graph data?
2. Which kind of the storage approaches has better query performance, specifically, shorter execution time?
• 2. How is the performance of the relational databases and the graph databases on the reliability?
1. Which storage approach has the higher maturity and more support for storing and processing large-scale social data?
2. How is the performance of both relational databases and graph databases on enforcing the data security?
• 3. How practicability are the relational database systems and the graph database systems?
1. Which the storage approach, the relational database or the graph database, is easier for developers to apply in the practical applications?
2. Which kind of database systems is more flexible for handling the unstructured or semi-structured data, especially for the graph-like data?
3. How can relational databases and graph databases support the data visualization?
• Challenge 1: Graphs Generator: Normally, the nodes and edges in random graphs can be similar. However, in this research, the stored and processed graphs should be large-scale social graphs, and such graphs are highly right-skewed, meaning the large majority of nodes have low degrees and only a small number of nodes have high degrees[78]. Thus, the nodes should be different in a graph, and it makes the social graphs different to the random graphs. Thus, generating large social graphs, which meet this property, is the first challenge in this research.
• Challenge 2: Cross-Platform Mobile Social Application: With the development of mobile technology,
mobile applications become more common in people’s daily life, especially for the social applications. The mobile social applications are highly interested in storing and processing the social data in terms of graphs. Besides the quantitative analysis, which is based on the performance on storage cost and query execution time, the qualitative analysis should be necessary to complete the understanding of the storage approaches. Moreover, building a simple mobile application to simulate some practical functions should be significant for both quantitative analysis and qualitative analysis, and it also is a challenge in this research.
• Challenge 3: Evaluation Criteria: The core of this research is comparing the performances of the
relational database (RDB) and the graph database (GDB) on storing and processing large-scale social graph data. Therefore, it is essential to benchmark the performance of the database systems. Although there are several benchmarks of relational databases or graph databases, it lacks unified criteria for evaluating the performances of relational databases and graph databases in one case. Therefore, the third challenge here is to propose sufficient criteria to compare the different types of database systems.
Besides the main goal of thesis, the follows list two sub-goals that should be achieved in this study as well:
• Goal 1: To develop a simple hybird mobile application, which can run on different mobile devices, to
be familiar with the cross-platform mobile application development.
1. Cross-platform mobile application running on various mobile platforms 2. Hybrid application applying the Web-technology with the native shell
3. Applying jQuery Mobile and PhoneGap
• Goal 2: To construct a database benchmark for evaluating database performance on storing and
pro-cessing large-scale graph data
1. Large-scale social graph data
2. Suitable for graph databases and relational databases 3. Robust, reliable, repeatable benchmark
Chapter 3
Literature Review
The literature review is organized as follows:
The first section, Section 3.1, introduces the relational database, which is a key point in this research. After reviewing the related literature, it provides the basic knowledge about the relational databases. In this section, it reviews several important technologies or terminologies about the relational databases including ACID (Atomicity, Consistency, Isolation, and Durability), which is a set of properties that guarantee the reliability of database transactions; Primary Key and Foreign Key, which are the key concepts to build relationships in a relational database; Database Normalization, which is a process to decompose the data into smaller relations to minimize the data redundancy.
In addition, Section 3.2 talks about the graph databases, which is another focus of this research besides the relational databases. Firstly, the concept of the NoSQL databases is introduced in subsection 3.2.1. In addition, the three types of graph model in the graph databases: property graph, hypergraph, and RDF Triple, are reviewed in subsection 3.2.2, 3.2.3 and 3.2.4.
Moreover, the database benchmark is important for evaluating the performance of databases, and Section 3.3 represents the works about benchmarking the databases.
Furthermore, a key concept in this research is the social network, so Section 3.4 is talking about the knowledge about the social network. Specifically, subsection 3.4.1 describes the social network analysis to express the importance of social relationships in the research.
Finally, in order to show the impacts of mobile technology on computing, the information about mobile computing is reviewed in Section 3.5. Additionally, this research needs to build up a cross-platform mobile application that can run on different mobile OSs. Therefore, subsection 3.5.1 introduces the cross-platform mobile application development technologies.
3.1
Relational Database
How to store and access data safely and securely has been a challenging topic for a long time. In 1970, Edgar Codd [19] proposed the idea about the relational model, and since then the relational model has almost maintained the entire database market, and dominated the database development until the emergence of NoSQL technologies. Currently, there are many different commercial vendors of the relational database
management systems (RDBMs), and their products vary significantly in capabilities and cost. Some leading vendors are listed as follows:
• Computer Associates: INGRES
• IBM: DB2
• INFORMIX Software: INFORMIX
• Oracle Corporation: Oracle
• Microsoft Corporation: MS Access
• Microsoft Corporation: SQL Server
• MySQL AB: MySQL
• PostgreSQL Dvlp Grp: PostgreSQL
• Sybase :Sybase 11
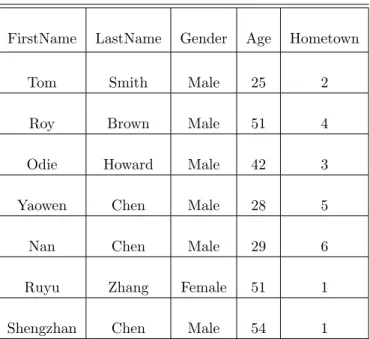
The relational model, as proposed by Codd[21], organizes data into one or more tables of rows and columns, and each row should be identified uniquely. The relational model stores information using tables (relations) to enable software storing, accessing and modifying data that stored in the server side. Table 3.1 represent an example table in a relational database.
Table 3.1: Relational Database Example
FirstName LastName Gender Age Hometown
Tom Smith Male 25 2
Roy Brown Male 51 4
Odie Howard Male 42 3
Yaowen Chen Male 28 5
Nan Chen Male 29 6
Ruyu Zhang Female 51 1
Shengzhan Chen Male 54 1
There are five relational attributes, including “FirstName”, “LastName”, “Gender”, “Age” and “Home-town”. Each attribute is assigned with value, and a row of data, such as “Yaowen”, “Chen”, “Male”, “28”
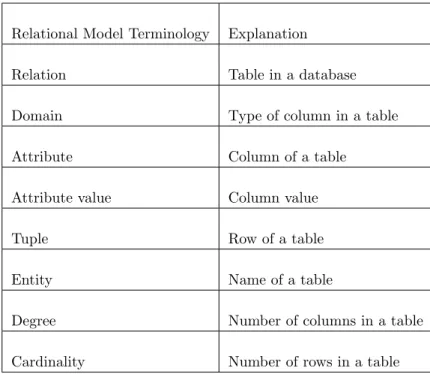
and “5”, represents a tuple. The number of tuples is called cardinality, and the number of attributes is called degree, so the cardinality of Table 3.1 is 7, and the degree is 5. In addition, Table 3.2 is showing more relational model terminologies with their explanations[21].
Table 3.2: Relational Model Terminology
Relational Model Terminology Explanation
Relation Table in a database
Domain Type of column in a table
Attribute Column of a table
Attribute value Column value
Tuple Row of a table
Entity Name of a table
Degree Number of columns in a table
Cardinality Number of rows in a table
Moreover, Codd represented the properties of the relations in [21][19] as follows:
• A row in a table represent a tuple in a relation.
• Each row should be distinct to avoid duplicate row in a table.
• The order of rows should be meaningless.
• The order of columns should be meaningless.
• All table values should be atomic.
3.1.1
ACID
In database systems, a transaction refers to a single logical operation on the data, for example, inserting data into a database. In order to attain the reliability of a transaction, a set of properties, including Atomicity, Consistency, Isolation and Durability (ACID), were proposed in 1983[36].
• Atomicity
Each transaction should be atomic (all or nothing)[27], which means a transaction should be viewed as a whole unit. If any part of the transaction fails, the whole transaction should fail without making any changes on the databases.
• Consistency
Consistency property ensures a transaction should bring the database from one valid state to another after the transaction processes completely and successfully[61]. No matter whether the transactions is correct or not, it needs to keep the database consistent.
• Isolation
Isolation property determines each running transaction should be independent on other concurrent transactions until one has been completed and committed successfully[36]. Thus, the effects of incom-plete transactions should be invisible to other transactions.
• Durability
Durability means once a transaction commits, the changes in the database should remain the same, even in the case of system crashes, power loss or error[27]. This property ensures the execution results can be recorded permanently.
Although the relational databases guarantee the reliability of a transaction through ACID, with the de-velopment of web technologies, the data storage techniques have processed revolutionary changes. Scalability and availability, especially in distributed environments, have played a more important role than before. Be-cause the web-based data is very huge data and distributed naturally in the most cases, it may be challenging for RDMSs to store and process, and this leads to the inception of the NoSQL databases.
3.1.2
Primary Key and Foreign Key
A Primary Key (PK) in a table is a single or a set of columns with unique values that can be used to identify each record in the table uniquely[60]. The value, or the combination of values, of the PK attributes for a tuple should be unique, and not be repeated by other tuples in the table to identify the tuple. Usually, the database management system can assign a constraint to ensure the uniqueness of the Primary Key. The Primary Key can reduce the redundant data in the database.
The Primary Keys need to work with the Foreign Keys in a relational database. A Foreign Key (FK) in a table is a field representing a reference to the Primary Key of another table[60]. In addition, there could be multiple FKs in a table to point to multiple PKs in multiple tables.
Figure 3.1 shows a complex data schema of a relational database. There are six tables, namely “Students”, “students classes”, “teachers”, “Classes”, “sections” and “departments”. Each table has its own Primary Key, the “id” attribute in each table. The attributes “student id”, “class id” and “section id” in table “students classes” are the Foreign Keys and referencing to the “id” of “Students”, the “id” of “Classes” and the “id” of “sections” respectively. The attributes “teacher id” and “department id” in table “Classes” are the Foreign Keys and referencing to the “id” of “department” and the “id” of “teachers” respectively. Also, the attributes “class id” and “teacher id” in table “sections” are the Foreign Keys and referencing to the “id” of “Classes” and the “id” of “teachers” respectively.
3.1.3
Database Normalization
In a database system, when a field repeated in two or more tables, data redundancy may occur. For example, as shown in Table 3.3, data redundancy is occurring in the “CourseID” and “TeacherID” column. Amount of data, such as “CMPT101”, “CMPT102”, “ARGI100” and“CHIN101”, appears several times in the table. The redundancy of data may cause data inconsistency because the same attribute may store with different values, once they do not update consistently. Also, data redundancy increase the required amount of storage. In order to minimize data redundancy, Edgar Codd [20] introduced a concept of database normalization, meaning the process of organizing the attributes and tables of a relational database to minimize data redun-dancy. In addition, normalization broke down a complex domain into independent sub-domains, and each sub-domain can be linked with each other through the Primary Key-Foreign Key relation[23].
Table 3.3: Data Redundancy Example
ID FirstName LastName CourseID TeacherID
1 Yaowen Chen CMPT101 CMPT102 ECON203 STAT245 TEACH1001 TEACH2003 TEACH3231 TEACH4013 2 Sam James CMPT101 HIST204 ECON403 MATH205 TEACH1001 TEACH2243 TEACH3724 TEACH3053 3 Mike Tom CMPT204 ARGI100 CHIN101 MATH205 TEACH1341 TEACH2183 TEACH1291 TEACH3053 4 Ryan Jackson CMPT101 CMPT102 ARGI100 CHIN101 TEACH1001 TEACH2003 TEACH2183 TEACH1291
Furthermore, Codd [19][20] introduced three type of normal form, First Normal Form, Second Normal Form and Third Normal Form. Currently, the most of the relational databases meet the requirements of these three normal forms sufficiently, and the other normal forms, such as EKNF (Elementary Key Normal Form), BCNF (BoyceCodd Normal Form), ETNF (Essential Tuple Normal Form), and DKNF (Domain/Key Normal
Form) are more for academic purposes. Figure 3.2 represents a clear process of database normalization.
• First Normal Form
First Normal Form (1NF) was defined by Edgar Codd [19] in 1971. If a relation is in the First Normal Form, each attribute of the relation should contain atomic values only, and the value of the attributes should be a single value. It ensures the repeating values are eliminated in an individual table, and each set of related data can be stored in a separate table.
• Second Normal Form
Second Normal Form (2NF) is the second step to normalize the databases, introduced by Edgar Codd in 1971[20]. Besides following the 1NF, the Second Normal Form requires the every non-prime attribute of the table should be fully dependent on the entire primary key.
• Third Normal Form
Third Normal Form (3NF) is designed to reduce the duplication of data and enforce referential integrity[20]. A relation is in Third Normal Form if and only if it is in 2NF and every attribute in the table is only dependent on the primary key and not on any non-prime attributes.
Figure 3.2: Database Normalization Process[1]
The database normalization enhanced the relational model and had an important effect on the success of the relational databases. This process decomposes the data into smaller relations and establishes more
meaningful relationships between them to reduce the need for restructuring the relations and make the relational model more informative to users[70]. Moreover, although database normalization process is widely used in RDMSs, it cannot be applied in every situation. Due to the scalability of the relational databases, it may need to add redundant copies of data to improve the readability sometimes. This process is called denormalization, and can improve the performance of database queries.
3.2
Graph Database
3.2.1
NoSQL
Because of the development of cloud computing with large-scale web applications, a new kind of database systems, namely NoSQL, has been adopted in the last decades[38]. NoSQL refers to “non SQL” or “non relational”, so typically, the NoSQL databases apply a different mechanism for storage and retrieval of data other than the tabular relations, which is used in the relational databases[53]. NoSQL databases are becoming common in daily lives and used in more fields, and there are four major types of NoSQL databases, including key-value stores, column family stores, document stores and graph databases. Figure 3.3 represents the four categories of NoSQL graphically. Besides the graph databases, the other types of NoSQL are introduced as below:
• Key-value Stores
Key-Value Stores store data as a typical hash table in a schemaless way[11]. The hash table contains two fields, a key with its value, so data is normally represented as a collection of Key-Value pairs in this model. Since the keys are the unique identification of the record, the data can be quickly found within the database by searching for the key. Because of the simple structure of this storage model, it provides high availability and scalability, and it is ease to use in applications, so it is very useful in distributed environment.
• Column Family Stores
Column Family Stores store data in columns instead of rows, comparing with the relational databases. Also, it stores data in a Key-Value pair, but the key is two dimensional with a column key and a row key[42]. A column contains three elements: unique name (used to reference the column), value (the content of the column) and timestamp (used to determine the valid content). A Column Family is a collection of rows containing a number of columns, so the database can be viewed as one big table. Moreover, a row-by-row approach stores all data in a single entity, and a column-by-column approach ensures the information relating an attribute[56]. Thus, this database model is suitable for dealing with large-scale distributed data.
• Document Stores
indepen-dent of each other, just like the rows in a relational database, but without any restrictions and not belonging to any schema[56]. Similar to the Key-Value Stores, the Document Stores take advantage from applying hash table. On the other hand, unlike relational databases, in which every instance of data has the same format as others, Document Databases store all related data together, and every instance of data can be different to others[15]. In addition, due to the semi-structure of the document, Document Stores offer good performance for large data sets and are flexible in dealing with data.
Figure 3.3: NoSQL Databases[67]
Besides these three types of NoSQL databases, the Graph database is another type of NoSQL databases. The Graph database applies graphs, which consist of nodes and edges, to store and manage data, instead of storing data in tables in a relational database[7]. Also, data can be stored as properties of nodes and edges in graph databases. The structure of graphs offers a high accessibility and scalability in a distributed environment.
Figure 3.4 represents a typical graph database example. There are three nodes in the graph, and each node contains its property, like Id, Name and Age. Also, there are six edges connecting the nodes with others to represent the relationship between nodes. An edge has its property as well, and in this case, the properties are Id, Label and timestamps. Remarkably, these edges can be directional, so the relationships
can be represented directly.
Figure 3.4: Graph Database Example[4]
Graph databases store data in term of graphs, which are a kind of highly interconnected data structure[33]. It is very useful for social networking websites, such as Facebook and Twitter, since it is easy to represent social actors as the nodes, edges as the relationship between users, and properties as the social information about users.
Currently, there still is very limited number of studies having been done about modeling data in the graph database domain, so it is difficult to provide hard rules based on practical applications. Robinson, Webber and Eifrem[65] suggest some general rules, including:
• Nodes can be used to represent entities.
• Edges can be used to represent relationships to connect the entities and to establish the semantic
context for each entity.
• Node properties can be used to represent entity attributes.
• Edge properties can be used to express the strength, weight, or quality of a relationship.
• Relationship direction can clarify relationship more semantically. For bidirectional relationships,
direc-tion can be ignored.
Graph database is a type of databases, and there are three main group graph databases with different models, which are introduced in the following subsections:
• Property Graphs
• Hypergraphs
3.2.2
Property Graphs
The property graph model is a model that is widely used in the most graph database systems. A property graph has the following elements[65]:
• A set of vertices:
1. Each vertex has its unique identifier
2. Each vertex has a number of incoming edges
3. Each vertex has a number of outgoing edges
4. Each vertex has a number of properties associated with it, defined by a map from key to value
• A set of edges:
1. Each edge has its unique identifier
2. Each edge has an incoming head vertex
3. Each edge has an outgoing tail vertex
4. Each edge has a number of properties associated with it, defined by a map from key to value
5. Each edge has a label to denote the relationship between the incoming vertex and outgoing vertex.
Figure 3.5 represents an example of a property graph. It contains three social actors: “Alice”, “Bob” and “Chris”. They are nodes in the graph, and their information, such as name and age, are stored as the properties of nodes. Meanwhile, they are connected by edges, and the information about the relationships is stored as the properties of edges. It provides a clearer explanation of the relationships than the hypergraph, which is introduced in the following subsection.
3.2.3
Hypergraphs
Basically, graph databases store and represent data in terms of graphs, which comprise of nodes and edges, but unlike the property graph, which is an one-to-one relationship, a hyper edge can connect multiple nodes in the hypergraph model[45]. The graph model can easily store and process the many-to-many relationships, which is hard to handle in a property graph.
Figure 3.6 represents a hypergraph example. There are six vertexes in the graph, v1, v2, v3, v4, v5 and v6, four hyper edges, e1, e2, e3 and e4, connecting these nodes. e1 connects v1, v2, v3 and v4; e2 connects v1, v3 and v5; v3, v4 and v7 are connected by e3; similarly, e4 is the link between v5, v6 and v7.
v1 v2 v3 v4 v5 v6 v7 e1 e2 e3 e4
Figure 3.6: Hypergraph Example
Clearly, this model is very simple, but may require description for understanding the relationship. Also, because hyper edges are multidimensional, hypergraphs is a very general model, and it can be translated into a property graph with more relationships, but it increases the cost of storage.
3.2.4
RDF Triples
The Resource Description Framework (RDF) is a standard model for data interchange on the Web[62][8]. It has been used as a general method for conceptual description or modeling of information that is implemented in web resources, using a variety of syntax notations and data serialization formats. In addition, it decomposes any types of knowledge into small pieces, with some rules of the semantics, or meaning, of those pieces. There are some facts about the RDF format[62][48][59]:
• It is a data model in which the basic unit of information is known as an RDF triple (see Figure 3.7).
• The RDF represents information based upon the idea of subject-predicate-object expressions. It also
value.
• To remove any ambiguity from the information stated by a given triple, the triple’s subject and predicate
must be URIs.
Figure 3.7: RDF Triple[2]
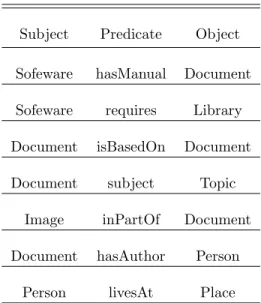
If converting the graph of the RDF triple in the Figure 3.7 into the “ subject-predicate-object”, it will be as follows:
Table 3.4: RDF subject-predicate-object
Subject Predicate Object
Sofeware hasManual Document
Sofeware requires Library
Document isBasedOn Document
Document subject Topic
Image inPartOf Document
Document hasAuthor Person
Person livesAt Place
Currently, RDF is one of the three foundational Semantic Web technologies, and widely used in the Se-mantic Web as a graph database. On the SeSe-mantic Web, there may be no sufficient information to determine
if two nodes are same or not. In order to resolve the identity problem, RDF applies the notion of the URI. URIs work very well for expressing identity on the WWW, so using the URI as a standard for global identi-fiers allows for a worldwide reference for any symbol[12]. It means that people can identify whether any two users in the anywhere in the world are referring to the same thing. This property of URI provides a simple way for a standards organization to specify the meaning of certain terms. The World Wide Web Consortium (W3C) has defined a number of standard namespaces for use with Web technologies including xsd: for XML schema definition; xmlns: for XML namespaces; and so on[62][8].
RDF uses the infrastructure of the Web to represent agreements on how to refer to a particular entity. The RDF standard itself takes advantage of the namespace infrastructure to define a small number of stan-dard identifiers in a namespace defined in the stanstan-dard, a namespace called rdf. rdf:type is a property that provides an elementary typing system in RDF. rdf:Property is an identifier that is used as a type in RDF to indicate when another identifier is to be used as a predicate rather than as a subject or an object[8][59]. In a social network, a typical RDF file that is written by XML can be shownas follows:
$<$ ? xml v e r s i o n = ‘ ‘ 1 . 0 ’ ’ ? $>$ $<$ r d f :RDF xmlns : r d f = ‘ ‘ h t t p : / /www. w3 . o r g /1999/02/22−r d f−syn tax−ns\# ’ ’ xmlns : company = ‘ ‘ h t t p : / / company/ S u p e r v i s o r\# ’ ’ $>$ $<$ r d f : D e s c r i p t i o n r d f : about = ‘ ‘ h t t p : / / company/ S u p e r v i s o r ’ ’ $>$ $<$ S u p e r v i s o r : name$>$ S u p e r v i s o r A$<$ / S u p e r v i s o r : name$>$ $<$ S u p e r v i s o r : c o u n t r y $>$USA$<$ / S u p e r v i s o r : c o u n t r y $>$
$<$ S u p e r v i s o r : company$>$Company A$<$ / S u p e r v i s o r : company$>$ $<$ S u p e r v i s o r : g e n d e r $>$ Male$<$ / S u p e r v i s o r : g e n d e r $>$ $<$ S u p e r v i s o r : age$>$36$<$ / S u p e r v i s o r : age$>$ $<$ / r d f : D e s c r i p t i o n $>$ $<$ r d f : about = ‘ ‘ h t t p : / / company/ S u p e r v i s o r ’ ’ $>$ $<$ S u p e r v i s o r : name$>$ S u p e r v i s o r B$<$ / S u p e r v i s o r : name$>$ $<$ S u p e r v i s o r : c o u n t r y $>$USA$<$ / S u p e r v i s o r : c o u n t r y $>$
$<$ S u p e r v i s o r : company$>$Company A$<$ / S u p e r v i s o r : company$>$ $<$ S u p e r v i s o r : g e n d e r $>$ Male$<$ / S u p e r v i s o r : g e n d e r $>$
$<$ S u p e r v i s o r : age$>$45$<$ / S u p e r v i s o r : age$>$ $<$ / r d f : D e s c r i p t i o n $>$
3.3
Database Benchmark
Performance can be viewed as one of the major issues when evaluating different database hardware, software and configurations, and database benchmarks, which usually are running several of standard tests, are an important tool to assess the performance of databases. Benchmarking is a continuous and systematic process to compare the performance of applications, services and processes in order to improve the outcomes by identifying and implementing the best practice approaches. According to Lee and Jeong[46], the database benchmark normally can be classified into two categories: the generic benchmark and the custom benchmark:
• Generic Benchmarks
This kind of benchmark is created to measure the performance and processes of organizations in un-related industries. Because a generic benchmark is developed to be a domain specific benchmark to focus on a particular application domain, it can be generally used by a large group of customers with the applications to improve performance and processes as well as create new standards.
• Custom Benchmarks
A custom benchmark is implemented by a particular customer for a specific application. It can measure the performance of a database precisely based on customer’s need. However, because it is for a specific application, it cannot be used generally; the cost of designing and implementing the benchmark may be very expensive.
In recent years, because of the development of graph databases techniques, more graph database systems have emerged, so more work about the comparison on the performance of different graph databases has been done. In [26], Neo4j is compared with other scalable graph databases: Jena, HypergraphDB and DEX. The HPC scalable graph analysis benchmark tests the performance of each database for different typical graph operations and graph sizes. Although it tests 1k, 32k and 1M nodes from 9k relationships to 8.4 million, it is still a small amount of a large social network.
Also, Renzo Angles[7] proposed a way to compare current graph database models. That work compares some basic features of nine graph data stores, including AllergroGraph, DEX, Filament, G-Store, Hyper-GraphDB, InfiniteGraph, Neo4j, Sones and vertexDB. But the features about data storing and querying, like the data structures, query languages and constraints just provide a general view about the database systems. It is hard to know the performance of graph database systems on dealing with graph data.
In addition, there is some work comparing the performance of graph databases and relational databases. LinkBench is a recently developed benchmark, which is based on traces from the databases storing social graph data from Facebook, which is a major social networking website[9]. This work characterizes the data and query workload to construct the benchmark, LinkBench. Although this work has compared the per-formance of Neo4j with MySQL on storing social graph data in some fields, it lacks the comparison on the database properties.
Moreover, based on the artificial data model to simulate users of a social networking, the benchmark, BG, is used to evaluate interactive social networking actions[10]. Since there are numbers of interactive actions in a social networking application, such as posting new photos, browsing a profile, and generating a friend request, comparing such performances can be valuable in practical usage. However, BG compares SQL-X, MongoDB and CASQL, without any graph database systems, and it does not measure the capability of handling graph-type data.
Also, since there are different query languages available for different graph database systems, such as SPARQL for AllegroGraph (RDF Triple Store), Cypher for Neo4j (a widely used graph database) and GraphQL for some designed client applications, Holzschuher and Peinl[43] proposed a benchmark to per-formance of query languages running on different database systems. The query language is a great part in the success of a database system, but this benchmark does not focus on the performance of the database, which is the key to this study.
3.4
Social Network
A social network is a social structure made up of a set of actors such as individuals, groups and organizations, and a complex set of the edges tying between these actors[75][69]. The concepts of social networks can be applied in conjunction with the semantic web technology to form the Semantic Social Network. In this context, the social network perspective provides a clear way to analyze the structure of whole society[13]. Like the other networks, a social network also could be represented as a graph (Figure 3.8), G = (V, E), where V is the set of nodes representing people and E is the set of the edges. (V * V) means the relationships, such as friendship, kinship, and conflict, among the nodes, or saying people in the network. The social network is a map of all of the relevant ties between the nodes[30][69]. In a social graph, there can be strong ties, weak ties, and positive ties and negative ties.
Definition: Strong Ties
Strong ties are the relationships that people are linked within the same community and involve frequent interactions[50][57][66]. People usually share the same body of knowledge and are able to transfer information quickly through the strong ties, because of the frequent interactions.
There is a hypothesis about strong ties that was defined by David Krackhardt[50]. Basically, strong ties can play a very important role in severe change and uncertainty. “People resist change and are uncomfortable with uncertainty. Strong ties constitute a base of trust that can reduce resistance and provide comfort in the face of uncertainty. Thus, it will be argued that change is not facilitated by weak ties, but rather by a particular type of strong tie[50].” This particular type of strong tie needs to fulfill the following three necessary and sufficient conditions[50]:
• Interaction: if A and B can be a strong tie, A and B must interact with each other.
• Affection: if A and B can be a strong tie, A must feel affection for B.
• Time: if A and B can be a strong tie, there must be a history of the interactions between A and B,
and the interactions must be lasting over an extended period of time.
Definition: Weak Ties
Weak ties are relationships among people, who are not in the same community or coalitions. They are characterized with relatively infrequent interactions[32][31]. There is a hypothesis about the weak tie that was originally stated by Anatol Rapoport[63], a Russian-born American mathematical psychologist, in 1957. The hypothesis argues that if A is linked to both B and C, then there is a greater-than-chance probability that B and C are linked to each other (See Figure 3.9).
More specially, there are two randomly selected individuals, for example, A and B, from a set S, which contains A, B, C, D, E etc. of all persons with ties to either or both of them. If A have strong ties with both B and C, then, basing on the probability arguments, the B always has a tie with C. In other words, given the other two strong ties, the B-C tie is always presenting, whether weak or strong. The benefit of knowing people with weak ties is that the weak ties can function as the crucial bridges between any two dense clusters of close friends.
Definition: Positive Ties and Negative Ties
In most cases, acquaintanceship is a positive tie. On the other hand, animosity among persons could be a negative tie[63]. In order to represent both positive and negative relations, a model called signed graphs is created. Frank Harary[41][14] stated an important structure theorem for signed graphs. A signed graph is balanced if the product of the signs of all relations in every cycle is positive. On the other hand, if the product is ever negative, it will be unbalanced. The theorem represented that if a network of interrelated positive and negative ties is balanced, then it consists of two subnetworks such that each has positive ties among its nodes and negative ties between nodes in distinct subnetworks. In other words, “my friend’s enemy is my enemy”. Therefore, this theorem could be applied into the social analysis to find potential competitors.
In the social networks, there is a type of graphs in which most nodes can be reached from every other by a small number of steps. This kind of social network is defined as small-world network. According to [35][54], in the late 1960’s, Stanley Milgram did a sociology experiment to investigate social networks. Milgram ad-dressed letters to a particular stockbroker in New York and gave them to people randomly picked at various locations in the U.S.A, and far away from the receivers in that experiment. People could send the letters to people who they knew personally by first name. Eventually, most of the letters reached the destination, and the average number of steps was around six. That phenomenon was called “six degrees of separation”. This kind of network, in which people are linked to each other by only a few links in a social network is known as a “small world network”. This theory could be applied into social network analysis to find the links between people[76].
Moreover, the social network benefits people in their everyday lives, especially for the information trans-ferring and searching. People could share information with their friends, and the friends will share this information with their friends as well, so there will be an exponential transfer of information. Especially on the Internet, people share lots of social information on the social network sites, and the information is spreading very quickly. For example, the followers retweeting a message on Twitter could easily make the message known by more and more users on Twitter.
On social network sites, there are some common social network features listed as follows[73]:
• Social actors:
Every user must register a user account and log into the social network site when they are using the social network site. The social networking site should support several actor types besides users, such
as groups, organizations or companies.
• Social relations:
There are several different types of social relations existing in current social networking sites. A user may need to confirm a relation when it is bidirectional such as the friendship in Facebook, but for the followers in Twitter, it is a unidirectional relation, which cannot be confirmed. Furthermore, the other types of relations between social actors are also noticeable such as blocking other users.
• Content:
There could be multiple types of content being managed by social networking sites such as text posts, pictures, videos, events and links to external sites. Also, some content-oriented social networking sites may provide specific kinds of content. But the social networking sites are supposed to provide support for the most common content types. Furthermore, content visibility should support several options including keeping content private, sharing with contacts, sharing with specific users and sharing the content publicly.
• Activities timeline:
The activities timeline is the stream of more-recent ordered actions performed by social actors. For example, “Yaowen posts a new status”, “Yaowen uploads a new photo”, and “Yaowen shares a video”. The most popular timeline is the home activities timeline made up of all the activities in which the social actor?s followings are involved.
3.4.1
Social Network Analysis
Social network analysis is the analysis of social networks. It will view the social relationships in terms of the network theory. Therefore, the nodes will represent individual actors within the social network, and ties will represent relationships between the individuals, such as friendship, kinship, organizations etc. In addition, according to Scott in 1988, “Social network analysis has emerged as a set of methods for the analysis of social structures, methods which are specifically geared towards an investigation of the relational aspects of these structures. The use of these methods, therefore, depends on the availability of relational rather than attribute data[68].”
Therefore, the social network analysis is the study about the social relationships among a set of actors. It depends on the assumption of the importance of relationships among the social actors in the social network. There are lots of studies of social network analysis focusing on the relationships among social entities and the patterns and the implications of the relationships. As Wasserman described, “the social network perspective encompasses theories, models, and applications that are expressed in terms of relational concepts or processes. Along with growing interest and increased use of network analysis has come a consensus about the central principles underlying the network perspective[75]”. Therefore, excepting the relational concepts, the following concepts are important[75]:
• Actors and their actions are regarded as interdependent rather than independent, autonomous units.
• Relational ties between actors are channels for the resources transfer or flow (either material or
non-material).
• Network models focusing on individuals treat the network structural environment as providing
oppor-tunities for constraints on individual action.
• Network models conceptualize structures such as social, economic, political and so on, as lasting patterns
of relations among actors.
As Robert A. Hanneman[39][40] stated, the social network analysis is more a branch of mathematical sociology than of statistical or quantitative analysis. Mathematical approaches to network analysis tend to consider the data as conclusive, which means the measured relationships and relationship strengths are re-garded as accurately reflecting the final status of the network. Also it assumes the observations are rere-garded as the population of interest rather than a sample of some larger population of possible observations. On the other hand, statistical analysts tend to treat the particular scores on relationship strengths as probabilistic realizations of an underlying true tendency or probability distribution of relationship strengths. Additionally, it tends to consider a particular set of network data as a sample of a larger set or population of such networks or network elements.
There are lots of strategies for deciding how to collect measurements on the relations among the people within the social network. One of those approaches, full network method, can yield the maximum of informa-tion, but it will be costly and hard to execute; also, it may be difficult to generalize. The full network method needs to collect information about each actor’s relationships with all other actors. This approach is taking a census of all ties in a population of actors, rather than a sample in fact. Because it collects information about ties between all pairs, full network data provides a detailed view of relations in the social network. Full network data is necessary to properly define and measure many of the structural concepts of network analysis[40].
The full network method tries to describe and analyze the social structures completely. However, the data of the full network is very expensive and difficult to collect, unfortunately. It is very difficult to obtain data from everyone in a group, and it is very challenging for every member to rate every other member. It only is possible in a very small group. When there is a limited number of specific individuals with whom they are tying with, the full network method will be more manageable. However, if the population of the social network is very large, the method is impossible to execute in the real world[40].
On the other hand, the snowball method gets considerably less information about the network structure, but it is less costly. Also, it allows easier generalization from the observations in the sample to some larger populations. This approach begins with a focal actor or a set of actors. Each of these actors is asked to name some or all of the actors who they are tying with. Then, the actors being named go to name the actors who they are tying with. The process continues until all actors are named[40][47]. Remarkably, with the
development of the Big Data technology, the large social companies, like Facebook, have more capability to process such approach to deeply analyze the social network to get more social information.
But there are two major potential limitations and weaknesses of the snowball method. First, there may be some actors having no connection with others, namely isolates. They cannot be located by this approach, so that the connectedness may be over-stated. Meanwhile, the presence and the number of isolates may be very important features of populations for some analytic topics. Second, there is no guaranteed way of finding all of the connected individuals in the group. It is important to start at a right place. Otherwise, it may miss a whole sub-set of the actors, who are connected but not attached to the starting points. One remarkable fact is that snowball method can be strengthened by selecting good initial nodes. In many studies, there may be a natural starting point. Although this approach may miss the isolators, the approach is very effective to capture the information of network[40][47].
3.5
Mobile Computing
According to Tomasz Imielinski and Henry F. Korth[44], the rapidly expanding technology of cellular com-munication, wireless LANs, and satellite services, has allowed information be accessed from anywhere at any time. This fact encourages more people to use laptops, mobile phones and tablets in their daily life. Regard-less of size, the mobile devices can be equipped with a wireRegard-less connection to the fixed part of the network, or connect with other mobile devices. The resulting computing environment is called mobile computing that no longer requires people to maintain a fixed and universally known position in the network and enables almost unrestricted mobility. As James Bryan Zimmerman[80] pointed out, mobile computing enables improvements in information quality, information accessibility, operation efficiency, and management effectiveness.
• Information Quality:
First of all, mobile computing enables information to be captured at its point of creation, once it has been created. Meanwhile, complex and complete information can be captured more quickly and easily than before. Therefore, the accuracy, relevance, completeness, conciseness, and scope of information will be improved in content dimension.
Additionally, mobile computing has specifications for hardware and software, so that information can be viewed in the format that is easy for the mobile users to use and unambiguous to improve the form dimension of information quality by improving the characteristics of clarity, detail, order, presentation, and media. Therefore, mobile computing improves the time, content and form dimensions of information quality. Although the fidelity of mobile devices may be weak sometimes, for example, when there is the audio on phone calls, which results in very poor quality; or when the mobile device is out of range of the internet, generally speaking, the resulting overall quality of information generated is improved, since the most dimensions of information are improved.
Additionally, mobile computing improves the information accessibility as well. Mobile computing tech-nology offers a wide range of options to fit the different needs of each individual. The improvements in information accessibility cause improved information flow both to and from the central fixed infor-mation system. When the mobile users transmit data to the fixed inforinfor-mation system, the data can be processed in the information system, and then, the data will be available for all other users. Also, mobile computing can increase the information accessibility for the media such as facsimile, audio files, and images.
• Operation Efficiency:
Moreover, operation efficiency can be improved from mobile computing. Mobile computing integrates the technology into the fixed information system, which allows the computing power and information contained within the fixed information system to be structured around the optimum workflow of a mobile worker, rather than altering the mobile worker?s workflow to meet the optimum configuration for computing. The example of news reporting, hotel operations, and health care show mobile technology can be applied to a diverse range of problems and achieve a similar improvement in operational efficiency.
• Management Effectiveness:
Furthermore, mobile computing can improve the management effectiveness, based on the improved information quality, information accessibility, and operation efficiency. Mobile devices can provide more available updated and accurate information to managers, so that they can improve their ability to track work, which is in progress, and the capability to communicate with mobile personnel. Additionally, mobile devices also provide better information to mobile employees. The mobile devices allow them to make more informed decisions locally and minimize the cost and need for management decisions.
Because of the mobility of the mobile devices, people can benefit from using mobile computing, especially in the business. According to IT Policy Compliance Group[34], the biggest benefits of using smartphones and tablets include being able to access business information from anywhere, at any time, access to business applications, access to suppliers and partners from any location, and improve communication capability. On the other hand, although the mobile computing has advantage in mobility, it also has several limitations as follows[17][29][58]:
• Security Risks:
Mobile devices are dependent on the public network normally, which can be accessed by lots of people. The mobile devices are easily attacked through a large number of networks interconnected. In addition, the security issue may be further complicated if users install unknown sources applications. Therefore, security is the main concern when considering mobile computing.
• Power Issue:
the compact size of the many mobile devices such as smartphones and tablets, it is hard to obtain the necessary battery life in daily usage.
• Human Interface with Devices:
Screens and keyboards are relatively small, due to the small size of the mobile devices. Meanwhile, some people may not be able to operate the screen-touch mobile devices accurately. These facts may cause the mobile devices to be hard to operate. Also, the alternate input methods, such as speech recognition, may still need to develop.
• Transmission Interfaces:
Weather, terrain, and the range from the nearest signal points can have an effect on the signal reception of the mobile devices. Therefore, when in tunnels, some buildings, and rural areas, the reception can be very weak.
• Potential Health Issues:
Some people, who use mobile devices when they are driving may be distracted from driving, and it may cause traffic accidents. Also, cell phones may interfere with sensitive medical devices. Moreover, there is a growing number of questions about cell phone signals causing the health problems.
• Range and Bandwidth:
Mobile devices access to the Internet via the GPRS, HSDPS and LTE network currently. Generally, it is slower than direct cable connections, and available with a range of commercial cell phone towers. Additionally, high-speed wireless LANs only have very limited range.
3.5.1
Cross-platform Mobile Application development
In the past few years, there is a great evolution of the mobile computing industry; and there are lots of power-ful mobile devices emerging with the mobile operating systems having better functionalities. Thus, there are many useful features for people such as Global Positioning System (GPS), Music, Camera, Accelerometer, etc., besides the normal tasks like making phone calls and sending text messages[64][71]. These kinds of built-in features make the mobile devices such as smartphones and tablets, more popular in people’s daily lives[28].
Additionally, as mobile applications become increasingly popular with the growth of the mobile industry, the demand for high-performance mobile applications is increasing as well. However, with the emergence of different mobile OSs, such as iOS, Android and Windows Phone, it is really challenging for developers to build applications that can run on different OSs, since each OS has its own language, different API (appli-cation programming interface), and unique Integrated Development Environments (IDE)[37][6]. Therefore, the demand for cross-platform mobile application development frameworks is growing, in order to develop the applications for multiple OSs from the single code base. The main benefits from those frameworks include[55][6][71][72]:
• Reduction of Programming Complexity
Since the different OSs may require developers to write the applications in specific programming lan-guages, such as Objective-C for iOS and Java for Android, to build the native applications, developers need to be familiar with the different languages before writing applications for different OSs. If apply-ing the cross-platform mobile application development frameworks, developers can develop applications using one programming language. It reduces the programming complexity for developers.
• Code Reusability
The cross-platform mobile application development frameworks enable the applications to be compiled for different OSs from the single code base. Therefore, developers can reuse the existing code rather than taking time to rewrite it. Thus, applying cross-platform development can reduce the time and cost for development.
• Reduction of Long-Term Maintenance Cost
Since the cross-platform mobile application development frameworks compile the mobile applications from the single code base, developers do not need to debug for several different code bases, and applying cross-platform development does not need to maintain a large staff to support each platform, so it reduces the long-term maintenance cost.
• Decrement of Required Knowledge
For cross-platform development, developers do not need to know the specification of each platform, like API and IDE. Instead, they only need to be familiar with knowledge of the selected framework for development.
• Sharing the Strengths of Technology
Some technologies have strengths in some tasks to make them easier than others. For example, the programmatic drawing may be easier to be written in HTML and JavaScript than in Java or C#. Developing equivalent applications in the native code may be more complex and time-consuming than applying the cross-platform mobile application development frameworks on development.
• Increment of Market Share
An application for a particular mobile OS may face a limited number of corresponding users. If the de-velopers develop the applications using the cross-platform mobile application development frameworks for multiple OSs, the number of users must be increasing due to the larger user base. Therefore, the occupation of market share will increase as well, and developers can get more from the development of applications.
In the past few years, a lot of cross-platform mobile application development frameworks have emerged. Meanwhile, there has been an explosion of improvement in the mobile application development, because of wide adoption of mobile devices and the fast-growing mobile application market. Those mobile applications
can be categorized into three types: the native application, the Web-based application, and the hybrid application[18][6][72] (See Figure 3.10).
Figure 3.10: Different Kinds of Mobile Application[72]
Native applications development for a mobile OS is the traditional way to build the mobile applications. The native applications have binary executable files that can be downloaded from the app stores, such as Apple’s App Store, Android’s Play Store and BlackBerry’s App World, and installed on the devices. Once the native applications have been installed, users can launch the applications like the other services that the device provides, since the native applications interface with the OS directly, without any intermediary or container[6][72]. Also, the native applications can access all of the device’s capabilities, like GPS, Music, and NFC, by mobile platform vendor. Users benefit from this, especially for the unique features and functionalities that are typical of some particular mobile OS.
For native application development, developers need to write the source code with the additional resource, like images, audio, and various OS-specific declaration file, and then, the source code is compiled in order to create an executable in binary form that can be packaged with the other resource and deployed into the devices.
In addition, the modern mobile devices, normally, have powerful browsers that support HTML5 capability, Cascading Style Sheet 3 (CSS3) and advanced JavaScript. It enables developers to build browser-based applications by using web technologies. One of the most prominent advantages of web-based development is its low barriers of entry. Because the web-based applications are entirely based on the web technologies, such as HTML5, CSS3 and JavaScript, rather than the other complex programming languages, like C#, Ruby or Objective-C, which may be challenging for unskilled developers, more experienced web developers can develop the mobile applications in standard web languages[28][51][37]. Also, this characteristic of web-based applications lowers the cost of development and maintenance.
![Figure 1.1: Social Graph[49]](https://thumb-us.123doks.com/thumbv2/123dok_us/10225682.2926403/10.918.209.705.703.1055/figure-social-graph.webp)
![Figure 3.1: Primary Key and Foreign Key Example[79]](https://thumb-us.123doks.com/thumbv2/123dok_us/10225682.2926403/18.918.177.739.345.814/figure-primary-key-and-foreign-key-example.webp)

![Figure 3.2: Database Normalization Process[1]](https://thumb-us.123doks.com/thumbv2/123dok_us/10225682.2926403/20.918.147.768.529.985/figure-database-normalization-process.webp)
![Figure 3.3: NoSQL Databases[67]](https://thumb-us.123doks.com/thumbv2/123dok_us/10225682.2926403/22.918.206.711.293.793/figure-nosql-databases.webp)
![Figure 3.4: Graph Database Example[4]](https://thumb-us.123doks.com/thumbv2/123dok_us/10225682.2926403/23.918.258.656.149.433/figure-graph-database-example.webp)