The Influence of Design Updates on Users: the Case of Snapchat
Daniel FranzmannGoethe University Frankfurt
Lukas Fischer Goethe University Frankfurt [email protected]
Roland Holten Goethe University Frankfurt [email protected]
Abstract
Today’s smartphone apps are regularly updated and enhanced through software updates. The case at hand is the popular social multimedia messaging app Snapchat that released a design overhaul in February 2018. While the update neither changed any features nor caused any relevant bugs or crashes, it led to an uproar of Snapchat’s users and significantly decreased its app store ratings and consequently revenue. As a result, Snap Inc., the company behind Snapchat, was forced to reverse design changes to appease their users. The initial adverse effects of the update were surprising; however, after using difference-in-difference tests in combination with sentiment analysis, our results indicate that design updates can be perceived negatively by users. We contribute to IS literature by evaluating the effect of design changes and the role of perceived ease of use in the post-adoption stage.
1. Introduction
Developers and publishers of mobile apps regularly roll out software updates to enhance and update their apps. Modern mobile operating systems
have built-in app stores like Apple’s App Store for
iOS devices and Google’s Play Store for Android
devices. These app stores simplify the process for developers to publish app updates – sometimes even several updates (e.g., several hotfixes) can be published on a single day. Further, app users benefit as they get the latest features or bug fixes through an automatic or semi-automatic update process that runs in the background and does not require manual user interventions. In other words, software updates are a commonly used instrument by app developers to introduce changes to their apps. Therefore, app updates are a common phenomenon and occur in nearly all software development and maintenance processes.
Software updates serve different purposes: some updates are used to add specific new features to the app (e.g., the introduction of Facebook’s story feature), while others fix bugs or errors (e.g., a fix was rolled out by Instagram to prevent crashes on Android devices), others close security vulnerabilities (e.g., several mobile apps that used the Electron development framework had to be updated after a security issue was revealed) [12, 13, 19]. Last, design updates are commonly used to change the visual appearance of the app, improving usability and ease of use without altering any of the core-functionalities. Our study uses an exploratory approach and focuses on the surprising adverse effect of Snapchat’s design overhaul that was rolled out globally in February 2018 [46]. We use Snapchat as our exemplary case and the IS Continuance Model (ISCM) as our research framework. As the ISCM was initially developed as a research model in 2001 to asses software in a post-adoption context [3], mobile apps and app design updates were yet uncommon. Today, mobile app developers use design updates frequently to enhance the in-app navigation and overall layout. Therefore our goal is to shed light on this new phenomenon. Specifically, we want to assess how a “simple” design change could lead to such negative an effect that caused a significant drop in Snapchat’s app store ratings, the number of active users, and its revenue [42].
Therefore, this paper is sought to answer the following research question:
RQ: What is the influence of a non-feature design update on app users?
The remainder of this research paper is structured as follows: In the next section, we provide an overview of the related work regarding software updates in general and the ISCM that we use as our theoretical lens. Section 3 describes our research methodology and our data collection process. Section 4 outlines the conducted analyses, describes how we used Snapchat’s app store ratings and reviews from the Google Play Store in combination with text
mining to assess the effect of the design update. In Section 5, we discuss the results of our analyses. Last, we give a short conclusion, outline our contributions to theory and the IS community, and give recommendations for further research and acknowledge potential limitations of our study.
2. Related work and hypotheses
This section describes the related work on software updates in general, the development of the ISCM and how it is currently used to evaluate and assess users’ perception of software updates.
The topic of software updates gained traction in IS literature as well as in mainstream media over the last few years. Some of the most famous and discussed software updates that were released are for example the update that the car manufacturer Tesla rolled out to temporarily increase the range of its cars purchased in Florida – in the wake of Hurricane Irma [45]. Additionally, Tesla recently was able to lower the breaking distance of its Model 3 through another over-the-air update [25]. Furthermore, a faulty software update caused Nest, a famous IoT company, to go offline for several hours thus making remote security services like saving video footage to the company’s cloud service unavailable for users [44]. Likewise, Snapchat globally rolled out a large design update in February 2018 which caused an uproar by its users [42].
Thus, updates can have both a positive and negative effect on their users and ultimately lead to an increase or decrease of app usage. As Recker (2016) outlines: today’s mobile app users generally experience low switching costs. Thus it is particularly easy to change from one app to a different one if users are unsatisfied [30].
Recently, IS literature has started to focus on this phenomenon and assesses software updates as an instrument of software maintenance and distribution strategy: Amirpur et al. (2015), Foerder and Heinzl (2017), and Fleischmann et al. (2016) specifically focus on software updates using the post-adoption lens and adapt the ISCM to this new context [1, 3, 14, 16].
2.1. Software updates
Enhancements and changes of the underlying
base-software are commonly known as software
updates or patches and often go hand in hand with a change in version number and a changelog that is generally provided for documentation purposes. Those updates are often based on bug reports or
feature requests by users who provide valuable feedback [23], or they come from internal feedback as developers often monitor their back-end processes and try to identify actual or future performance issues or bugs [29]. Technically, software updates and their rollout process have already been discussed in the software development and maintenance literature [39]. However, research on how they affect the users is still scarce. In fact, IS literature has just recently started to distinguish between various types of updates and to assess their different effects on the users. Mainly, literature splits updates into feature and non-feature updates [14, 16]. While feature updates are expected to increase the positive perception of software, experiments with non-feature updates show that there are neither positive nor negative effects associated with them [14]. Non-feature updates are bug fixes or hotfixes that do not change the core functionalities of the software [1, 14].
Design updates are a prime example of non-feature updates that are regularly used to improve the usability of apps without adding any additional features. For example, Google developed and
published its Material Design in 2014 and is
continuously changing and tweaking it since then [17]. In 2017, Skype released a redesign of its Windows desktop and Mac version [32], and the introduction of Apple’s iPhone X display notch has led Apple to directly encourage and pressure developers to update their apps to take advantage of the new layout [2]. In general, design updates focus on providing a modern, new and responsive design, keep the users happy, and can also be an instrument used to show an active development process.
2.2. Snapchat
Snap Inc. was founded as a startup by three former Stanford University students and its app Snapchat was publicly released in September 2011 as a social multimedia messaging app [34]. One of its prominent features is the automatic expiration of sent photos and text messages after a specific period or number of views. In 2013, Snapchat introduced a
feature called stories that allows users to share
content for 24-hours with their community; a feature that has seen extent copying [43]. For example, Instagram, Facebook, and WhatsApp offer now similar functionalities. Snapchat is available for both Android and iOS devices and supports 22 languages. With an amount of an estimated 191 million daily active users in the first quarter of 2018, it ranks among the top apps in both Google Play Store and Apple’s App Store [36].
On November 29, 2017, it was announced that Snapchat would receive a design overhaul as an app update [35]. This over-the-air update was first rolled out to smaller beta-testing groups and was made globally available on February 6, 2018 [46]. The global release of the redesign caused an uproar of the
Snapchat community: many users, bloggers,
YouTubers, and other news sources stated that the new design decreased perceived ease of use and made it more difficult for users to access features they wanted to use. The layout was changed drastically, and in-app navigation changed to a large extent. After a significant decrease in average app store ratings, several web-petitions that were signed by millions of people, and criticism by social media stars such as Kylie Jenner, Snap Inc. decided to reverse changes to the design in order to improve the app and make navigation and feature accessibility easier [37]. Thus, we hypothesize:
H1: The release of the design overhaul led to a decrease in Snapchat’s average app store rating.
2.3. The ISCM and perceived ease of use
The ISCM is rooted in the Expectation-Confirmation Theory (ECT) that is rather a paradigm than a clearly defined model. Oliver conducted the first research study that evaluated the effects of expectation and disconfirmation in 1977 who surveyed 243 college students to evaluate the perceived post-exposure product performance of goods by consumers in a marketing context [26]. Later in 1980, Oliver enhanced the findings by creating a research model that incorporates two measurement points and assessed the effects of disconfirmation on the satisfaction and future intention [27]. Therefore, the basic ECT model consists of the following constructs: expectations and
actual performance that lead to positive or negative
disconfirmation (positive, if the performance exceeds the expected performance) that has a direct effect on satisfaction [11]. Ultimately, satisfaction affects the
repurchase or reuse intention. Bhattacherjee was the
first who adapted the ECT to an IS context in 2001 [3]. The model was renamed to ISCM, and it is commonly used to investigate the continuance use intention of software in the context of software updates. In general, both models describe how users’ expectations create a positive or negative discrepancy if they are met or not. This discrepancy, commonly termed disconfirmation, has a direct effect on users’ satisfaction, and ultimately, continuance intention to keep using the software [4]. Therefore, an unexpected software update that improves the users’ perception
of the app over the expected levels has a positive effect and will help to keep users entertained and refrain them from stop discontinuing the app [14, 15, 16].
Perceived ease of use is said to play only an essential role in the initial adoption stage of a software [8]. Thus, IS literature states that after the initial adoption, “ease of use has an inconsistent effect on attitude [...] which seems to further subside and become non-significant in later stages” [3:356]. Additionally, Karahanna et al. (1999) state that “users gain experience with the system, ease of use concerns seem to be resolved and displaced by more instrumental considerations involving the efficiency of the innovation to increase one’s job performance” [20:200].
Thus, perceived usefulness is used to describe the actual perceived performance of an IS [8]. It is described as “the extent to which an individual believes […] (it – the IS) helps them conduct their tasks or jobs” [21:388]. In other words, while perceived ease of use is said to play an essential role in the initial adoption process of an IS, perceived usefulness represents the perceived performance of the IS – which is evaluated after the initial adoption. Consequently, IS literature has not yet assessed perceived ease of use in the context of software or app updates that happen in a post-adoption context, sometimes months or years after the initial adoption of the software. Therefore, we hypothesize that:
H2: The release of the design overhaul led to a decrease of Snapchat’s users’ perceived ease of use.
3. Research methodology
In order to examine the effects of such a non-feature app update on its users, we analyze Snapchat’s Google Play Store ratings and its user-generated reviews. The major design overhaul thereby poses a compelling case as the update contained only visual changes but led to a primarily negative impact on Snapchat’s users. In this section, we describe our approach towards data collection, data preprocessing, and data analyses. Furthermore, the results of our conducted analyses are reported and visualized.
3.1. Data collection process
We obtained two different data sets with user-generated feedback from the Google Play Store. As the majority (about 85%) of all smartphones
worldwide run on Android [7] and Google Play Store is the official app store for Android smartphones, we chose it to be our primary data source. The store is used by Android users not only to download and install mobile apps on their Android devices but further to rate and review those apps [40]. Similar to other app stores, apps can be rated using a 5-star system with one star being the lowest possible rating and five stars being the highest possible rating. Besides providing the opportunity to download apps, the Google Play Store includes a built-in update manager for installed apps. Android apps can be updated either automatically or semi-automatically, but all updates are rolled out “over-the-air” and are free of charge. Thus, app updates differ significantly from fee-based service-packs or software extensions that are still common in other software distribution channels like games where add-ons have to be purchased.
We downloaded the daily star distribution of the app store ratings as well as the reviews provided by Snapchat users using a custom R-script. The resulting data set contains a total of 737,182 reviews and 2,150,972 ratings. This discrepancy occurs as a rating can be submitted without the requirement to publish a review. In order to apply text mining methods, we restricted the reviews to English reviews only. We furthermore excluded empty reviews without any explanatory power. Our data set includes ratings and reviews submitted between May 5, 2017, and May 5, 2018.
In order to ensure a proper text mining analysis of the reviews, we conducted several preprocessing steps [9, 22]. We first converted all characters to lowercase and removed numbers as well as special characters including the punctuation. We then removed stop words that do not have any information value like “and” or “in” using a custom extension of the list of stop words provided by the Python library sklearn [28].
3.2. Descriptives
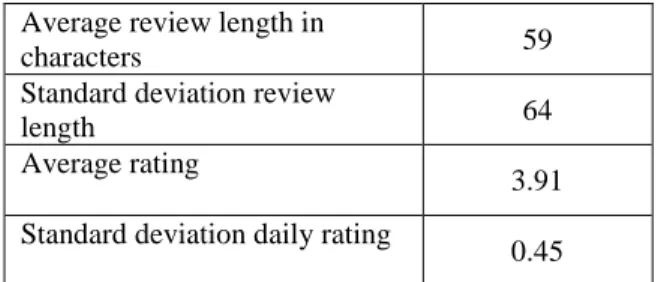
The final preprocessed data set consists of 2,150,972 ratings and 553,025 English reviews. The average length of a review is 59 characters with a standard deviation of 64. The average rating over the entire observed period is 3.91 with a standard deviation of 0.45. The descriptive statistics are summarized in Table 1.
Table 1. Descriptives
Average review length in
characters 59
Standard deviation review
length 64
Average rating
3.91 Standard deviation daily rating
0.45
Splitting the data set into pre-update and post-update data, our data can be described as follows: 353,386 reviews and 1,510,370 ratings were submitted before the major design update, 199,639 reviews and 640,602 ratings were submitted after the major design update. Regarding the remaining descriptives before and after the update, refer to Table 2 below:
Table 2. Descriptives: before and after
Before update
After update Average review length
in characters 56 69 Standard deviation review length 61 73 Average rating 4.04 3.52 Standard deviation daily rating 0.21 0.69
4. Data analysis and results
In this section, we compare the feedback before the update on February 6, 2018, to the feedback after the update.
Our analysis consists of two major parts. In a first step, we conduct a statistical analysis of the average app store rating using a chow-test to test for a structural break and an unpaired t-test to detect level differences. Second, we apply text mining to the available reviews before and after the update.
4.1. App store rating analysis
First, we analyze the average daily star ratings of Snapchat. The statistical analysis was conducted in R. The 7-days moving average of the daily Snapchat
ratings is depicted in Figure 1. The graph shows a
sudden massive drop in the average ratings after the design update had been globally rolled out. In order to analyze whether this drop constitutes a significant
structural break, a Chow-test was conducted. The
Chow-test was initially developed by Gregory Chow in 1960, and its purpose is to test for a structural break in a time series [6]. Time series, in general, can experience unexpected patterns and shifts, which can be defined as either outliers or breakpoints. These can cause structural changes and distort model parameter estimation. The Chow-test uses an F-test to asses if two separate regressions fit the data better – when split into two subsets – than a single one over the whole data set. In order to utilize the Chow-test the date of the structural break has to be known – which, in the case of the Snapchat update, is February 6, 2018 [46]. The Chow-test scores with an F-value of 3.094 and a p-value of 0.000. Thus, we can conclude that a significant structural break in the time series occurred on that exact date.Next, we tested for stationarity of the time series using the Dickey-Fuller test [10]. Based on the significant p-value (Dickey-Fuller: -4.004, p-value: 0.010) we can accept the alternative hypothesis that the time series is stationary.
Last, we conducted an unpaired t-test to test for differences in the ratings before and after the app update. As the Levene-test is significant with an F-value of 173.410 and a p-F-value of 0.000 – rejecting the null hypothesis that the sample variances are equal – we choose to report the results for the Welch two-sample test. As the test is significant with a t-value of 6.993 and a p-t-value of 0.000, we conclude that there is a level difference between the average daily ratings before and after the design update. The mean difference of the star ratings amounts to -0.526.
4.2. Text mining analyses
After identifying a significant drop in average app store ratings, we applied text mining in combination with sentiment analysis to find possible explanations. To get an overview of the impact of Snapchat’s design overhaul in February on the user experience, we analyzed the available Snapchat reviews. The text mining analyses were conducted in Python utilizing the external library Natural Language Processing Toolkit (NLTK) [24].
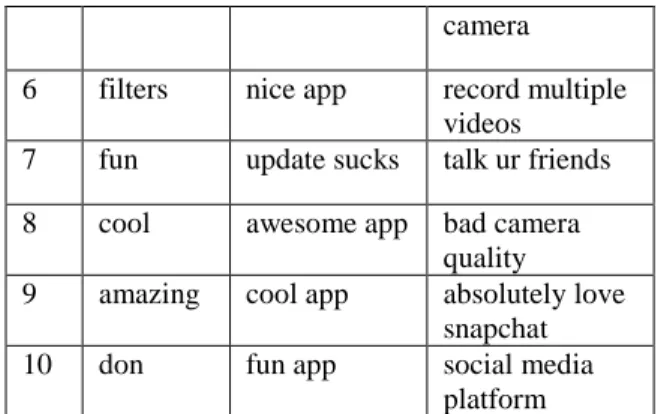
First, we started by performing an n-gram analysis [5]. N-grams are defined as sets of n words that frequently occur together. We calculated n-grams for n=1, n=2, and n=3. Unigrams (1-gram) are thereby equivalent to single words. The n-gram analysis of the reviews before the update is depicted in Table 3. The results are sorted in descending order. The first row thus represents the most frequent unigram, bigram, or trigram respectively:
Table 3. Top n-grams before the update
No. Unigram Bigram Trigram
1 app love snapchat social media
app
2 love social media favorite social
media
3 snapchat worst app multi snap
feature
4 update amazing app social media
apps
5 friends android users front facing
Figure 1. Average app store ratings 0 0.5 1 1.5 2 2.5 3 3.5 4 4.5 2 0 17 -0 5 -0 6 2 0 17 -0 6 -0 6 2 0 17 -0 7 -0 6 2 0 17 -0 8 -0 6 2 0 17 -0 9 -0 6 2 0 17 -1 0 -0 6 2 0 17 -1 1 -0 6 2 0 17 -1 2 -0 6 2 0 18 -0 1 -0 6 2 0 18 -0 2 -0 6 2 0 18 -0 3 -0 6 2 0 18 -0 4 -0 6 2 0 18 -0 5 -0 6 A ve ra ge R a ti n g Date
camera
6 filters nice app record multiple
videos
7 fun update sucks talk ur friends
8 cool awesome app bad camera
quality
9 amazing cool app absolutely love
snapchat
10 don fun app social media
platform
Analogous to Table 3, Table 4 displays the n-grams of the reviews after the major design revision:
Table 4. Top n-grams after the update
No. Unigram Bigram Trigram
1 update update sucks update sucks
ass
2 app love snapchat social media
app
3 snapchat social media update sucks
change
4 love friends
stories
update sucks bring
5 sucks recent update broke don fix
6 hate update ruined favorite social
media
7 stories worst update update ruined
snapchat
8 don User friendly update ruined
app
9 friends update makes update sucks
balls
10 version sucks ass snapchat update
sucks
Comparing the most frequent n-grams before and after the update, we can conclude that the results differ. While before the update, positive associations such as “amazing app” or “absolutely love snapchat”
are predominant, those associations are
overshadowed by negative feedback about the software update after the rollout of the update. Looking at the trigrams, for instance, eight out of the ten most frequent trigrams address the software update.
As the n-gram analysis suggests a change from positive to negative sentiment after the update, we continued by calculating the sentiments of the review texts. The sentiment analysis was conducted using VADER, a pre-trained sentiment-analysis model for
social media text [18]. VADER is especially suited for such an analysis as it is particularly trained to identify sentiments of social media text, being able to correctly assess colloquial English and Internet language. The 7-days moving average of the review
sentiments is displayed in Figure 2. The sentiment is
thereby expressed as a value between 0 and 1 and can be understood as a percentage of positivity. A sentiment of 1 is defined as a purely positive sentiment, a sentiment of 0 as purely negative. The days directly after the design update are characterized by a steep drop in average sentiment indicating a higher dissatisfaction with Snapchat. In the month following the initial drop, the average sentiment slowly recovers and reaches the before-update level in May 2018.
As both the n-gram analysis as well as the sentiment analysis support our argument that the design overhaul caused a decrease overall user perception, we further evaluated a random selection of the reviews qualitatively in order to identify possible causes. Below, we give multiple examples of reviews that specifically talk about how the design update affected perceive ease of use.
Several reviewers explicitly stated that the design update negatively affected the way they use the app and warned others to not update to the latest version:
“New update is once again much worse than the last, Why would I want my stories on the same page as my Snapchat conversations? Stupid layout, even more difficult to use, do not update if you can help it!”
Other reviewers wrote that the app is less accessible and less easy to use:
“New update is TERRIBLE. Can't watch my friend's stories anymore. Preferred the old update so much better because it was actually easy to use.”
“Hate the new update. The new set up is really confusing and everything was way more straightforward and easy to use before […]” Some reviewers even provided direct feedback to the developers:
“Hi team snapchat. We appreciate you wanting to improve the quality of your services to us the benefactors. Which led you into upgrading your application, which initially must have sounded like a great idea to you but it has made the application more complex and difficult to use. We sincerely plead that you revoke this upgrade and give us something similar to its previous state or if possible bring back the old version as it is more easy to use.[…]”
The qualitative assessment further supports our hypothesis that the Snapchat update released in
February 2018 disappointed many users because of
the unfamiliar new de
sign and decreased perceived
ease of use.
5. Discussion
The goal of our study was to identify the reasons behind Snapchat’s sudden drop in average ratings and evaluate the influence of a design app update. In a first step, we extracted data containing the ratings and reviews of Snapchat for one year from the Google Play Store. Second, we ran analyses to test our hypotheses:
(1) We used a chow-test and a t-test to assess if a structural break did occur after the global release of the design update on February 6, 2018. Both tests show significant results: the chow-test scored with an F-value of 3.094 and a p-value of 0.000, while the t-test scored with a t-value of 6.993 and a p-value of 0.000. Thus, we can assume that a structural break did occur on that specific date and that the mean decreased by -0.526 compared 266 days before and 100 days after the update. This timeframe ensures additional robustness, as other IS papers were able to show the effects of app updates for a much shorter period of just two weeks before and after an update [16]. We believe that the reasons behind the re-increase of both the average app store ratings and the review sentiment levels in May 2018 are due to Snap Inc.’s. attempts to appease their users by reversing parts of the design changes [37]. In conclusion, we accept our hypothesis H1.
(2) In order to evaluate the reasons behind this sudden drop in the average ratings, we used text mining to assess the most common n-grams before and after the update. First, all reviews were pre-processed to eliminate noise issues [31]. Second, we extracted the top 10 unigrams, bigrams, and trigrams
from the reviews. Table 3 and Table 4 show major
differences: before the design update, reviewers talked positively about Snapchat by using words like “love” or “favorite social media”. After the global rollout, nearly all of the top n-grams are negative, and many reviewers explicitly describe the negative changes of the update with terms like “update sucks” or “broke don fix”. However, it is worth mentioning that even before the global rollout of the update users already mentioned an update, for example, the bigram number 7 of Table 3 is “update sucks”. Further, there are also reviewers who explicitly state that they “love snapchat” after the update.
This can be explained through the fact that the update-related reviews before the global rollout were done by users who were part of the beta-testers of the app and had access to the update before everyone else had [33, 38]. Regarding positive reviews after the global rollout, we assume that some users liked the design changes and, or wanted to support and protect the developers against such a harsh community reaction. On February 20, 2018, Snap Inc. acknowledged that the design changes had worsened navigation and app usage and started to revert parts through additional app updates [37]. To conclude, we find enough evidence to support our hypothesis H2.
In line with IS literature, we were able to show that a software update had a measurable effect on its
Figure 2. Sentiment analysis 0 0.1 0.2 0.3 0.4 0.5 0.6 2 0 17 -0 5 -0 6 2 0 17 -0 6 -0 6 2 0 17 -0 7 -0 6 2 0 17 -0 8 -0 6 2 0 17 -0 9 -0 6 2 0 17 -1 0 -0 6 2 0 17 -1 1 -0 6 2 0 17 -1 2 -0 6 2 0 18 -0 1 -0 6 2 0 18 -0 2 -0 6 2 0 18 -0 3 -0 6 2 0 18 -0 4 -0 6 2 0 18 -0 5 -0 6 P o si ti ve S en ti m en t Date
users [1, 14, 16]. However, while most software updates lead to a positive effect, our study shows that a major design app update could potentially lead to a forced and new adoption process. In case of the Snapchat update, many users were so unhappy with the implemented design changes that the developers decided to reverse some of the changes [37]. This case demonstrates the power of app users, who, as a community, can significantly influence the app development and maintenance process.
6. Conclusion
We used an exploratory approach to identify the reasons behind Snapchat’s sudden drop in app store ratings, a drop in revenue, and an increase in user unhappiness in February 2018. First, we were able to show that a significant decrease of app ratings happened after Snapchat globally rolled out its design update. Second, we found evidence that the design update worsened the perceived usability and in-app navigation. There is a high likelihood that this design overhaul triggered a new-adoption process of the app that resulted in an adverse effect on the perceived ease of use.
6.1. Theoretical and practical contributions
Our study provides new insights regarding how users perceive design updates. We observe and assess the impact of Snapchat’s design update in February 2018 and find that a design overhaul can have a surprisingly significant impact on the app-perception of its user base – even if the update does not change any of the app’s functionalities. One interpretation of this finding is that a design overhaul that fundamentally changes part of the app-design may lead to a new adoption process of its users where perceived ease of use is a crucial factor and directly impacts satisfaction and continuance intention. Therefore, we provide both theoretical and practical contributions:
First, we contribute to the theoretical topic of software updates (particularly mobile app updates) in IS by showing that perceived ease of use does play an important role after the initial adoption process. Our results suggest that the ISCM should incorporate perceived ease of use and its effects on satisfaction and continuance intention. This is in particular important as today’s software development moves from traditional release models with yearly releases to subscription-based software as a service release model. Second, developers and publishers who are using software updates to implement changes to the
app design should carefully evaluate how testers perceive those changes. User feedback is a crucial factor and developers should not underestimate the potential power of unhappy users. Therefore, it is in particular important for companies, which have a business model that heavily relies on the success of one specific app to listen to user feedback.
6.2. Limitations and further research
We acknowledge that our study has several limitations concerning the generalizability. First, Snapchat’s design update is only a single case that we assessed in the course of our study. Second, the results could depend on the user demographics of Snapchat. The majority of users in the US are young and between 13 and 34 years old, thus using behavior could differ from the average population [41]. Third, we only extracted data from the Google Play Store; it might be possible that iOS users behaved differently and might have been content with the update. However, we believe that this is highly unlikely as we are not aware of such behaviors in the context of software updates. Last, we only used reviews that were written in English for our text mining and sentiment analyses; therefore, cultural differences could potentially affect our results.
We recommend researchers to use our results as a starting point to conduct further research on the effect of software updates – specifically design changes – for mobile apps. Researchers could use quantitative research methods, such as using text mining to identify several other apps that experienced similar major design overhauls. This could be done by conducting keyword searches (e.g., “design update” or “new design”) of app store reviews or app update changelogs. Further, retesting our findings with larger sample size and data from different app stores should help to increase the generalizability of our results. Additionally, we recommend creating a classification scheme that describes and distinguishes between different types of software updates as it would greatly benefit the IS research community. Last, researchers could use qualitative methods such as panel-interviews of users before and after a design update to further evaluate the role of perceived ease of use. It could be particularly interesting to see if long-term users experience a renewed adoption process after the release of a design update.
12. References
[1] Amirpur, M., M. Fleischmann, A. Benlian, and T. Hess, “Keeping Software Users on Board — Increasing
Continuance Intention Through Incremental Feature Updates”, ECIS Proceedings, (2015), 1–16.
[2] Apple Inc., “Update your apps for iPhone X”, 2018. https://developer.apple.com/ios/update-apps-for-iphone-x/
[3] Bhattacherjee, A., “Understanding Information Systems Continuance: an Expectation Confirmation Model”, MIS Quarterly 25(3), 2001, pp. 351–370.
[4] Bhattacherjee, A., and A. Barfar, “Information Technology Continuance Research: Current State and Future Directions”, Asia Pacific Journal of Information Systems 21(2), 2011, pp. 1–18.
[5] Cavnar, W.B., and J.M. Trenkle, “N-gram-based text categorization”, Ann arbor mi, 1994.
[6] Chow, “Tests of Equality Between Sets of Coefficients in Two Linear Regressions”, Econometrica 28(3), 1960, pp. 591–605.
[7] Corporation, I.D., “Smartphone OS”, 2017.
https://www.idc.com/promo/smartphone-market-share/os
[8] Davis, F.D., “Perceived Usefulness, Perceived Ease of Use, and User Acceptance of Information Technology”, MIS Quarterly 13(3), 1989, pp. 319–340.
[9] Debortoli, S., O. Müller, I. Junglas, and J. vom Brocke, “Text mining for information systems researchers: An annotated topic modeling tutorial”, Communications of the AIS 39(1), 2016, pp. 110–135.
[10] Dickey, D.A., and W.A. Fuller, “Distribution of the Estimators for Autoregressive Time Series With a Unit Root”, Journal of the American Statistical Association 74(366), 1979, pp. 427.
[11] Dwivedi, Y.K., B. Lal, M.D. Williams, S.L. Schneberger, and M.R. Wade, Handbook of research on contemporary theoretical models in information systems, IGI Global, 2009.
[12] Electron, “Webview Vulnerability Fix”, 2018. https://electronjs.org/blog/webview-fix
[13] Facebook, “More Ways to Share With the Facebook Camera”, 2017.
https://newsroom.fb.com/news/2017/03/more-ways-to-share-with-the-facebook-camera/
[14] Fleischmann, M., M. Amirpur, T. Grupp, A. Benlian, and T. Hess, “The role of software updates in information systems continuance - An experimental study from a user perspective”, Decision Support Systems 83, 2016, pp. 83– 96.
[15] Fleischmann, M., T. Grupp, M. Amirpur, A. Benlian, and T. Hess, “Gains and Losses in Functionality – An Experimental Investigation of the Effect of Software Updates on Users ’ Continuance Intentions”, ICIS Proceedings, (2015), 1–21.
[16] Foerderer, J., and A. Heinzl, “Product Updates: Attracting New Consumers versus Alienating Existing Ones”, ICIS Proceedings, (2017), 1–19.
[17] Google, “Google Design News”, 2018. https://design.google/news/
[18] Hutto, C.J., and E. Gilbert, “Vader: A parsimonious rule-based model for sentiment analysis of social media text”, Eighth International AAAI Conference on Weblogs and …, (2014), 216–225.
[19] Instagram, “Twitter: Instagram post”, 2018.
https://twitter.com/instagram/status/1004019073158545408
[20] Karahanna, E., D.W. Straub, and N.L. Chervany, “Information Technology Adoption Across Time: A Cross-Sectional Comparison of Pre-Adoption and Post-Adoption Beliefs”, MIS Quarterly 23(1), 1999, pp. 3–16.
[21] Kim, S.H., “Moderating effects of Job Relevance and Experience on mobile wireless technology acceptance: Adoption of a smartphone by individuals”, Information & Management 45(6), 2008, pp. 387–393.
[22] Lantz, B., “Machine Learning with R”, Machine Learning with R, 2013.
[23] Lin, D., C.P. Bezemer, and A.E. Hassan, “Studying the urgent updates of popular games on the Steam platform”, Empirical Software Engineering 22(4), 2017, pp. 2095– 2126.
[24] Loper, E., and S. Bird, “NLTK: The Natural Language Toolkit”, 2002.
[25] Musk, E., “Firmware Update”, Twitter, 2018. https://twitter.com/elonmusk/status/998777288559755264
[26] Oliver, R.L., “Effect of expectation and
disconfirmation on postexposure product evaluations: An alternative interpretation.”, Journal of applied psychology 62(4), 1977, pp. 480.
[27] Oliver, R.L., “A cognitive model of the antecedents and consequences of satisfaction decisions”, Journal of Marketing Research 17(4), 1980, pp. 460–470.
[28] Pedregosa, F., G. Varoquaux, A. Gramfort, et al., “Scikit-learn: Machine Learning in Python”, Journal of Machine Learning Research 12, 2012, pp. 2825–2830.
[29] Popvic, M., B. Atalgic, and V. Kovacevic, “Case study: A maintenance practice used with real-time telecommunications software”, Journal of Software Maintenance and Evolution: Research and Practice 13(2), 2001, pp. 97–126.
[30] Recker, J., “Reasoning about Discontinuance of Information System Use”, JITTA: Journal of Information Technology Theory and Application 16(1), 2016, pp. 21– 31.
[31] Shearer, C., H.J. Watson, D.G. Grecich, et al., “The CRISP-DM model: The New Blueprint for Data Mining”, Journal of Data Warehousing 5(4), 2000, pp. 13–22.
[32] Skype, “Windows Desktop & Mac 8.5”, 2017. https://support.skype.com/en/faq/fa34778/release-notes-for-skype-for-desktop-mac-and-linux
[33] Snap Inc., “Introducing the new Snapchat”, https://www.snap.com/en-US/news/post/introducing-the-new-snapchat/
[34] Snap Inc., “Let’s chat.”, 2012. https://www.snap.com/en-US/news/page/9/
[35] Snap Inc., “Introducing the new Snapchat”, 2017. https://www.snap.com/en-US/news/post/introducing-the-new-snapchat/
[36] Snap Inc., “Number of daily active Snapchat users from 1st quarter 2014 to 1st quarter 2018”, 2018. https://www.statista.com/statistics/545967/snapchat-app-dau/
[37] Snap Inc., “Snap Inc.’s response”, 2018. https://www.change.org/p/snap-inc-remove-the-new-snapchat-update/responses/40722
[38] Snap Inc., “Snapchat Android Beta”, 2018. https://www.snapchat.com/beta/
[39] Sommerville, I., “Software Engineering”, Software Engineering, 2010, pp. 56–81.
[40] Song, P., L. Xue, A. Rai, and C. Zhang, “The Ecosystem of Software Platform: A Study of Asymmetric Cross-Side Network Effects and Platform Governance”, MIS Quarterly 42(1), 2018, pp. 121–142.
[41] Statista, “Snapchat user demographics: Distribution of Snapchat users in the United States”, 2016.
https://www.statista.com/statistics/326452/snapchat-age-group-usa/
[42] The Independent, “New Snapchat Update Can’t be Reversed and Unhappy Users Should ‘Give it a Chance’ Says Company”, 2018. https://www.independent.co.uk/life- style/gadgets-and-tech/news/new-snapchat-update-app- reverse-redesign-android-iphone-users-unhappy-a8201136.html
[43] The Verge, “Snapchat’s next big thing: ‘Stories’ that don’t just disappear”,
https://www.theverge.com/2013/10/3/4791934/snapchats-next-big-thing-stories-that-dont-just-disappear
[44] The Verge, “Entire Nest ecosystem of smart home devices goes offline”, 2018.
https://www.theverge.com/2018/5/17/17364004/nest-goes-offline-thermostats-locks-cameras-alarms
[45] Washington Post, “As Hurricane Irma bore down, Tesla gave some Florida drivers more battery juice. Here’s why that’s a big deal.”, 2017.
https://www.washingtonpost.com/news/innovations/wp/201 7/09/11/as-hurricane-irma-bore-down-tesla-gave-some- florida-drivers-more-battery-juice-heres-why-thats-a-big-deal/
[46] Wojdylo Social Media, “How Can I Get the New Snapchat Update on February 6th, 2018?”, 2018. http://wojdylosocialmedia.com/get-new-snapchat-update-february-2018/