Provided by the author(s) and NUI Galway in accordance with publisher policies. Please cite the published version when available.
Downloaded 2015-11-20T23:38:53Z
Some rights reserved. For more information, please see the item record link above.
Title
How have Contracts for Difference affected Irish equity market
volatility?
Author(s)
Corbet, Shaen; Twomey, Cian
Publication
Date
2013
Publication
Information
Corbet, Shaen; Twomey, Cian (2013) How have Contracts for
Difference affected Irish equity market volatility?. NUI
Galway: Working Paper
How have Contracts for Difference affected Irish equity market volatility?
Shaen Corbet
National University of Ireland, Maynooth
Cian Twomey
National University of Ireland, Galway
Abstract: Contracts for Difference (CFDs) have existed for less than twenty years and the market has grown significantly up to the period before the recent international crises. This paper presents an analysis of how CFDs have affected equity market volatility in Ireland. EGARCH models are used to uncover volatility changes in the periods before and after the introduction of the new trading product in Ireland. We find that CFDs appear to have lowered asset-specific volatility across the majority of equities traded on the Irish Stock Exchange. These findings do not correspond to the expected volatility increase associated with leveraged products that are closely associated with high frequency trading. Our empirical analysis suggests that CFDs are having an alternative volatility reducing effect through the presence of bid and ask price ‘overhangs’ that are generated through the hedging practices of CFD brokers. A fully worked example of the development of an ‘overhang’ is provided.
JEL Classification: G12, G15.
Keywords: Contracts for Difference, EGARCH, Equity Markets, Volatility.
I Introduction
The CFD industry has grown significantly since the product’s creation in the mid-1990s. The market for CFDs grew rapidly after their inception in worldwide exchanges, up to the period before the recent international crises. Investors can use CFDs to open positions either long or short with a standard rate of margin of ten per cent. Therefore the position could be theoretically ten times larger than the amount of capital the investor initially possessed. The combined movements of CFD investors and indeed the hedging practices of CFD providers en masse, could potentially affect the behaviour of equity market volatility in Ireland as a whole. CFDs may have also had a beneficial impact on Irish markets through the addition of new liquidity provided by the product’s leverage.
This paper presents an analysis of the effects of CFDs on Irish equity markets since their introduction in late 2002. An Exponential Generalised Autoregressive Conditional Heteroskedasticity (EGARCH) methodology is used at both the index and equity specific level to investigate volatility differences in the period before their arrival and thereafter. A total number of 4,365 observations between 1998 and 2013 were used in the study. CFDs by their very nature are a leveraged, short-term investment product, with all the characteristics to attract day-trading speculative investment, which has been shown to increase market volatility. This was initially uncovered by Edwards (1988) and Baillie & Bollerslev (1991), with more recent evidence uncovered by Chung, Choe & Kho (2009) and Schwert (2011). Alternatively, CFDs have also been associated with a market anomaly called an
‘overhang’ on the bid and ask prices of the equities for which CFDs are available. These ‘overhangs’ restrict market functionality and hinder trading, thus reducing volatility. This paper aims to determine whether either of these scenarios are present on Irish equity markets.
Numerous aspects of equity market volatility have previously being investigated, with topics based on the influence of futures and options and other derivatives markets studied in depth from a variety of different perceptions. Our research offers a novel approach, based on the influence of CFDs on equity market volatility, the first research to investigate CFDs in this manner. Previous research on CFDs focuses specifically on contract design (Brown et al, 2009). Research based on CFDs is becoming more important as increases in their trading volumes indicate strong growth as a trading product. There is also more evidence coming to light of potential detrimental equity market anomalies stemming from their presence. The EGARCH methodologies used in this research can shed light on volatility changes stemming from the presence of CFDs in Irish equity markets.
The Report of the Irish Banking Commission (2011) to investigate the systemic banking crisis in Ireland found that an ‘overhang’ existed from large CFD trades that were capable of leading to confusion and differing interpretations of what was driving the share price collapse of Anglo Irish
Bank1. ‘Overhangs’ are created when large CFD positions are created and are then hedged using
standard stop losses and limit orders to protect the CFD provider. These findings have acted as motivation to writing this paper, to investigate whether ‘overhangs’ were more pervasive in the Irish market, and indeed whether they caused more systemic problems through potential influences on volatility. An ‘overhang’ develops when significant volumes are placed within a few ticks of the currently traded bid and ask price. CFD brokers would have used stop losses and limit orders to protect themselves from losses stemming from clients running out of margin. The implementation of these large leveraged orders, on an exchange with no other margin availability, would have taken a significantly large amount of fully-margined investment to reduce, or alternatively, a CFD position opened in the other direction. Without either of these events occurring, the average volumes traded would not have been large enough to dissolve the ‘overhang’, therefore the price becomes trapped within a range. Leveraged products have been long-associated with increased exchange volatility, but CFD-initiated ‘overhangs’ may indeed result in volatility decreases. The development of an ‘overhang’ is discussed in detail through a fully worked example in section III.
From a policy perspective, it is vital to understand if CFDs have had volatility impacts upon the equity market in Ireland. If it is the case that CFDs are found to have directly increased volatility as found to be present in numerous other derivatives markets in the associated previous literature, it might be necessary for the exchange and financial regulators to implement rules or regulation changes to mitigate any potential effects. After the findings of the Report of the Irish Banking Commission into the collapse of Anglo Irish Bank, significant volatility reductions stemming from bid and ask price ‘overhangs’ also merit action. These ‘overhangs’ hinder the efficient transfer of
1 The scenario the Report of the Irish Banking Commission (2011) refers to is based on a position allegedly accumulated by an Irish businessman in 2007. In January 2007, this individual purchased five per cent of the bank’s value, and continued to accumulate positions until September 2007, where the position held was approximately twenty-four per cent of the company’s value. It is widely reported that rather than selling the position and significantly reduce the bank’s share price, a side-deal comprising of Anglo Irish Bank loans to purchase its own equity took place. The transfer of this position and the stop losses on a position worth twenty four per cent of the bank at peak would have been significant and certainly strong enough to hinder market functionality at this sensitive time.
information across the exchange and reduce the probability of finding a trading counterparty at a fair price. If for example, it is found that CFDs are negatively impacting market functionality, then policy response will have to focus on tax changes to reduce the appeal to use CFDs for high frequency trading, margin limits to reduce position sizes, holding limits to reduce position accumulation through leverage, or indeed, implement a similar policy decision made by the Australian Securities Exchange and ring-fence CFDs outside the exchange altogether.
The rest of this paper is structured as follows: In the next section we define Contracts for Difference and the previous literature on volatility relevant to this paper. In Section III, we discuss the development of bid and ask price ‘overhangs’ recently uncovered in Irish equity markets. Section IV introduces the research methodology used. Section V follows with an overview of the results uncovered from the EGARCH models used. Finally, in Section VI, we conclude.
II Contracts for Difference and previous literature on volatility
CFDs are structured towards those investors seeking additional levels of higher risk investments in their portfolios. Due to the leveraged nature of CFDs, market movements amplify the investor’s gains and losses in multiples of the provided level of margin. In Ireland, CFDs are usually structured to allow an investor to obtain ten per cent margin, while borrowing the remaining ninety per cent of the investment from their CFD broker. This enables the investor to enhance their buying power tenfold. When CFDs are used to invest, a price increase of ten per cent results in one hundred
per cent profits, whereas a ten per cent fall in price leaves the investor at a total loss2. When the
investor is in this position, they must meet margin calls to maintain the position. Failure to do so results in the position being immediately closed. CFDs therefore act as an extremely cheap, non-selective source of investment finance due to the relative ease of account establishment. CFDs by their very nature thrive in periods of short term extreme volatility, as investors increase their use of leverage to maximise the amount of a particular equity that they can afford. Financial crises therefore generate a thriving environment in which CFDs can trade. Longer horizon investors would refrain from using CFDs due to the commissions and overnight interest charges that must be paid for the use of margin to create leverage. It must also be noted that CFDs are not a common feature across all financial markets. The United States for example has not allowed CFDs to be traded as a
result of restrictions on OTC financial instruments3 implemented by the Securities and Exchange
Commission (SEC). Thus CFDs on US equities are only available to non-US citizens.
In Ireland, CFD licences fall under betting and gambling legislation, therefore all profits are tax free. These tax exemptions stemmed from the Charles Haughey era as the Irish government attempted to grow the bloodstock industry. This tax free characteristic is an attractive trait to investors, who otherwise would have to pay capital gains tax on fully margined equity investments. In 2011, The Central Bank of Ireland raised concerns about the Irish CFD industry. They specifically pointed out that there was a serious deficiency in transparency and a lack of information gathered by CFD brokers (Central Bank of Ireland, 2011). CFD brokers’ clients were also found to have been
2 When the investor has opened a ‘short’ position, a price fall of ten per cent (assuming ten per cent margin) results in one hundred per cent profits, whereas a price increase of ten per cent leaves the investor at a total loss.
accepted without ‘inadequate assessment of appropriateness’ under MiFID regulations4. Risk
disclosures supplied by CFD brokers were found to be inadequate and in some cases misleading. There have been numerous instances of trading irregularities associated with CFD
investment. On the 5th of November 2007, a new phenomenon occurred when CFDs became
exchange traded in Australia. Investors could for the first time observe a CFD exchange separated from the standard equity market, but still trade with the same leverage as before. This decision was taken as a direct response to problematic issues in Australian CFDs from a dramatic lack of transparency across the industry. The ASX was responsible for maintaining a fair and orderly ASX CFD exchange. Counterparty risk was also minimised as the settlements of all obligations were
guaranteed by the SFECC5. In Germany, a report by the European Security Markets Expert Group
(ESME) in 2009, found that a large unwinding by Porsche of options related to CFDs in Volkswagen (VW), combined with takeover rumours, had triggered and fuelled a five hundred per cent price increase in less than seven days in late October 2008. These irregularities have attracted increased investigation into CFDs as a tradable product.
CFDs were originally developed by Smith New Court plc. in the early 1990s, who found purpose for their use as a method of shorting financial markets using high leverage, low margin and tax free investment. They were subsequently bought by Merrill Lynch in 1995 for £526 million. CFDs were institutionally traded until 1998, when they became publically available. In 2002, CFDs were first available on equities present on the Irish Stock Exchange. CFDs fell outside the scope of Irish tax law, therefore offering an attractive investment mechanism to Irish based investors. In November 2002, CFDs were available worldwide on Irish equities. Estimates of CFD trading range from thirty to fifty per cent of total exchange activity on the Irish Stock Exchange since 2002. Trading estimates in the United Kingdom in 2007 were produced by the Financial Services Authority (FSA), who found that ‘the CFD market in the UK has grown significantly in the last five years. Current estimates suggest that about thirty per cent of equity trades are in some way driven by CFD transactions’ (FSA-CP07-20,2007). In Australia, CFDs were found to account for eight to fourteen per cent of total exchange activity between 2008 and 2010. The most liquid equities on the Australian Securities Exchange (ASX) were found to have CFD trading levels above sixty per cent in some quarters in the same time periods (Corbet and Twomey, 2013). Corbet & Twomey (2013) also found significant volatility reductions at both the index and equity-specific level after the introduction of CFDs. The Australian Securities Exchange made the decision in November 2007 to withdraw CFD investment and ring-fence the product to its own separate exchange to mitigate potential effects. Analysis showed volatility increases after this segregation, with the EGARCH methodologies used adapted for international effects, thus reducing the impact of the international financial crisis on the results. CFDs were found to have fuelled ‘overhangs’ when present on the ASX exchange, thus reducing volatility, with the opposite occurring after their segregation.
The existing international literature based on the volatility influencing effects remains sparse. There is literature based on CFDs in commodity and currency markets, but the methodology
4 Market in Financial Instruments Directive (MiFID) applied to investment banks, portfolio managers, brokers, corporate finance firms and some derivative and commodity related firms. MiFID represents the next step into fully integrating the European Union’s financial markets.
5 SFE Clearing Corporation (SFECC) is an Australian company operating all clearing and settlement facilities in Australian equity markets.
and results act only as an explanation of the regulatory restrictions imposed by the Australian Securities Exchange (ASX) to mitigate the potential effects of CFDs such as Brown et al. (2009). There is however a significant amount of non-CFD-specific research aiding this study’s investigation. Primarily, there are those who find that derivatives trading as a whole increases market volatility. The main concern of advocates of this hypothesis is the lack of trading margin that makes the market high risk, as most agents maximise their available funds. Some authors believe that destabilising effects are evident in the market as this speculative investment style tends to originate from uninformed investors. The main advocates of this view are Figlewski (1981) and Stein (1987). Stein in particular, claimed that futures markets in particular attracted uninformed traders because of their high degree of leverage, which can reduce the information content of prices and can cause destabilising market volatility. Other supporting research includes Bessembinder and Seguin (1992), Antoniou and Holmes (1995) and Gulen and Mayhew (2000). Pok and Poshakwale (2004) found similar equity futures market volatility increases, but also noted greater sensitivity of spot market prices to new information and efficiency improvements through faster transfer of information. Other research argues that derivatives trading reduces spot market volatility and in fact stabilises the market. Derivatives in this sense are found to be an efficient medium of price discovery. Other noted benefits include improved market depth, a reduction in market asymmetries and less cash market volatility as found by Kumar et al. (1995) and Antoniou et al. (1998). Other research supporting volatility reductions after investigating derivative products include Bologna and Cavallo (2002), Chathrath et al. (2003) and Drimbetas et al. (2007).
In this paper, we implement an EGARCH methodology on the ISEQ Overall Index and twenty one individual Irish equities between January 1998 and September 2013. The FTSE and DAX are used in the EGARCH models to mitigate international effects at the index level, whereas the ISEQ, FTSE and DAX are used at the equity-specific level. A dummy variable is used to denote the period where CFDs are present in Irish equity markets. The idea here is to obtain results based specifically on the period when CFDs are present. Results are then inferred. Also, we explain the dynamics of the ‘overhang’ and how the results found in this paper indicate their presence.
III How has the ‘overhang’ affected Irish equity market volatility?
The Report of the Irish Banking Commission (2011) to investigate the collapse of Anglo Irish Bank found that ‘overhangs’ specifically influenced the equity volatility of the bank, while misleading investor perceptions of future viability. ‘Overhangs’ in this situation were found to be associated with a decrease in volatility due to price ‘trapping’ effects. This paper attempts to investigate whether these effects can be found throughout all equities on the Irish stock exchange. The starting point to this analysis is to provide a clear understanding of the creation and potential influences of ‘overhangs’ on equity markets.
One major issue associated with CFDs is associated with the decision-making processes of traders using the investment product and their investment horizons. If CFDs were used as a long-term investment vehicle, there would be additional returns sought due to the commissions and interest charges associated with holding the position overnight. Thus buy and hold investors would not view CFDs as a feasible investment mechanism. Short term speculative investors would be the most likely to use CFDs. But how can the introduction of CFDs reduce volatility? We can provide a
simple example by looking at level II data before and after the implementation of a standard market order. We will focus on ABCD plc. as an example. If the price of a share in ABCD plc. is €0.12 at 1pm, a trader would view the hypothetical level II situation in table one.
Table 1: Level II trading data example with no CFD transactions
ABCD plc. 0.12 (-2.50%) 13.01 Vol: 2,400,575
Buy Orders (Volume) Price to buy Price to sell (Volume) Sell Orders 13.01 (1) 80,000 0.115 0.125 90,000 13.01 (3) 13.01 (3) 50,000 0.110 0.130 30,000 13.01 (5) 13.00 (4) 150,000 0.100 0.140 40,000 13.01 (1) 13.00 (2) 90,000 0.090 0.150 10,000 13.01 (2) 13.00 (4) 250,000 0.080 0.160 5,000 13.01 (4) 13.01 (1) 175,000 0.070 0.170 15,000 13.01 (4)
Note: The above table represents an example of the level II data that a trader would view for ABCD plc. in a situation without CFD hedging through stop-losses and limit orders present in the market. The left and right hand columns represent the time and trader number that implemented the order to buy or sell the stock.
If for example, a CFD trader has bought €2 million of ABCD equity at €0.12 using ten per cent margin, and we assume his/her net wealth is €5 million (€2 million invested in CFDs and €3 million held in a margin account with the CFD broker), this means a twenty-five per cent fall in share price results in a total loss for the CFD trader. The CFD broker inputs a limit-order to sell shares at 1.03pm to protect against the price ‘gapping’ their required minimum threshold. The scale of this position becomes evident in table four. The €2 million CFD investment at €0.12 is the equivalent size of a €20 million fully margined investment (166,666,667 shares at €0.09). If the price falls to €0.09, the trader has lost his entire available margin, thus to protect the company, the broker will leave an order to sell the shares at €0.09. Other market agents, unaware of what is transpiring in this brokerage will see the level II data change to:
Table 2: Level II trading data example with CFD broker hedging implemented
ABCD plc. 0.12 (-2.50%) 13.05 Vol: 2,400,575
Buy Orders (Volume) Price to buy Price to sell (Volume) Sell Orders 13.05 (1) 80,000 0.115 0.125 90,000 13.05 (3) 13.05 (3) 50,000 0.110 0.130 30,000 13.05 (5) 13.00 (4) 150,000 0.100 0.140 40,000 13.01 (1) 13.05 (2) 166,756,667 0.090 0.150 10,000 13.01 (2) 13.00 (4) 250,000 0.080 0.160 5,000 13.01 (4) 13.01 (1) 175,000 0.070 0.170 15,000 13.01 (4)
Note: The above table represents an example of the level II data that a trader would view for ABCD plc. after the implementation of a stop-loss order to hedge the CFD broker’s counterparty risk of an investor’s €2 million investment through CFDs. The order of 166,666,667 shares at €0.09 represents a full hedge against the €2 million position opened at €0.12 (The new value of 166.756,667 shares at €0.09 is the combination of the CFD position of 166,666,667 shares and the existing 90,000 shares present before the CFD order was implemented). This also creates a significant ‘overhang’ on the bid-side of the market which is clearly evident from the scale of the position in comparison to other traders in the market on both the bid and ask side of the market. The left and right hand columns represent the time and trader number that implemented the order to buy or sell the stock.
The other traders in the market can now see the extremely large volumes at €0.09 and view this as a large ‘sell signal’. But if the same scenario was to occur when a trader opened a short position, a similar limit order would be placed €0.15. This would create an exceptionally large level of volume to be traded at €0.09 and €0.15, creating an ‘overhang’ which effectively traps the
volatility of the market within this trading range until an equally large trader enters the market with enough financial capital to remove these orders. Until this occurs, the volatility of the exchange would fall as the normal mechanics of daily trading are affected. If we assume that all investors are rational and maximise all investible funds, if they invested using CFDs, their stop losses would be found at the point where they run out of trading margin. Therefore, every CFD trade would be accompanied by an associated stop loss or limit order that would exacerbate an ‘overhang’. These effects would be more pronounced in markets with smaller average trading volumes.
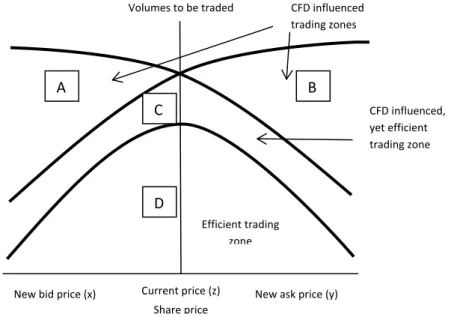
Figure 1: The impact of CFD volumes on the bid and ask price
Note: Figure 1 above shows the theoretical situation when CFD volumes are placed in an exchange to be bought or sold by the market
If there is a high level of CFD trading within the exchange, there would be a reduced probability of an ‘overhang’ been present in the market. This is due to the fact that CFD traders would hold sufficiently large positions to absorb large market orders. The alternative appears to have occurred in Irish equity markets, where there is not enough CFD trading in the exchange to absorb large market orders. In figure one, When a CFD provider implements a stop loss or limit order to hedge a CFD provider against the counterparty risk of holding client positions, areas A and B represent the large volumes now in the market, creating situations where ‘overhangs’ develop. These areas are zones where market volatility fall due to restrictive trading conditions. Zone C is the intersection of both ‘overhang’ influenced trading regions, where there is an appropriate amount of CFD trading on both the buy and sell side of the market, therefore the probability of market volatility effects stemming from CFDs are reduced. We can see that area D is the trading zone with no CFDs present, therefore the reduction of leverage reduces the average trade size in the market, thus reducing the probability of an ‘overhang’ being present.
In figure two, there is a trading zone (area 2) where the fully margined market is unable to efficiently absorb the amount of CFD trading within the market. When there is a small amount of CFD trading in the market (left of line A), the percentage of CFD trading is too small to have any effect, thus fully margined investors dominate, and to the right of line B, there is a sufficient number of CFD traders to absorb the volumes traded. With the availability of data based on the exact
A B
D C
New bid price (x) Current price (z) Share price
New ask price (y) Volumes to be traded CFD influenced
trading zones Efficient trading zone CFD influenced, yet efficient trading zone
percentages of CFD traders per day, it would be possible to calculate these areas and input thresholds of CFD trading to counteract any market hindering effects that CFDs possess.
Figure 2: CFD trading and probability of overhangs in the Irish stock exchange
A B
Probability y
of overhangs
Zone 1 Zone 2 Zone 3
x z
0 Small Medium Large % CFD Volumes traded
Note: Figure 2 represents the relationship between the percentage of volumes on the Irish Stock Exchange that are CFD traded and the probability of the presence of an overhang. At point x, there is no CFD trading available in the market, thus volumes traded are fully margined. Therefore in zone 1, there are a small number of CFD traders in the market, but as this number grows larger in proportion to fully margined traders, the potential for overhangs to be present increases. This also occurs in zone 3 where extremely large CFD traders can dominate the market similar to the Anglo Irish Bank scenario of 2007 and 2008. In zone 2, there are a sufficient number of CFD traders to trade with each other, therefore the probability of an overhang falls.
IV Research Methodology
The primary data source that we use for our analysis includes the daily return for the ISEQ Overall Index and the twenty two largest equities on the Irish Stock Exchange. The data is based on the period from January 1998 to September 2013. The remaining equities on the exchange are extracted from the analysis for issues ranging from insufficient liquidity to lack of availability stemming from nationalisation, bankruptcy and takeover within the period of investigation. To investigate volatility changes in the period before and after the introduction and withdrawal of CFDs, Exponential GARCH (EGARCH) techniques are applied. To calculate volatility changes before and
after the introduction of CFDs, we first calculate daily return as 𝑅𝑡=𝑃𝑡𝑃−𝑃𝑡−1𝑡−1. Dividends in this model
are ignored for simplicity. The EGARCH model uses a dummy variable to signal the inclusion of CFDs as a trading product (November 2002), denoted as zero in the period without CFDs and one otherwise. Results are inferred from the coefficient of the dummy term.
The EGARCH model was developed by Nelson (1991). The ARCH (p) and GARCH (p,q) models impose symmetry on the conditional variance structure and the logarithmic construction of the conditional variance equation ensures that the estimated variance is strictly positive, thus the
non-negativity constraints used in the estimation of the ARCH and GARCH models are not necessary. To mitigate international effects such as shocks and crises, other exchanges can be added to the mean
equation, resulting in the 𝛾 coefficient of the dummy variable 𝐷𝐶𝐹𝐷, being explicitly related to the
exchange being investigated. In this study, the FTSE 100 and DAX 30 were found to offer the most significant explanatory power in the Irish EGARCH analysis. Both are statistically significant at the one per cent level. Therefore, both international and European-specific crises are diluted in the model through their inclusion. The EGARCH model used for each exchange is represented as:
𝑅𝑡 =𝑏0+𝑏1𝑅𝑡−1+𝑏2𝑅𝐷𝐴𝑋𝑡+𝑏3𝑅𝐹𝑇𝑆𝐸𝑡+𝜖𝑡 where 𝜖𝑡|𝜔𝑡−1~𝑁(0,ℎ𝑡)
log(ℎ𝑡) =𝜔+𝛼 ���ℎ𝜖𝑡−𝑗𝑡−1− �2𝜋��+𝛽log(ℎ𝑡−1) +𝛿�ℎ𝜖𝑡−1𝑡−1+𝛾𝐷𝐶𝐹𝐷𝑡
At the equity-specific level, the ISEQ Overall Index is included to dilute Irish-specific crises, therefore resulting in each EGARCH model being specific for each equity investigated. The mean equation changes to:
𝑅𝑡 =𝑏0+𝑏1𝑅𝑡−1+𝑏2𝑅𝐼𝑆𝐸𝑄𝑡+𝑏3𝑅𝐷𝐴𝑋𝑡+𝑏4𝑅𝐹𝑇𝑆𝐸𝑡+𝜖𝑡
but the variance equation remains the same. In both models, ℎ𝑡 is known at the beginning of time t.
𝛺𝑡−1 is the information set at the end of time period t-1. This makes the leverage effect exponential
instead of quadratic and therefore, estimates of the conditional variance are guaranteed to be
non-negative. The EGARCH model allows for the testing of asymmetries, which is picked up in the 𝛽 term.
𝐷𝐶𝐹𝐷𝑡 is included in the variance equation as a representation of the dummy variable included in the
EGARCH model denoting the arrival of CFDs. This variable takes a value of zero prior to the arrival of
CFDs and one thereafter. When 𝛽= 0, the model is symmetric, but when 𝛽<0, then positive shocks
generate less volatility than negative shocks. The model captures the asymmetric features of the dataset, which occurs when an unexpected drop in price due to bad news increases volatility more than an unexpected increase in price because of good news of a similar magnitude. At the equity-specific level, the models are repeated to obtain volatility estimates based on the individual equity at the time of CFD segregation. The EGARCH model is found to be the most optimal methodology to investigate volatility changes between periods. The inclusion of the exchanges to adapt the model for international effects is also found to be beneficial when attempting to segregate financial crisis from that of normal equity market behaviour.
V Results
The first EGARCH model is based on the total ISEQ Overall Index, indicative of changes in exchange volatility as a whole in the period between 1998 and 2013. The results are found in table three. In the total period, it is found that volatility decreased by 6.5% in the period after the arrival of CFDs. The results hold even after the mitigation of international effects through the use of the DAX and FTSE in the mean equation. The results are statistically significant at the five per cent level.
Table 3: EGARCH (1,1) results for the ISEQ overall index
Equity 𝑏0 𝑏1 𝑏2DAX 𝑏3FTSE 𝛾
ISEQ 0.0033
(1.20) (3.27)* 0.1126 (8.74)* 0.1259 (41.85)* 0.6506 (-1.97)** -0.0065
Note: The above table shows the associated EGARCH coefficients in the period before and after the introduction of CFDs in the Irish Stock Exchange. T-statistics are in parentheses where *<0.01, **<0.05 and ***<0.10.
The Irish Stock Exchange consists of over fifty equities, but only twenty-one are included due to insufficient liquidity to provide accurate EGARCH analysis and differing periods of registration on the Irish Stock Exchange. Anglo Irish Bank for example, was nationalised in 2009, therefore was withdrawn from the stock exchange. Despite the period of international crises from 2007 to 2013, the inclusion of the ISEQ, DAX and FTSE appear to segregate international effects, therefore ensuring the EGARCH analysis remains untainted and focused on the equity investigated. In table four, we find the results for the individual equities. Again, the dummy variable signals volatility changes after the inclusion of CFDs.
Table 4: EGARCH (1,1) results for the equities on the Irish Stock Exchange
Equity 𝑏0 𝑏1 𝑏2ISEQ 𝑏3DAX 𝑏4FTSE 𝛾
Allied Irish Bank -0.0005 0.1092* 1.3406* -0.0926* 0.2179* -0.0013***
Aryzta 0.0010*** -0.2221* 0.5005* 0.1042* -0.1594* -0.0018* Bank of Ireland -0.0008 0.0921* - 0.0066 1.1526* -0.0008*** CRH -0.0002 0.0341* 0.9629* - 0.0734* -0.0002 C&C 0.0008 0.0933* - - - -0.0025* DCC 0.0005 0.0668* 0.3883* -0.0059 0.1135* -0.0005 Dragon Oil 0.0011 -0.0149 0.4112* 0.0387 0.3355* -0.0002** Elan 0.0011 -0.0827* 1.7215* 0.0488 -0.3664* -0.0064*** Fyffes -0.0013 -0.1177* 0.1961* -0.0283 -0.1296 -0.0009 Glanbia -0.001*** -0.0805* 0.3180* -0.063*** 0.0523 +0.0013*** Grafton 0.0321* - 0.4153* - - -0.0041* Greencore 0.0005** -0.0004 0.3540* -0.0329 0.1422* -0.0003** Icon 0.0018 0.1242* 0.1339 -0.0238 -0.1045 -0.0055** Irish Continental -0.0001 -0.0326* 0.0942*** 0.0059* -0.0501 +0.0010**
Irish Life & Perm. -0.0019*** 0.1953* 0.9743* - 0.0467*** +0.0056*
Kenmare 0.0046* 0.0149** 0.0701 -0.2053** 0.3828* -0.0069* Kerry 0.0004 - 0.2933* 0.0114 - -0.0021** Kingspan 0.0004*** 0.0175*** 0.6017* 0.1872* 0.2421* -0.0002*** Paddy Power -0.0034* 0.0049 0.3227* 0.0701* - -0.0003 Ryanair -0.0011 0.0059 0.7849* 0.0915 0.2128** -0.0005* United Drug -0.0032* -0.0003 0.2816 0.3800 -0.2874 -0.0029*
Note: The above table represents the estimated γ coefficients for each investigated Irish equity using the discussed EGARCH(1,1) methodology to investigate changes in volatility dynamics after CFD introduction. The robust standard errors
for each of the γ coefficients are marked in parentheses, where *p<0.01, **p<0.05 and ***p<0.10.
Of the twenty-one equities investigated, eighteen show reduced EGARCH volatility since the arrival of CFDs. Only four results prove to be insignificant. Irish Life and Permanent showed a 5.6% increases in volatility, while Glanbia and Irish Continental had a 1.3% and 1.0% increase respectively. Elan and Kenmare possessed the largest decreases in CFD-specific volatility at 6.4% and 6.9% respectively. These results offer significant evidence that the majority of Irish equities experienced a reduction of volatility in the period after the arrival of CFDs. CFDs by their very nature are leveraged,
high-frequency trading product. Derivatives with these characteristics are generally associated with increased volatility therefore the results defy expectation and logic. One theory is that volatility has fallen due to improved flows of information transfer created by increased liquidity. Analysis of the volumes traded on the Irish Stock Exchange present no dramatic increases apart from the period prior to the European financial crisis, with financials showing the most dramatic changes. More explanatory power would be added through the addition of specific CFD trading volumes, but to date this is not possible.
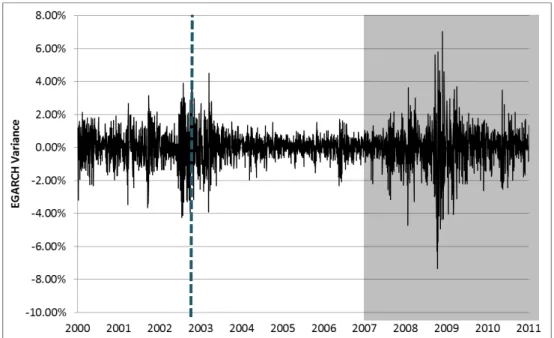
Figure 3: EGARCH volatility of ISEQ Overall Index from 2000 to 2011
Note: The above figure represents the plotted EGARCH volatility of the Irish Stock Exchange between 2000 and 2011. The dashed blue line represents the inclusion of CFDs as a traded product on Irish equities in November 2002. The grey shaded area represents the onset of the international subprime crisis in 2007 while including the European sovereign debt crisis thereon.
An alternative explanation for these results can be provided. There have been several instances of trading irregularities associated with CFD investment. As discussed in section III, The Report of the Irish Banking Commission to investigate the systemic banking crisis in Ireland found that an ‘overhang’ existed from large CFD trades that was capable of leading to confusion and different interpretations of what was driving the share price collapse of Anglo Irish Bank. This may be a key factor in understanding how CFDs reduced volatility, despite all theory based on the product pointing otherwise. It is also important to note that ‘overhangs’ would only be recognised in level II data, as market orders (stop losses and limit orders) used by CFD providers to hedge their risk against clients trades and available margin. Therefore, the size of these positions could have detrimental effects on the market, even though there may indeed be no additional volume traded on the associated equity.
Further analysis of the EGARCH volatility uncovered on the Irish Stock Exchange offer some interesting results. This can be found in figure three. EGARCH volatility oscillated to plus and minus four per cent in the period initially before the arrival of the largest CFD providers in Ireland. Within one year, EGARCH volatility reduced by more than fifty per cent. This continued until mid-to-late
2007, when the full effects of the international subprime crisis took hold. We can see that the peak changes in EGARCH volatility occurred in late 2008 when the international crises were taking full effect. Even though the EGARCH methodology is adapted to mitigate international effects, this result shows the significant strain that Irish financial markets were under during this period.
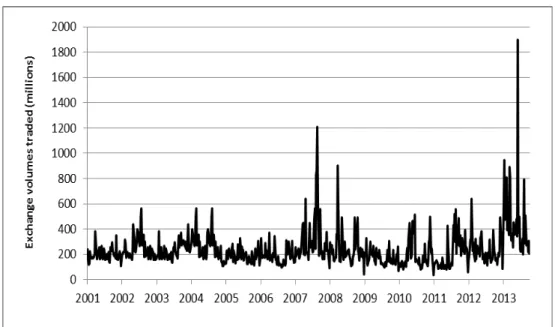
It appears as though the arrival of CFDs in Ireland was associated with a significant and prolonged relaxation of volatility across equities in Ireland. Again, there are no dramatic changes to be found in terms of volumes traded at this time as found in figure four. In fact, between 2005 and 2007, volumes traded on the Irish Stock Exchange were dramatically below the market average between 2001 and 2013 (at times more than seventy per cent). It would appear that there are alternative effects impacting upon the exchange. Combining these results with those found by the Report of the Irish Banking Commission into the banking collapse in Ireland asks significant questions of the role that CFDs have had in the functionality of the Irish Stock Exchange over the last ten years. Figure 4: Total Irish Stock Exchange volumes traded (2001-2013)
Note: The above figure represents the volume of shares traded on the Irish Stock Exchange between 2001 and 2013. CFDs began to trade on Irish equities in November 2002 and from the data we can see an initial spike in trading levels, but no dramatic difference in the period after. In fact from 2005 to 2007, there is an evident decrease in volumes traded. From 2007 to 2013, volumes trade are dramatically higher than normal as Ireland was gripped by financial crises.
The influence of CFDs on Irish equities has been identified through that of the ‘overhang’. These same anomalies have been identified as a source of equity market abnormalities, capable of misleading investor perceptions as found in the review of the Anglo Irish Bank market collapse. The EGARCH analysis provided in this paper shows with certainty that CFDs were not associated with increased volatility, therefore, the presence of market ‘overhangs’ cannot be rejected. With the provision of CFD trading volumes, more detailed analysis could be presented such as that found on Australian equities before and after their ‘ring-fencing’ (Corbet & Twomey, 2013). It would also be of interest to investigate specific equity volatility based on the proportion of CFD investment available.
VI Conclusions
This paper presents an analysis of the effects of CFDs on Irish equity markets since their introduction in late 2002. An EGARCH analysis is used to uncover volatility changes in the periods before and after the introduction of CFDs in Ireland. The EGARCH analysis indicates that the Irish Stock Exchange was subjected to a significant decrease in long-term volatility after the introduction of CFDs at both the index and equity-specific levels. There are no obvious differences in volumes traded at the point of CFD inception, ruling out volatility reduction based on liquidity improvements. These results appear to be associated with the presence of market order anomalies known as ‘overhangs’, stemming from extremely large hedging positions taken by CFD providers, therefore agreeing with the Report of the Irish Banking Commission (2011). These positions can ‘trap’ the market between the bid and ask price, thus artificially reducing volatility as little or no price movement occurs until the orders have deteriorated or are removed altogether. Trading volumes remain in line with market norms, as all activity occurs within the level II data as many of these positions may never be traded or even partially filled. This offers significant explanation to how CFDs have reduced Irish equity market volatility.
In terms of policymaking, it must be noted that anomalies found in the Australian stock market resulted in CFDs being ring-fenced to their own separate exchange in 2007. The large positions built in Anglo Irish Bank resulting in an artificially inflated price were also caused by CFDs. The trading anomaly associated with VW in 2008 was also attributed to options associated with CFDs. The findings of this paper cannot separate CFDs from a potential negative role in the Irish equity market. Therefore, it may be necessary to take a step similar to that taken in Australia, and separate the trading book of CFDs, offering total transparency. At a minimum, position limits should be implemented to reduce the potential for another ‘Anglo Irish Bank’ CFD scenario to occur.
Alternative methods of restricting CFD affects would be to simply increase the minimum margin level. For example, an increase from ten per cent to twenty per cent would move stop losses and limit orders based on margin illiquidity away from the current traded price, thus reducing any ‘overhang’ influence. Alternatively, implementing taxation on CFD trading would reduce the levels traded.
To gain a role as a commonplace investment technique, CFDs have to become more transparent. This is vital to their long-term success. Providers of market data should be encouraged to segregate leveraged positions on Irish equities, along with all CFD stop losses and limit orders. This would allow traders to identify positions that may change direction rapidly should a sharp market movement occur, thus identifying potential ‘overhangs’ in the market. Options and futures products have separate exchanges, even though their products are fundamentally established on the cash market, which provides full transparency so all effects can be viewed by informed traders. Why should CFDs be different?
References
[1] ANTONIOU, A. and HOLMES, P., 1995. ’Futures trading, information and spot price volatility:
evidence for the FTSE-100 stock index futures contract using GARCH’, Journal of Banking and Finance, 19, pp.117-29.
[2] ANTONIOU, A, HOLMES, P. and PRIESTLEY, R., 1998. ’The effects of stock index futures trading on stock index volatility: An analysis of the asymmetric response of volatility to
news?’ The Journal of Futures Markets, 18(2), pp.151-166.
[3] BAILLIE, R.T. and BOLLERSLEV, T., 1991. ‘Intra-Day and Inter-Market Volatility in Foreign
Exchange Rates’, Review of Economic Studies, 58(3), pp.565-585.
[4] BESSEMBINDER, H. and SEGUIN, P.J., 1993. ‘Price volatility, trading volume and market
depth: Evidence from Futures Markets’, Journal of Financial Economics, 47, pp.339-355.
[5] BOLOGNA, P. and CAVALLO, L., 2002. ‘Does the introduction of stock index futures
effectively reduce stock market volatility? Is the futures effect immediate? Evidence from
the Italian Stock Exchange using GARCH’. Applied Financial Economics, 12, pp.183-192
[6] BROWN, G.W., 1999, Volatility, Sentiment and Noise Traders, Financial Analysts Journal, Vol.
55, No. 2 (Mar – Apr, 1999), pp. 82-90.
[7] BROWN, C., DARK, J. and DAVIS, K., 2009. ‘Exchange Traded Contracts for Difference: Design,
pricing and effects’, Working Paper Series, University of Melbourne, Department of Finance,
June.
[8] CENTRAL BANK OF IRELAND, 2011. ‘Central Bank inspection identifies compliance concerns
in Contracts for Difference and Financial Spread Betting Firms’, Information Release, 16th of
June, 2011.
[9] CHATRATH, A., RAMCHANDER, S. and SONG, F., 1995. ‘Does option trading lead to greater
cash market volatility?’ Journal of Futures Markets, 15(7), pp.785-803.
[10] CHUNG, J.M., CHOE, H., KHO, B.C., 2009. ‘The impact of day-trading on volatility and
liquidity’, Asia-Pacific Journal of Financial Studies, 38(2), pp.237-275.
[11] COMMISSION OF INVESTIGATION INTO THE BANKING SECTOR IN IRELAND, 2011. ‘Misjudging
risk: Causes of the systemic banking crisis in Ireland’, Report of the Commission of Investigation into the Banking Sector in Ireland, pp.1-156.
[12] CORBET, S. and TWOMEY, C., 2013. ****************
[13] DRIMBETAS, E., SARIANNIDIS, N. and PORFIRIS, N., 2007. ‘The effect of derivatives trading on
the volatility of the underlying asset: evidence from the Greek stock market’. Applied
Financial Economics, 17(2), pp.139-148.
[14] EDWARDS, F.R. 1988. ‘Does Futures Trading Increase Stock Market Volatility?’ Financial
Analysts Journal, 44(1), pp.63-69.
[15] EUROPEAN SERCURITIES MARKET EXPERT GROUP (ESME), 2009. ‘Views on the transparency
of holdings of cash settled derivatives’, Directives published to The European Commission,
November.
[16] FIGLEWSKI, S., 1981. ‘Futures trading and volatility in the GNMA market’, Journal of Finance,
36, pp.445-484.
[17] FINANCIAL SERVICES AUTHORITY (FSA) OF THE UNITED KINGDOM, 2007. ‘Disclosure of
Contracts for Difference’, Consultation and draft handbook text, FSA-CP07-20,2007,
November.
[18] GULEN, H. and MAYHEW, S., 2000. ‘Stock index futures trading and volatility in international
equity markets’, The Journal of Futures Markets, 20(7), pp.661-685.
[19] KUMAR, R., ATULYA, S. and KULDEEP, S., 1995, ‘The impact of the listing of index options on
the underlying stocks, Pacific-Basin Finance Journal, 3, pp.303-317.
[20] NELSON, D.B., 1991. ‘Conditional heteroskedasticity in asset returns: a new approach’.
Econometrica, 59(2), pp.347-370.
[21] POK, W.C. and POSHAKWALE, S., 2004. ‘The impact of the introduction of futures contracts
on spot market volatility: the case of the Kuala Lumpur stock exchange’, Applied Financial Economics, 14, pp.143-54.
[22] SCHWERT, G.W., 2011. ‘Stock Volatility during the Recent Financial Crisis’, European
[23] STEIN, J.C., 1987. ‘Information externalities and welfare reducing speculation’. Journal of Political Economy, 95, pp.1123-1145.