Facial Biometrics for 2D Barcodes
Marco Querini and Giuseppe F. Italiano
University of Rome “Tor Vergata”, 00133 Rome, Italy [email protected], [email protected]
Abstract—This paper proposes a novel use of 2D barcodes to store biometric data, in particular for facial recognition, which represents one of the least invasive biometric techniques. To accomplish this, we deploy 2D color barcodes, which allow larger storage capabilities than traditional 2D barcodes. To improve the quality of facial recognition, we combine local feature descriptors, such as SURF descriptors, together with shape landmarks identified through statistical models for discriminating faces. The biometric information can be secured through digital signature algorithms, in order to protect biometric data from malicious tampering. The use of color barcodes is crucial in this setting, as traditional barcodes cannot store a suitable number of SURF descriptors for discriminating faces and cannot even afford to store an additional cryptographic payload. We report the results of an experimental evaluation of our system on real-world data sets (i.e., a face database).
I. INTRODUCTION
B
ARCODES are optical machine-readable representations of data, capable of storing digital information about the physical object to which they are attached. Traditional bar-codes, referred to as one-dimensional (1D) barbar-codes, represent data by varying the widths and spacings of parallel lines. The amount of digital information stored in 1D barcodes is limited and could be simply increased by increasing the number of barcode digits or by laying out multiple barcodes. This approach has many negative effects, however, such as enlarged barcode areas, more complex reading operations, and increased printing costs. For this reason, the barcode technology has been deploying geometric patterns (such as squares, dots, triangles, hexagons) in two dimensions: such barcodes are referred to as bidimensional (2D) codes. Due to the plethora of applications for barcodes, there is an emerging need for barcodes capable of storing even more information and more character types in smaller printing space. Both the increasing demand for higher density barcodes and the wide availability of on-board cameras in small devices, such as mobile phones, has motivated the need for 2D color barcodes, such as the colored DataGlyphs developed at Xerox Parc [1], the High Capacity Color Barcode (HCCB) developed at Microsoft Research [2], [3], the high capacity color barcode technique proposed in [4], and HCC2D, the High Capacity Colored 2-Dimensional Barcode by Querini et al. [5], [6]. Color barcodes generate each module of the data area with a color selected from2n-ary scheme (e.g., 4-ary color schemesencoding 2 bit/module or 8-ary color schemes encoding
3 bit/module). Because black and white codes encode 1
bit/module, the data density of a color barcode is expected
to be doubled (4 colors) or tripled (8 colors) in comparison
with the corresponding data density of black and white bar-code.
In this paper, we consider new scenarios in which barcodes may play a significant role for storing biometric information. In particular, we focus on facial recognition, which represents one of the least invasive biometric techniques. We show how to embed facial features in colored 2D barcodes, which can be printed on a paper document, such as a nominative ticket. In addition, the biometric data may be secured within the barcode by using either digital signature or other cryptographic algorithms, in order to prevent malicious tampering. Note that neither a network connection nor a remote repository is needed if the barcode is able to store enough information; this depends both on data capacity limits of barcodes and on the minimum amount of biometric information which is necessary for discriminating people on the basis of their facial features. Given (still or video) frames which represent the owner of the document, one can use the information stored in the 2D barcode embedded in the document to verify automatically the identity of its owner. In other words, this mechanism allows it to verify quickly the claimed identity of the person holding the paper document (such as an admission ticket), without requiring human intervention, by just comparing locally the output of his/her facial scan with the data stored in the document itself. There are few typical scenarios for this application. For example, there are several cases of sports and recreational events with nominative admission tickets. In such cases, the entrance foot traffic to the event may be fairly stringently controlled in queues, turnstiles or security checkpoints where spectators may easily undergo facial scans. An application of this kind occurs frequently at sport events, e.g., at Italian football matches, where the entrance tickets must be nominative and not transferable: in such a scenario, checking manually tens of thousands IDs at the stadium entrance is a slow, cumbersome and costly task. In this paper, we focus on the verification problem, in which the system needs to confirm or reject the claimed identity based on the input face, and do not address identification problems (where the input is an unknown face, and the system reports back the determined identity from a database of known individuals).
Although computer chips and RFID tags have been previ-ously used for storing biometric information (e.g., Germany introduced its electronic passport containing a chip with a dig-ital photo as biometric identifier [7]), they are not suitable for low-cost solutions, such as those involving paper documents (i.e., paper tickets) rather than smart cards (i.e., pass cards). Compared to computer chips and RFID tags, barcodes have
smaller storage capacity and cannot be used as active elements, but they are much cheaper and do not require specialized hardware for retrieving data: indeed, barcodes are inexpensive, passive read-only elements whose content cannot be altered and can be decoded by many ubiquitous and low-cost devices, including smartphones.
The main contributions of this paper are the following. First, we investigate techniques for the extraction of facial characteristics which are not only robust to distortions (such as pose and illumination changes) but also suitable for being embedded into barcodes. This study leads us to identify the most suitable facial features that can be stored in 2D barcodes, while still supporting reasonably good recognition performances. Second, we engineer existing 2D color barcodes in order to increase their data density, so that they can store a sufficient number of facial features and a reasonable cryptographic payload. In particular, we show how to modify HCC2D, the High Capacity Colored 2-Dimensional Barcode so as to increase its data density up to 3,904 bytes per square inch. Finally, we conduct an experimental study to assess the precision, accuracy and performance of our system for embedding facial biometrics into 2D barcodes.
II. RELATEDWORK
An alternative approach for embedding biometric identifiers in 2D barcodes is presented in [8], where personal data (e.g., first and last name) are encoded in a PDF417 barcode, while the face and fingerprint images are watermarked in the 2D barcode itself. This approach does not deal with facial biometrics, but rather it relies on hiding a given face image in the barcode that stores the corresponding personal data. Unfortunately, watermarking systems require a big host image (in this case the barcode) to store and detect reliably the secret image (in this case the face image), which results in less reliable performances for secure identity verification.
Similarly to our approach, the FaceCerts system by Kirovski et al. [9] aims at verifying identities by means of facial bio-metric information stored in 2D barcodes. However, FaceCerts stores the full face image in a compressed fashion, while our work relies on facial feature extraction (to generate a compact biometric representation) and on feature matching (to verify similar or different biometric representations of two imput faces). The benefit of our feature extraction approach is that, while the FaceCerts compression method has to be trained extensively on a suitably chosen face database, our method does not require any training step and therefore it appears to be more general.
III. FACIAL BIOMETRICS FOR2DBARCODES
In this section we investigate techniques for the extraction of facial features to be included in 2D barcodes. The main challenge for those methods is to be able to withstand dis-tortions, such as pose and illumination changes, while still providing adequate accuracy for biometric recognition with a relatively small amount of storage. We remark that this is a non-trivial task: even face recognition schemes that are
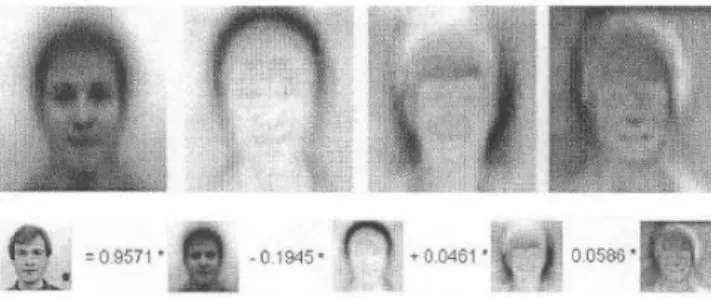
Fig. 1. Representing a face as a linear combination of eigenfaces with the eigenfaces method.
accurate in standard conditions (i.e., adequate illumination, adequate image quality), can have their accuracy easily com-promised by the combined effect of illumination changes and pose variations. We try to identify the most suitable facial biometrics techniques for implementation in 2D barcodes. First, methods based on dimensionality reduction of the face space are investigated (see Section III-A). Next, methods based on statistical models are evaluated (see Section III-B), considering both Active Shape Models (ASM) and Active Appereance Models (AAM). Finally, salient point detectors such as SIFT (Scale Invariant Feature Transform) and SURF (Speeded Up Robust Features) are analyzed (see Section III-C). Note that all the above methods are techniques for general object recognition, which have been specialized to the more specific problem of facial recognition.
A. Methods based on dimensionality reduction of the face space: Eigenfaces and Fisherfaces
One of the most commonly employed technique for facial recognition is the eigenfaces method, proposed by Turk and Pentland in [10]. This method is based on transforming a set of face images into eigenvectors called “eigenfaces”, so that each face is represented as a linear combination of those eigenfaces. Figure 1 illustrates an example where a face is represented as a weighted sum of four eigenfaces.
The eigenface method, which uses principal components analysis (PCA) for dimensionality reduction, yields projection directions that maximize the total scatter across all images of all faces. As observed by Belhumeur et al. [11], in choosing the projection which maximizes the total scatter, PCA retains the unwanted variations due to lighting and facial expression and thus, this approach is not very robust to illumination changes. Several solutions for this problem have been proposed, such as schemes including de-illumination and re-illumination of faces in the image domain [12] or illumination normalization using histogram equalization [13]. All of the above schemes build on compensating the illumination effects rather that using an ap-proach that is inherently robust to it. The fisherfaces apap-proach (a derivative of Fisher Linear Discriminant (FLT)) has been introduced in [11] for dealing with large variations in lighting directions and facial expressions. Like eigenfaces, fisherfaces are eigenvectors also facing the challenge of dimensionality reduction of the face space. The fisherface method has been
Fig. 2. Shape landmarks of a sample face identified through Active Shape Model. Figure taken from [16]. (Viewed better in color).
proved to have lower error rates than the eigenface technique. In both cases, the most appropriate number of eigenfaces or fisherfaces to be used must be determined empirically. If this number turns out be large, however, this approach may not be suitable for storing biometric information in barcodes, due to the limited storage available.
B. Methods based on statistical models: Active Shape Models and Active Appereance Models
Active Shape Models (ASM) and Active Appearance Mod-els (AAM) focus on shape and appearance for object localiza-tion. In particular, both techniques model shapes using a set of landmarks, i.e., points of interest within an object (in our case, a face), and learn the valid ranges of shape variation from a training set of labelled images. This means that (valid) shapes are constrained to vary only as seen in the labelled examples of the training phase. For each image (supposed to represent a face), the model is deformed to fit the face instance represented in the given image. ASM matches the model points to the new image using an iterative technique which works as follows. A search is made around the current position of each point for finding a point nearby such that the model of the texture expected at such landmark is best matched. The parameters of the shape model controlling the point positions are then updated to move the model points closer to the points found in the image. The main difference among ASM and AAM is that ASM only uses shape constraints (identified through a study of variation of shapes), while AAM also considers the texture across the target object (variation of both shape and appearance). ASM and AAM were compared against each other in [14]. ASM is faster, has a larger capture range and achieves more accurate feature point location than AAM, while AAM gives a better match to the image texture. Here, we focus on ASM, which has been used successfully in many application areas, including face recognition [15]. Figure 2 shows shape landmarks of a sample image.
C. Methods based on salient point detectors: SIFT and SURF detectors
The Scale Invariant Feature Transform (SIFT) is a computer vision algorithm used to detect and to describe local features in images, i.e., a scale invariant interest point detector. Even if SIFT has been widely used in face recognition [17], [18], its computation cost in the matching phase is high. The
Fig. 3. Surf Features of a sample face. Figure taken from [20]. (Viewed better in color).
Speeded Up Robust Features (SURF) algorithm is a scale-invariant interest point detector and descriptor (just like SIFT), which was designed to be computationally faster. One of the main differences between SIFT and SURF is that each of the SIFT features has usually 128 dimensions, while this figure is reduced to 64 in SURF. This accounts for the faster performance in the matching phase and the reduced storage required by SURF, which is still able to maintain comparable or even better accuracy than SIFT. For these reasons, we focus on the SURF algorithm which, similarly to the SIFT detector, has been recently used for face recognition [19] [20]. Figure 3 shows the SURF features of a sample face.
D. Summary for facial biometrics in 2D barcodes
We performed a thorough study to identify the most suitable facial biometric techniques for 2D barcodes, by focusing our attention on methods that produce biometric data fitting into the storage area of a barcode, but having still good overall performances in the recognition phase. First of all, approaches based on either eigenfaces or fisherfaces revealed not to be appropriate. We motivate this for eigenfaces only, since the motivation for fisherfaces is completely analogous. In practical scenarios, most faces can typically be identified using a pro-jection on about 100–150 eigenfaces. Although 2D barcodes can store 100-150 eigenface weights (which result in at most 150 floating-point numbers), they cannot store all the required eigenfaces vectors, since the size of 150 k-dimensional vectors is too large to fit in the space available. On the other side, Active Shape Models (ASM) seemed to be appealing for our problem. This is because shape landmarks fit into 2D barcodes (e.g., if 76-point ASM models are used, only 76(x, y) coor-dinates have to be stored) and because landmarks are useful both for face alignment and face recognition. Finally, SURF descriptors seemed to be useful too. Indeed, according to the analysis performed in [20], about 30-100 SURF descriptors per face are able to represent the salient features of the face itself, which was also confirmed in our experiments. Storing up to 100 SURF descriptors (64 floating-point numbers per descriptor) is still a challenge for barcodes, and it can be made possible by a clever use of 2D color barcodes and by a strong coefficient quantization: indeed, up to 3,200 bytes are required with a 4-bit quantization of SURF coefficients (see Section V-A5). Note that a single Data Matrix or QR code are not capable of storing such coefficients (e.g., the maximum capacity of a single QR code is 2,953 binary bytes).
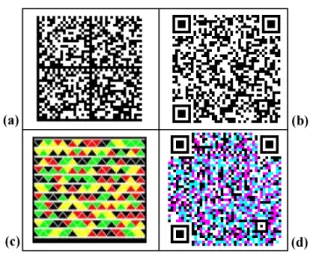
Fig. 4. Samples of high capacity barcodes: (a) Data Matrix, (b) QR code, (c) Microsoft HCCB, and (d) HCC2D code (Viewed better in color).
IV. HIGH CAPACITY2DBARCODES
In this section, we review high capacity 2D barcodes, in particular Data Matrix, QR Codes, HCCB and HCC2D, and analyze their data densities. Data Matrix [21] is a 2D sym-bology which consists of nominally square modules arranged within a perimeter finder pattern. Quick Response (QR) codes [22] are quite widespread among 2D barcodes, because their acquisition process appears to be strongly reliable, and are suitable for mobile environments, where this technology is rapidly gaining popularity. A high capacity barcode named HCC2D (for High Capacity Colored 2-Dimensional), which preserves the strong robustness of QR codes and use colors to increase their data density, was introduced in [6]. The HCCB barcode of Microsoft [2] encodes data as triangles and uses different colors, where the color chosen for each triangle is data-dependent. Figure 4 illustrates the 2D symbologies analyzed through this study.
In the following, we compare the data density achieved by each 2D symbology under the same assumptions:
• ≃ 15% error correction (i.e., each code is robust to
symbol error rates (SER) up to ≃1.5∗10−1).
• 600 dpi resolution both for printing and scanning (i.e.,
600 dots per inch, which is a reasonable resolution for common uses and more widely available).
• 4 dots/module. Because it is recommended for stable
operations that each barcode module is made up of at least 4x4 printer dots, all of the following results are under this assumption. At 600 dpi yields150×150modules/inch2. Because barcodes which are exactly 150 module wide are not available for Data Matrix, QR codes or HCC2D codes, we have selected the closest format available (i.e., QR code: 149×149, HCC2D code: 147×147, Data Matrix: 144×144). Then, in order to perform a reliable comparison, we have extended the calculation for barcodes 150 modules wide.
1) Quick Response (QR) code: In these settings, the data density expressed in bytes per square inch (QR code, Version 33, error correction level M, 149×149 module area, 1,631
Fig. 5. Sample of High Capacity Colored 2-Dimensional Code:4-ary color scheme, 147 modules wide and height (147×147). This HCC2D code whose printout-size is1.0×1.0inches2is storing 3,904 binary bytes. This format
is robust to symbol error rates up to1.03·10−1. (Viewed better in color).
data bytes (i.e., 13,048bits)) is: 1,631bytes 1492 modules2× 600dots inch 4 dots module !2 ≃1,652bytes/inch2
2) Data Matrix: The data density expressed in bytes per square inch (Data Matrix,144×144module area,1,558data bytes (i.e.,12,464bits)) is:
1,558bytes 1442 modules2× 600dots inch 4 dots module !2 ≃1,690bytes/inch2
3) Microsoft HCCB: The data density of HCCB is given by 2,000bytes/inch2at 600 dpi using a 8 color palette. Note that we could not experiment with HCCB, since it is not licenced to external parties. Thus, the data reported here is taken from [2].
4) HCC2D code:In this settings, the data density expressed in bytes per square inch (HCC2D code, 4-ary color scheme, 147×147module area,3,082data bytes (i.e.,24,656bits)) is:
3,082bytes 1472 modules2× 600dots inch 4 dots module !2 ≃3,209bytes/inch2
Note that, as discussed in Section III-D, the data densities considered are still not sufficient to store the biometric data which seem necessary for face recognition, i.e., all SURF descriptors related to a face image. For this reason, we describe next how to engineer the HCC2D code to obtain even higher data densities.
A. HCC2D codes for facial biometrics
The above results about the data density of HCC2D codes are related to codes (using a 4-ary color scheme) which are robust to symbol error rates (SER) up to1.875·10−1. Because the experimental SER (i.e., the percentage of incorrect bytes) was found to be under 10−1 for HCC2D codes using a 4-ary color scheme, we reduce the redundancy (introduced by channel coding for correcting errors) in order to further increase their data density. This yields 3,904bytes/inch2 for HCC2D codes which are robust to symbol error rates (SER) up to 1.03·10−1. This code format allows the storage of all the SURF descriptors needed, along with the shape landmarks identified through Active Shape Models (see Section III-D) and still leaves some space for the cryptographic payload. Figure 5 shows a sample HCC2D code storing 3,904 binary bytes (i.e., data without any compression) in1.0×1.0inches2.
V. OUR BIOMETRIC VERIFICATION SYSTEM
The novelty of our approach lies in two main aspects. We first combine in a novel way local feature descriptors such as SURF descriptors and shape landmarks identified through ASM for discriminating faces. Next, since an adequate number of SURF descriptors able to discriminate different faces cannot be embedded in existing 2D barcodes, we find a way to embed those features into properly extended HCC2D codes. Previously, SURF descriptors and shape landmarks have been combined only to optimize the face alignment in ASM. Indeed in [23] SURF descriptors were used to improve the localization of the initial landmarks from which ASM starts, so that the iterations of ASM could converge faster and with less errors. In our approach, the combination of SURF descriptors and shape landmarks is more heavily exploited in the following tasks:
• Face detection and cropping:we use the shape landmarks
identified by ASM for separating the image background from the face, i.e., to crop the face area. This ensures that the extracted SURF descriptors are likely be related to the faces only.
• Face alignment: we use shape landmarks for detecting
and filtering out misaligned faces. This ensures that SURF descriptors are extracted from frontal images, in order to improve the performance of the matching and recognition phases.
• Face recognition: we combine SURF descriptors and
shape landmarks to discriminate faces. Two input faces are recognized as being associated with the same person under the following conditions:
– Given SURF descriptors extracted from the two images, the more the SURF descriptors match, the higher the probability that the images represent the same person.
– Given shape landmarks extracted from two images, face proportions are computed for each image. The more the face proportions building on shape land-marks match, the higher the probability that such faces represent the same person.
We next detail the the generation phase and the verification phase of our system.
A. Generation phase: identity registration
The object of the generation phase is to compute a compact representation of the facial features of a given person. The process starts with video frames of his/her face as input and ends with the generation of a square inch HCC2D code storing the corresponding facial features (secured through digital sig-nature). The generation phase consists of the following tasks.
1) Select key video frames: In order to improve the overall performance, systems based on face recognition tend to cap-ture a short video of the person (which is made up of 25 frames / images per second in the PAL video standard) rather than to capture a single image. Key video frames can be selected as the ones representing frontal faces, while frames representing
Fig. 6. Shape landmarks of two faces in different pose variations. Because a 76-point ASM model has been used, 76 landmarks per image are identified. Faces taken from the FEI Face Database [24]. (Viewed better in color).
misaligned faces are discarded. As mentioned before, we use shape landmarks identified through ASM for detecting and filtering out misaligned faces. Figure 6 shows shape landmarks of two sample faces in three pose variations. Figures 6 (a), (b), (d) and (e) were accepted as key frames, while Figures 6 (c) and (f) were discarded.
2) Pre-process key video frames: The subset of key video frames previously selected contains frontal face images. We perform a pre-processing step, consisting in face cropping, normalization and histogram equalization. As mentioned be-fore, we use shape landmarks for cropping face areas, i.e., for removing the background of face images.
3) Extract SURF descriptors from key video frames: We extract 64-dimensional SURF descriptors from the cropped key frames representing aligned faces of the person. According to [20], this produces about 30-100 descriptors per image. The previous steps ensure that SURF descriptors are actually extracted from frontal images and represent face features rather than the image background.
4) Select discriminative SURF descriptors: The objective of this step is to identify the set of SURF descriptors which better represent the input face. Consider that SURF descriptors (extracted from face images) partially depend on characteris-tics of the specific image (e.g., on the facial expression of the person). In order to select SURF descriptors independently of the specific image, we compare the descriptors extracted from different key video frames, and consider more representative those features that match among several key video frames.
5) Quantize Surf descriptors: Note that each SURF de-scriptor selected in the previous step is represented by 64 dimensional data, i.e., by 64 floating-point numbers. With no further optimization, each descriptor is thus 256 bytes long, which appears as an unacceptable storage burden if we need to store up to 100 descriptors in a single barcode. For this reason, in our approach each coefficient is quantized with 4 bits, so that each descriptor is just 32 bytes long. In our exper-iments, coefficients quantized with 4 bits were still acceptable, while stronger quantizations lead to an unacceptable loss of
information. Whenever we have less descriptors for a given face image, we can quantize coefficients with 8 bits in order to get better performance.
6) Synthesize a compact feature representation: The ob-jective of this step is to provide a compact representation of facial features which is suitable for being embedded in a 2D barcode, but yet representative of the given person. We store the following features:
• Up to 100 SURF descriptors which match different key
frames. Since each descriptor is 32 bytes long, at most 3,200 bytes are required with a 4-bit quantization.
• Coordinates of shape landmarks identified through ASM
for at least 2 key frames. This is because shape landmarks will allow to compare face proportions in the verification phase. If 76-point ASM models are used, 76 landmarks per image are identified, which in cartesian coordinates yields 152 integers per frame. Because we need at least 2 key frames, this sums to at least 304 integers, i.e., 608 bytes for 2-byte integers.
• Depending on the application, at hand fields containing
personal data (e.g., name, place and date of birth). Note that just few bytes are needed for this.
7) Sign the biometric data: The objective of this step is to digitally sign the compact feature representation for security reasons. We use the Digital Signature Algorithm (DSA), since it introduces a low storage overhead (the signature is at most 48 bytes long) with respect to other solutions such as RSA (RSA-512, RSA-1024 and RSA-2048 generate, respectively, signatures that are 64, 128 and 256 bytes long). We can also use the Elliptic Curve Digital Signature Algorithm (ECDSA, using elliptic curve cryptography), whose signature’s length ranges between 28 and 132 bytes, depending on the elliptic curve used.
8) Generate a HCC2D code storing secure data: The objective of this step is to generate a HCC2D code storing the signed feature representation which is around 3,800-3,900 bytes long. Note that this amount of data can be embedded in a single square-inch with our extension of HCC2D codes.
B. Verification phase: identity verification
The object of the verification phase is to verify the identity of a given person. Given video frames of a scene, we aim at verifying the claimed identity of the person in the scene using only facial biometrics stored in the HCC2D code embedded in a paper document (e.g., a nominative ticket). Such a document is supposed to be presented by the person who claims to own the document. In other words, given a paper document and video frames which represent the person presenting the document, the objective of the verification step is to automat-ically accept or reject the claimed identity of the person. The process starts with the following inputs: several video frames of the person to verify and the HCC2D code storing secure features of the claimed identity. The verification phase can be summarized as follows.
1) Synthesize a compact feature representation: The objec-tive of this step is to generate a compact feature synthesis of the person to verify (structured as described in Section V-A6.) In order to accomplish this task, we proceed through steps 1 to 6 of the generation phase (see Section V-A).
2) Retrieve the original secure representation: The objec-tive of this step is to decode the HCC2D code which has been encoded in the generation phase (see Section V-A). This allows us to retrieve the secure facial biometrics which have been stored within the HCC2D code.
3) Compare the two facial representations: Finally, we compare the facial biometric data extracted from the identity to verify with the secure facial biometric data retrieved through the barcode reading. At the end of this step, the claimed identity of the person is accepted or rejected on the basis of the comparison, which is carried out considering both SURF descriptors and shape landmarks. The comparison works as follows.
a) Compare SURF descriptors: Given the two facial representations, compare the SURF descriptors of the identity to verify (extracted at verification time) with the secure SURF descriptors (extracted at generation time, retrieved through bar-code reading at verification time). The percentage of matching among descriptors is computed. The higher the percentage, the more likely the claimed identity is correct.
b) Compare facial proportions by means of shape land-marks: Given the two facial representations, retrieve the shape landmarks identified through ASM. Each representation in-cludes coordinates of shape landmarks identified through ASM for at least 2 key frames (see Section V-A6). Comparisons of facial proportions are carried out in the following way. Without loss of generality, assume that 76-point ASM models are used, and thus, 76 landmarks per frame have been identified.
Compute normalized distances among landmarks. For each set of landmarks (76 points), compute the distance from each landmark to all other landmarks. This yieldsdabsolute distances (2,850 distances for 76-point ASM models). Because absolute distances depend on the frame size and on zoom factors, normalize the distances by dividing them by a ref-erence distance (e.g., the inter-eye distance). Note that certain landmarks (e.g., eye landmarks) are more reliable and easier to find than others.
Compute distance ratios. Consider that we have at least two sets (76 points) of shape landmarks in the secure facial representation and at least two sets of landmarks in the facial representation related to the identity to verify. Now, compute distance ratios for each pair of sets of landmarks. For each pair of sets, d ratios (where d = 2,850 for 76-point ASM models) are computed by dividing each landmark distance in the first set (A) by the corresponding landmark distance in the second set (B). Ratioi
AB = distanceiA/distanceiB, where i
represents theithdistance (i= 1, ..., d) and(A, B)represents
a landmark set pair. Note that these ratios are discriminative for facial proportions; we expect that each ratio is approximately 1.0 if shape landmarks in sets A and B are related to the same person (i.e., we have to accept the claimed identity), while we
expect that ratios diverge from 1.0 if the persons are distinct (i.e., we have to reject the claimed identity).
Compute acceptance ranges for distance ratios.Now consider that because of noisy factors (such as changes of facial expres-sions), the above ratios will slightly deviate from the expected value even if the two sets of shape landmarks are related to the same person. For this reason, we compute “acceptance” ranges (to accept or reject a given ratio) in the following way. Note that for each landmark set pair (A, B), d ratios have been previously computed. In this step, consider only (authentic) (Aj, Al)pairs such that bothAj andAl(j6=l) are retrieved
from the secure feature synthesis in the HCC2D code. Because each of these pairs are ensured to belong to the authentic person, each ratio deviation from 1.0 of the ith distance
(∆Ratioi
AjAl =Ratio
i
AjAl−1.0, wherei= 1, ...d) defines an acceptance range for ratio deviations related to the identity to verify. Now we define ∆Ratioi = max{abs∆Ratioi
AjAl}), as the maximum amount (in absolute value) among all ratios related to theithlandmark distance. Finally, acceptance ranges
are defined asAcceptancei= 1.0±∆Ratioi.
Similarity of facial proportions. Finally, the similarity of facial proportions between the authentic person and the person to verify are evaluated. In this step, consider only landmark set pairs (A, V) such that A is retrieved from the HCC2D code (representing the authentic person) while V is extracted at verification time (representing the per-son identity to verify). The corresponding distance ratios
(ratio1
verif y, ..., ratiodverif y) were computed at step 3. In order
to evaluate if facial proportions extracted at verification time match the proportions of the authentic person, a similarity function is defined in the following.
similarity ratio1 verif y ... ratiod verif y = PN i=1f(ratio i verif y) /d, whered= 2,850for 76-point models and thef()function is defined as follows. f(ratioi verif y)= ( 1 ifratioi verif y ∈Acceptancei 0 otherwise
The higher the value of the above similarity function, the more likely the claimed identity is correct. Note that ifkvideo frames of the person are captured at verification time, the similarity function is appliedktimes, i.e., one per each video frame to process, i.e., one per each of theklandmark set pairs (A,V) obtained by holding the first element (A) constant and varying the second element (V). Consider that the key point is not the recognition on the single frame, but the recognition on the most of frames.
VI. EXPERIMENTATION
In this section we present experimental results concerning identity verification with our system. The accuracy of a recognition algorithm is generally measured in terms of two potential types of errors: false negatives (fn) and false positives (fp). False positives are cases where a claimed identity is ac-cepted, but should not be, while false negatives are cases where a claimed identity is not accepted, while it should be. Two
metrics building on true/false positives/negatives (tp,fp,tn,fn) are widely adopted: precision and recall. Recall (tp/(tp+f n)) is the probability that a valid identity is accepted by the system (i.e., true positive rate) while precision (tp/(tp+f p)) is the probability that a claimed identity which is accepted by the system is valid. F-measure (which is the harmonic mean of precision and recall) combines both metrics into a global measure (f measure= (2×prec×recall)/(prec+recall)). A threshold on the similarity score must be identified for determining whether two faces are similar (accept the identity) or significantly different (reject the identity). The higher the threshold, the higher the precision (i.e., the lower the risk of accepting invalid identities). However, a high threshold also decreases the recall of the system (i.e., the higher the risk to reject valid identities), because it increases the number of false negatives.
The performance of the proposed scheme has been assessed in terms of false positives, false negatives, precision, recall and f-measure on a standard dataset (the FEI face database [24]). 200 persons of the FEI face database have been considered through this study, where each person is represented by two frontal images (one with a neutral expression and the other with a smiling facial expression).
The experimental results in terms of precision, recall and f-measure (that vary according to the chosen thresholds) have been used for tuning the thresholds in order to get better per-formance. The remainder of this section illustrates our results, which are comparable with other works in the area, despite storage constraints due to 2D barcodes. In [25], precision and recall have been computed for a novel face recognition method building on eigenfaces; their precision and recall rates range around 90%-92%. In [26], precision and recall curves cross at 80% for face identification, while precision and recall rates are 97% and 75% for face detection in [27].
A. Tuning system parameters
Thresholds determine whether to accept or reject the claimed identity. In this section we tune system thresholds by analyzing the curves of precision, recall and f-measure. First, experimentation allows to determine the threshold on the ASM similarity score (which has been defined in Section V-B3b). Then, we find the threshold on the percentage of SURF descriptors that match between two faces.
1) Threshold related to shape landmarks (ASM): We have determinated a threshold on the similarity score defined in Section V-B3b (which is related to ratios of distances among two sets of shape landmarks). Table I shows the results as functions of threshold on the similarity score. Figure 7 plots the curves of precision, recall and f-measure for different threshold values, allowing to identify the threshold maximizing f-measure. A threshold is set at around 0.50 (claimed identities are accepted whenever the similarity score is above 50 percent, rejected otherwise).
2) Threshold related to SURF descriptors: Experimental results as functions of threshold on the percentage of matching descriptors are shown in Table II. Figure 8 plots the curves of
Threshold (ASM) Precision Recall F-measure 0.45 0.43 0.99 0.60 0.50 0.83 0.83 0.83 0.60 0.99 0.66 0.80 0.70 0.99 0.62 0.77 TABLE I
PERFORMANCE FOR VARIOUS THRESHOLDS(COL1)ONASMSIMILARITY SCORE IN TERMS OF PRECISION(COL2),RECALL(COL3)AND
F-MEASURE(COL4). 0.4 0.5 0.6 0.7 0.8 0.9 1 0.45 0.5 0.55 0.6 0.65 0.7 threshold Selected Threshold precision recall f-measure
Fig. 7. Precision, recall and f-measure as functions of threshold on ASM similarity score. (Viewed better in color).
precision, recall and f-measure for different threshold values, in order to find the threshold which maximizes the f-measure. We set the threshold at around 0.35 (claimed identities are accepted whenever the matching score of SURF descriptors is above 35 percent, rejected otherwise).
ACKNOWLEDGMENT
This work has been partially supported by the EU under Contract no. FP7-SME-2010-1-262448 - Project SIGNED (Secure Imprint GeNerated for papEr Documents).
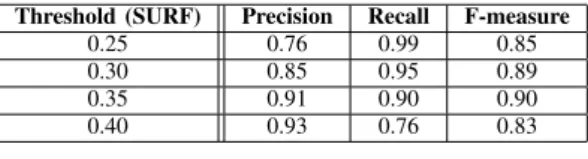
Threshold (SURF) Precision Recall F-measure
0.25 0.76 0.99 0.85
0.30 0.85 0.95 0.89
0.35 0.91 0.90 0.90
0.40 0.93 0.76 0.83
TABLE II
PERFORMANCE FOR VARIOUS THRESHOLDS(COL1)ONSURFMATCHING IN TERMS OF PRECISION(COL2),RECALL(COL3)AND F-MEASURE(COL
4). 0.75 0.8 0.85 0.9 0.95 1 0.24 0.26 0.28 0.3 0.32 0.34 0.36 0.38 0.4 threshold Selected Threshold precision recall f-measure
Fig. 8. Precision, recall and f-measure as functions of threshold on percentage of matching SURF descriptors. (Viewed better in color).
REFERENCES
[1] D. Hecht, “Printed embedded data graphical user interfaces,”Computer, vol. 34, no. 3, pp. 47–55, 2001.
[2] Microsoft Research, “High Capacity Color Barcodes,” http://research.microsoft.com/en-us/projects/hccb/, 2012.
[3] D. Parikh and G. Jancke, “Localization and segmentation of a 2D high capacity color barcode,” inProceedings of the 2008 IEEE Workshop on Applications of Computer Vision. IEEE Computer Society, 2008. [4] O. Bulan, V. Monga, and G. Sharma, “High capacity color barcodes
using dot orientation and color separability,” inProceedings of Media Forensics and Security, vol. 7254. SPIE, January 2009.
[5] A. Grillo, A. Lentini, M. Querini, and G. Italiano, “High capacity colored two dimensional codes,” inProceedings of the 2010 International Multi-conference on Computer Science and Information Technology (IMCSIT). IEEE, 2010, pp. 709–716.
[6] M. Querini, A. Grillo, A. Lentini, and G. Italiano, “2D color barcodes for mobile phones,” International Journal of Computer Science and Applications (IJCSA), vol. 8, no. 1, pp. 136–155, 2011.
[7] The German Federal Ministry of the Interior, “ePassport,” http://www.epass.de/, 2011.
[8] A. Noore, N. Tungala, and M. Houck, “Embedding biometric identifiers in 2d barcodes for improved security,”Computers & Security, vol. 23, no. 8, pp. 679–686, 2004.
[9] D. Kirovski, N. Jojic, and G. Jancke, “Tamper-resistant biometric ids,” in ISSE 2004: securing electronic business processes: highlights of the Information Security Solutions Europe 2004 conference. Vieweg Teubner Verlag, 2004, p. 160.
[10] M. Turk and A. Pentland, “Face recognition using eigenfaces,” in
IEEE Computer Society Conference on Computer Vision and Pattern Recognition, Proceedings CVPR’91. IEEE, 1991, pp. 586–591. [11] P. Belhumeur, J. Hespanha, and D. Kriegman, “Eigenfaces vs.
fisher-faces: Recognition using class specific linear projection,”IEEE Trans-actions on Pattern Analysis and Machine Intelligence, vol. 19, no. 7, pp. 711–720, 1997.
[12] B. Moore, M. Tappen, and H. Foroosh, “Learning face appearance under different lighting conditions,” in2nd IEEE International Conference on Biometrics: Theory, Applications and Systems. IEEE, 2008, pp. 1–8. [13] S. Aly, A. Sagheer, N. Tsuruta, and R. Taniguchi, “Face recognition
across illumination,”Artificial Life and Robotics, vol. 12, no. 1, 2008. [14] T. Cootes, G. Edwards, and C. Taylor, “Comparing active shape models
with active appearance models,” inBritish Machine Vision Conference, vol. 1, 1999, pp. 173–183.
[15] A. Lanitis, C. Taylor, and T. Cootes, “Automatic interpretation and coding of face images using flexible models,”IEEE Transactions on Pattern Analysis and Machine Intelligence, vol. 19, no. 7, 1997. [16] STASM, “Active Shape Models with Stasm,”
http://www.milbo.org/stasm-files/stasm-manual-13.pdf, 2012.
[17] M. Bicego, A. Lagorio, E. Grosso, and M. Tistarelli, “On the use of sift features for face authentication,” inConference on Computer Vision and Pattern Recognition Workshop, 2006. CVPRW’06. IEEE, 2006. [18] A. Majumdar and R. Ward, “Discriminative sift features for face
recogni-tion,” inCanadian Conference on Electrical and Computer Engineering, 2009. CCECE’09. IEEE, 2009, pp. 27–30.
[19] P. Dreuw, P. Steingrube, H. Hanselmann, and H. Ney, “Surf-face: Face recognition under viewpoint consistency constraints,” inBritish Machine Vision Conference, vol. 2, 2009, p. 7.
[20] G. Du, F. Su, and A. Cai, “Face recognition using surf features,” in
Proc. of SPIE Vol, vol. 7496, 2009, pp. 749 628–1.
[21] ISO 16022:2006,Data Matrix bar code symbology specification. [22] ISO 18004:2006,QR Code 2005 bar code symbology specification. [23] Y. Qu, T. Fang, Y. Cheng, and H. Liu, “Component localization in
face alignment,” inIEEE International Conference on Systems Man and Cybernetics (SMC), 2010. IEEE, 2010, pp. 3874–3880.
[24] FEI, “FEI Face Database,” http://fei.edu.br/ cet/facedatabase.html, 2012. [25] K. Sabrin, T. Zhang, S. Chen, M. Tawhid, M. Hasanuzzaman, M. Ali, and H. Ueno, “An intensity and size invariant real time face recognition approach,”Image Analysis and Recognition, pp. 502–511, 2009. [26] M. Everingham, J. Sivic, and A. Zisserman, “Hello! my name is... buffy–
automatic naming of characters in tv video,” 2006.
[27] M. Oskarsson and K. Astrom, “Maximum likelihood estimates for object detection using multiple detectors,” inProceedings of the 2006 joint IAPR international conference on Structural, Syntactic, and Statistical Pattern Recognition. Springer-Verlag, 2006, pp. 658–666.
![Fig. 2. Shape landmarks of a sample face identified through Active Shape Model. Figure taken from [16]](https://thumb-us.123doks.com/thumbv2/123dok_us/10075975.2907545/3.892.544.732.130.246/shape-landmarks-sample-identified-active-shape-model-figure.webp)