Field of study: Business Management
QUANTITATIVE MARKETING RESEARCH
Diploma work
Thesis superviser: Author:
Ing. Radoslav ŠKAPA, Ph.D. Ilya SHAIDEROV
Masaryk University
Faculty of Economics and Administration
Department of Corporate Economy Academic year 2010/2011
ASSIGNMENT OF DIPLOMA THESIS
For: Shaiderov Ilya
Field: Business Management
Title: Quantitative Marketing Research
P r i n c i p l e s o f t h e s i s w r i t i n g:
Objective of the thesis:
The objective of the thesis is to conduct an individual research project.
Approach and methods used: The author is expected to:
1. suggest a marketing-related research topic (e.g. consumer research),
2. to prepare a research design that utilizes the quantitative analytical methods,
3. to collect the data,
4. to analyze the data using statistical methods and
The extent of graphical works: according to the supervisor's guidelines, the assumption is about 10 charts and graphs
The thesis length without appendices: 60 – 70 pages List of specialist literature:
Cooper, Donald R. - Schindler, Pamela S. Business research methods. 8th ed. Boston: McGraw-Hill, 2003. xix, 857 s. ISBN 0-07-249870-6.
Smith, Scott M. - Albaum, Gerald S. Fundamentals of marketing research. Thousand Oaks: Sage, 2005. xii, 881 s. ISBN 0-7619-8852-1.
Malhotra, Naresh K. Marketing research: an applied orientation. 6th ed., Global edition. Boston: Pearson, 2010. 929 s. ISBN 9780136094234.
Hair, Joseph F. - Bush, Robert P. - Ortinau, David J. Marketing research: within a changing information environment. 3rd ed. Boston: McGraw-Hill, 2006. xxvii, 700. ISBN 0-07-283087-5.
Sekaran, Uma - Bougie, Johan Roger Gisbert. Research methods for business: a skill building approach. 5th ed. Chichester: Wiley, 2009. xx, 468 s. ISBN 9780470744796.
Diploma thesis supervisor: Ing. Radoslav Škapa, Ph.D.
Date of diploma thesis assignment: 20/3/2011
Submission deadline for Diploma thesis and its entry in the IS MU is provided in the valid Academic Calendar.
Department Head Dean
Abstract
The objective of this paper is to analyze the reasons for choosing Masaryk University among international students studying in English language; and identify the ways on how to improve Masaryk University overall attractiveness among this market segment based on best practice solutions in this sphere and obtained primary data. The trend of the work represents theoretical analysis of marketing research insights and their further application into practical part. Practical part consists of survey design and its implementation along with collected data analysis and future recommendations.
Exploratory research has been chosen as a research design in order to clarify relevant issues and uncover variables associated with a research goal. Primary data was collected through structured quantitative questionnaires which gathered 26 respondents. Data was coded and tabulated by Microsoft Excel spreadsheet application.
Results suggest that current and prospective students perceive two most important criteria for choosing Masaryk University: ―people‖ – which is competitive academic staff and employability after graduation. Two other criteria: ―processes‖ and ―physical evidence‖ were not in students‘ main concern, even though Masaryk University has above average scores of those two criteria. So it has been
recommended to improve previous two criteria (―people‖ and employability) along with promotion the other two (―processes‖ and ―physical evidence‖).
KEYWORDS: marketing research, higher education, quantitative research,marketing mix, viral marketing, website analytics, blogs, marketing
Declaration
I declare that this work has been completed by me independently under the direction of Ing. Radoslav Škapa, Ph.D. I have used no sources or aids other than those cited.
Brno, 26.04.2012
__________________________________
ACKNOWLEDGEMENTS
This work would not gain such academic and practical weight as it would not be under constant coordination of Ing. Radoslav Škapa, Ph.D.: his persistence and patience.
Choosing a topic and further theoretical and practical implications in this work were supported by my internal motivation to truly conduct all steps of marketing research. Topic ―Quantitative marketing research‖, proposed by Ing. Radoslav Škapa, Ph.D. was indeed something I was looking for. It encompasses two main steps in any research: theory and its implication which to my point of view prepares a good specialist for the professional career.
I am also grateful to all respondents who participated in my survey for their time and serious approach to this process.
Brno, in April 2012 Ilya Shaiderov
ACRONYMS
HE Higher education
Table of Contents
INTRODUCTION ... 1
LITERATURE REVIEW ... 3
1. THEORETICAL PART ... 5
1.1. Marketing versus Market research ... 5
1.2. Quantitative versus Qualitative Research ... 5
1.3. Marketing Research Process ... 6
1.4. The Research Plan ... 13
1.5. Measurement ... 13
1.6. Designing Questionnaires ... 14
1.7. Inaccuracy ... 15
1.8. Ambiguity ... 16
1.9. Hints to improve quality of questionnaire: ... 18
1.10.Sampling procedures in Marketing Research ... 20
1.11.Editing, Coding and Descriptive Analysis ... 23
1.12.Research Errors ... 24
2. PRACTICAL PART ... 25
2.1. Marketing Research Process Applied ... 25
2.2. Analysis and interpretation of data ... 28
2.3. Secondary data ... 28 2.4. Primary data ... 35 RESEARCH REPORT ... 45 CONCLUSION ... 49 REFERENCES ... 51 Appendix A: Questionnaire ... 54
INTRODUCTION
―The elements of globalization in higher education (HE) are widespread and
multifaceted and the HE market is now well established as a global phenomenon, especially in the major-English speaking nations: Canada, the US, Australia and the UK. In the context of increasing competition for home-based and overseas students, higher educational
institutions now recognize that they need to market themselves in a climate of international competition.‖ (Hemsley-Brown J.V. and Oplatka, I.,2006)
The main idea of this research is to analyze secondary information about HE marketing around the world to detect potential solutions to MU (Masaryk University) problem (attraction of international students). After this set of potential solutions will be developed, there will be next step – verification on the extent of those solutions match with real MU situation. To get this verification researcher should proceed to obtain primary data including questions that will prove or disprove world practices in HE marketing solutions. The final result of this procedure will be mix of proved MU problems which exist in world practices (solutions will be applied according to secondary data) and problems which inherent only in MU university (in this case researcher should propose potential solutions which will improve current situation).
In order to increase accuracy of primary data collection common research errors will be taken into consideration and verified according to proposed procedures. Errors are briefly mentioned in the practical part but the detailed explanation of some of them will take place only if one of those will arise during the research process.
Research goal of this study is to identify ways on how to increase students` inflow into MU by means of detecting general preferences of MU customers (prospective and current students). The motivation to reach this goal is coming from the secondary information gathered. Despite the fact that HE marketing is a new stream in marketing itself, there are many tools on how to increase students‘ enrollment. University potential to increase international students‘ inflow derives from university image, reputation, branding, mobile marketing, Google analytics and many more which is explained in secondary information part. Motivation to improve MU HE marketing activities comes from the point that current students have more possibilities to travel abroad. ―It has been estimated that more than 1.6
million students study outside of their home countries, with more than 547,000 studying in the United States‖. (Pimpa, 2003) So there is a huge potential for universities to attract international students through marketing campaigns.
In this work MU considers as an organization which has a goal to increase quantity of students enrolled from abroad. For this reason any company should understand its customer (needs, threats, and opportunities). Usually company has several categories of customers. ―Some buy because they find your price to be the lowest, some because they find your services to be outstanding, while some purchase from you because of your reputation in the industry‖. (Rodriguez, 2004) Even though there is set of categories of customers, the main feature always exists. So, this work is devoted to depict the ―main customer‖ for Masaryk University.
For this purpose quantitative marketing research is a tool to solve this. Different categories of customers give criteria to improve sales for a company. ―It is important that you know what customers consider most valuable about your products or services‖. (Rodriguez, 2004). That is why quantitative marketing research would bring up those values of the MU education for further improvement. Moreover it will display disadvantages of MU higher education which after all should be improved to make them as advantages.
Results of marketing research have several consequences. The first one, company gets closer to its customer and it can promote its products according to customer characteristics in social class, lifestyle, marital status and etc. The second one, company might redesign its product or service according to specific advices of customers. And last one is that a company can find one more target market which responds to company marketing mix. All these items allow marketing manager to crystallize its target market and give ways to increase sales. But the final destination for a company is to transform from market driven entity to market driving one.
An article published by Jarowski, Kohli and Sahay in 2000 year ―Market-Driven Versus Driving Markets‖ states that in general there are two main strategies to market
orientation: ―1) traditional market driven approach based on understanding and reacting to the preferences of customers and actions of players (customers, competitors) within a given market structure and 2) driving markets by influencing the structure of the market and/or the behavior of market players (customers, competitors) in a direction which would enhance the position of the focal business‖. (Kohli, Sahay 2000) They also argued that these two
approach to support its sales and generate profit and after shift to more market driving approach. In general it is difficult to state that market driving approach is the future for all companies which seek success for a long term. But there is certainty that if a company keeps track on current tendencies on the market it might propose some products which would be highly demanded in the shortest future. Vyas and Souchon (2003) argued that experience in specific markets might lead to intuitive understanding of customers` future needs or wants that would facilitate a market driving approach focused on said customers` unstated or unknown needs.
Once a company needs to know its customer, the only way to do it is to ask a customer. It can be done by means of primary or secondary researches which have several pros and cons. Also primary research has two options quantitative or qualitative marketing research.
LITERATURE REVIEW
The definition of education marketing was created by (Kotler and Fox, 1985) in the following form: ―The analysis, planning, implementation and control of carefully formulated programs designed to bring about voluntary exchanges of values with a target market to achieve organizational objectives.‖
The conception of a client in the tertiary education sphere was one of the main topics in 1990s. For example, (Conwey, 1994) highlights that there are two perspectives of
approaching a university client. In the first case, the clients are students who are offered study programs by universities. In the second notion, the clients are employers and companies to whom students present the product of the university.
Students remain as a main target group for universities and marketing communications directed to their needs and preferences. From this point applicability of traditional marketing research process takes place. Thorough description is given by (Smith and Albaum, 2005) who gave clear and simple path of stages in marketing research process.
In the problem formulation stage (Barabba, Zaltman, 1991) gave strong arguments for differentiating management problem from a research problem. They emphasize on the ability of researcher to translate management problem into research problem.
(Robert S Michael, 2002) gave the most profound characteristic of scientific method of inquiry which has been chosen for this study. Two stages of his proposed method of inquiry are not included due to different research design taken for this study – explorative.
(Cooper, Schindler, 2003) stated several compelling reasons for sampling. They mentioned two types of sampling, one of them has been incorporated into this work – probability sampling.
Measurement of variables in this work has been done according to (Hair, Bush, Ortinau, 2006) by assigning numbers and labels to multiple choice answers in questionnaire.
The matters of ambiguity and inaccuracy in research have been covered by (Smith, Albaum, 2005), (Hair, Bush, Ortinau, 2006) and (Sekaran, Bougie, 2009).
Research questions arose from two articles wrote by (Jonathan Ivy, 2008) and another one by (Hsuan-Fu Ho, Chia-Chi Hung, 2008). (Jonathan Ivy, 2008) argued in his article that there are three more elements in marketing mix when talking about service oriented business like university. Those elements were given names as ―People‖, ―Processes‖ and ―Physical evidence‖. (Hsuan-Fu Ho, Chia-Chi Hung, 2008) included another important factor for university promotion and it is the extent of employability after graduation from university.
(Dr. D.J. Toncich,2008) is talking about deviations in university slogans and real university standing. In his article there is also explanation of the ways on how to promote different parts of university image. Along with this (Nguyen and Le Blanc,2001) emphasize on market positioning. (Bonardi & Ekwulugo, 2003) claimed customer oriented approach that university should take into promotion and development educational process.
Partially (Harry Hayward, 2011) touched the matter of video clips as effective tool to promote university image. With support of (Bruce Snyder, 2011) web analytics became another effective tool of keeping track of different target markets and customer preferences tendencies.
(Jarvis J, 2008) emphasize on overall marketing politics which encompass existing blogs analysis, creation of internal and external blogs for sharing ideas, problems and thoughts among students and university staff. He also proposes to include useful links in company website.
1. THEORETICAL PART
1.1. Marketing versus Market research
It is essential to differentiate those two terms in order not to be mistaken in research process. In the article ―Market research versus marketing research‖ by Jacqueline Oud, market research provides more general information about the market. This research can answer such questions as: country specifications, market potential and accessibility, overall customer information (who, what, where, when and how). On the other hand, marketing research has more detailed and deep information about customers and their attitude toward company products. This research can be done through interviews, customers‘ feedbacks after product trials, follow-up of the consumer and its behavior. It means that marketing research can include market research but not vice versa.
Usually those two terms are used together because market and marketing research can interconnect during the process of identifying product positioning. So, this study is concentrated mainly on conduction marketing research. If from the survey it becomes obvious that some reasons of MU choice related to university environment (e.g. country specifications) it will be made partial market research using secondary data.
1.2. Quantitative versus Qualitative Research
The primary aim of a Qualitative Research is to provide a complete, detailed description of the research topic. Quantitative Research on the other hand focuses more in counting and classifying features and constructing statistical models and figures to explain what is observed.
The researcher serves as the primary data gathering instrument in Qualitative Research. Here, the researcher employs various data-gathering strategies, depending upon the thrust or approach of his research. Examples of data-gathering strategies used in Qualitative Research are individual in-depth interviews, structured and non-structured interviews, focus groups, narratives, content or documentary analysis, participant observation and archival research.
On the other hand, Quantitative Research makes use of tools such as questionnaires, surveys and other equipment to collect numerical or measurable data.
Qualitative Research is primarily subjective in approach as it seeks to understand human behavior and reasons that govern such behavior. Researchers have the tendency to become subjectively immersed in the subject matter in this type of research method.
In Quantitative Research, researchers tend to remain objectively separated from the subject matter. This is because Quantitative Research is objective in approach in the sense that it only seeks precise measurements and analysis of target concepts to answer his inquiry. (Experiment-Resources.com, 2009)
The question remains what method should be used after all. This study aims to find out the answer to an inquiry through numerical evidence, so quantitative research is applicable in this case. If in the future researcher would like to explain further why this particular event happened, or why this particular phenomenon is the case, then Qualitative Research comes into practice.
1.3. Marketing Research Process
According to Karole Friedmann (2003), Director of Products and Services for the marketing services company Market Research Project Management, Inc., marketing research project will be effective only if the information it provides leads to better business actions, decisions, products, or strategies. In general marketing research is correlated with decision support system when company executive decreases the risk of uncertainty by conducting research. Successful marketing research provides options for future actions in company strategy. High quality marketing research is proportional to high quality decision.
―Marketing research is the systematic and objective search for, and analysis of, information relevant to the identification and solution of any problem in the field of marketing. There are several important points in this definition. First, marketing research is a systematic search for, and analysis of, information. Careful planning throughout all stages of the research is a necessity. Researches must start with a clear and concise statement of the problem to be researched. Good research practice requires that the information sought, the methods used to collect the information, and the techniques employed to analyze the information be systematically and carefully laid out in advance‖. (Smith, Albaum, 2005) Also
objectivity of marketing research plays another important role in successful marketing research. This criterion allows omitting escalation of commitment and clearly reflecting current situation.
There are pitfalls during marketing research process. The most common ones are pseudo-research and advocacy surveys. Pseudo-pseudo-research is done simply to come up with desired results. There is no objective and ethical approach. Advocacy surveys are developed in such a way that serves the needed answer. Along with these two pitfalls the major one for doing successful research is escalation of commitment, when researcher is unable to consider other variants of research results. All these drawbacks might lead to waste of time and money spent for research.
Marketing research process consists of nine steps: Problem formulation
Method of inquiry Research method Research design
Selection of data collection techniques Sample design
Data collection
Analysis and interpretation of data Research report (Smith, Albaum, 2005)
Problem Formulation
―From the researcher`s point of view, problem formulation means translating the management problem into a research problem… An accurate problem formulation specifies the types of information needed to help in solving management problem… the quality of thinking about an issue (i.e., a problem situation) prior to data collection largely determines the quality of thinking (i.e., analysis and problem solving) after the data have been collected‖. (Barabba, Zaltman, 1991)
Problem itself contains several components:
1) The manager(s)/decision maker(s) and his, her, or their objectives 2) The environment or context of the problem
4) Alternative courses of action
5) A set of consequences that relate to courses of action and to the occurrence of events not under the control of the manager
6) A state of uncertainty as to which course of action is the best (Smith, Albaum, 2005)
Objectives have wide scope of variability starting from profit increase to service/product improvement. ―The fewer the objectives of any study the easier it is to keep track of progress toward the objectives… Objectives vary from jointly agreed-upon corporate objectives to the individual objectives of each employee‖ (Smith, Albaum, 2005)
Environment of the problem can be related to the market research because it encompasses such aspects as level of income and rate of growth in the market, degree of competition and government regulation. Upon that it might also consider consumer tastes and preferences. Environment has a wide set of factors, so researcher should define those factors which are relevant to the problem.
Method of Inquiry
The next stage in marketing research process is method of inquiry or method of investigation. The most objective and reliable is scientific method. This method is effective during the starting point and during the process of results check. The main and most profound characteristic of this method is objectivity. It consists of the steps listed below:
1. Observation and description of a phenomenon or a group of related phenomena. An investigator has little of prior information. This is the stage when qualitative methods may provide considerable information about what-is.
2. Formulation of a hypothesis to explain the phenomena. In educational research, the hypothesis is often a question about the relationship between or among variables that may influence learning. The hypothesis may be one that merely asks whether a relationship exists (correlation research), or the hypothesis may state a cause-and-effect relationship.
3. Predict the existence of other phenomena using the hypothesis, or predict the results of new observations.
4. Conduct experimental tests of the predictions by several independent experimenters who use proper experimental methods. (Robert S Michael, 2002)
Research Method
In addition to method of inquiry researcher should select research method. There are two types of research methods: experimental and nonexperimental. In former type of method researcher can intervene into research experiment and control external variables. It is vice versa in nonexperimental method. (Smith, Albaum, 2005)
Research Design
Another step in marketing research process is research design which is considered as specific methods and procedures to obtain information needed. Research design stipulates what information to collect, from what sources and using what procedures. The key marker of successful design is whether information collected relates to research problem along with objectivity and efficiency. There are three classes of designs – exploratory, descriptive, and causal. In exploratory design researcher identifies and formulates problem along with development of alternative courses of action. It is also considered as a first step in a broad study in order to get sufficient knowledge and narrow down the problem area. Sequence in exploratory studies lead to three steps:
Search of secondary information Interview experts in a given field Checking similar situations
Descriptive research design is more narrowed in contrast to exploratory one. In former specific research questions are postulated already. The research problem is familiar and specific. This research is preplanned and structured. Descriptive research covers such areas as product research, promotion research, distribution research and pricing research.
Causal studies help to predict causes of deriving such hypothesis. The key purpose here is to define relationships of causal factors to the effects of our prediction. Researcher might build a chart depicting several possible factors that brought situation to a current condition. If there is only one factor this would directly have influence on the situation. If there is more than one factors it is time to verify which one of those led to situation change. This approach is called casual relationship. If there is only one factor there might be applicable deterministic causation. Another type of causal studies in probabilistic causation which is expanded version of deterministic causation with more than one variable. (Smith, Albaum, 2005)
In marketing research, sources of information vary but serve as a tool to decrease uncertainty and check hypothesis. There are secondary sources, respondents, natural experiments,
controlled experiments and simulation. Secondary sources are taken from external organizations which conducted research with similar purposes. Usually it is statistical committees, government bodies, NGO`s and etc.. Respondents also serve as a source of informative and behavioral information. Experiment usage might also bring valuable information. Sometimes it is better (high expenses, time shortage) to implement simulation to a certain situation. Simulation is considered as a set of techniques for manipulating a model of some real world process to find numerical solutions useful in the real process being modeled. (Smith, Albaum, 2005)
Selection of data collection techniques
Information itself is divided into three categories: primary, secondary and commercial. Secondary information is gathered by passing actual research conduction. Primary information is coming from data collected by investigator and serve as a main answer to research question. Commercial data is collected by marketing agencies and contains primary and secondary information.
It is better to start collecting secondary information first because it is less expensive and it can offset the need of doing own research. Even though if it will not solve the problem, secondary information can clarify the problem in more detail and help to develop advices to research questions. Also help in planning the gathering of primary data and defining the population and selecting the sample.
Secondary Information
Secondary information has two types – internal and external. Internal information can be found within the company past researches and report whereas external is outside of the company. Using internal secondary information will shed light on: model and size of product by area, kind of account and industry; medium amount of sales by area, sales volume; percentage share of sales by product model; product size etc. External secondary information allows verifying overall size of market, characteristics of market, features of competitor products, prices, and promotion. (Smith, Albaum, 2005)
Primary Information
The major source of marketing research is primary data. In the process of gathering this data researcher deals with respondent. Respondent is a person who provides answers to the
questionnaire developed by researcher. Answers are not the only findings that can be collected in primary data collection. Respondents‘ behavior is another key aspect to observe and analyze future choice of consumer.
The main advantage of primary data collection is it‘s up to date information which respond researcher‘s main criteria – the extent of the obsolescence of collected data. That is why primary data gives more realistic view to the researcher. Another advantage is that primary information can be collected in varied ways from interview to email questionnaire. This gives researcher flexibility in choosing process. Cost and time spend to acquire this type of information varies. It can be attributed to the quantity of respondents should be asked, their accessibility in terms of location and etc. So, it is the researcher who decides whether to collect primary data or not based on availability of secondary data, time and budget of research.
The main disadvantage of primary data collection is incorrect questionnaire design (questions, answer options, place of survey and etc.). If doing so researcher may mislead himself in data analysis and come up to a wrong conclusion. Time might be another aspect to consider as disadvantage for collecting primary data. There is higher possibility to obtain statistical/market research from some agency already prepared, rather than spending time in collecting surveys, analyze them and synthesize to make final conclusion. The best option is of course to attain secondary information about the topic and then based on its outcomes collect primary information.
In this study will only be included quantitative techniques. Questions will be included to derive attitude to contemporary high education among students.
Sample Design
It is rare that in marketing research the whole population is analyzed. Sample is mainly a small representative group of people that reflects all potential consumers. Sample selection is derived from consideration of the relevant systematic and variable errors that might occur during the research process. (Smith, Albaum, 2005) ―There are several compelling reasons for sampling, including: (1) lower cost, (2) greater accuracy of results, (3) greater speed of data collection, and (4) availability of population elements. There are two types of sampling to choose: nonprobability and probability sampling. Probability sampling is based on the concept of random selection – a controlled procedure that assures that each population element is given a known nonzero chance of selection. In contrast, nonprobability sampling is
arbitrary and subjective. Each member does not have a known nonzero chance of being included. (Cooper, Schindler, 2003)
Analysis and Interpretation of Data Collected
The first step in processing of data is editing of complete schedules/questionnaires. Editing is a process of checking to detect and or correct errors and omissions. Editing is done at two stages: first at the fieldwork stage and second at office.
Field editing
During the stress of interviewing the interviewer cannot always record responses completely and legibly. Therefore after each interview is over, he should review the schedule to complete abbreviated responses, rewrite illegible responses and correct omissions.
Office editing
All completed schedules/questionnaires should be thoroughly checked in the office for Completeness, accuracy and uniformity
Coding
Coding means assigning numerals or other symbols to the categories or responses. For each question a coding scheme is designed on the basis of the con med categories. The coding schemes with their assigned symbols together with specific coding instructions may be assembled in a book. After the transcription of data is over, data are summarized and arranged in a compact form for further analysis. This process is called tabulation.
Tabulation
Thus, tabulation is the process of summarizing raw data and displaying them on compact statistical tables for further analysis. It involves counting of the number of cases falling into each of several categories.
Tabulation can be done by hand or by mechanical or electronic devices. The choice depends upon the size and type of study, cost considerations, time pressures and the availability of tabulating machines or computers. In this project tabulation and statistics will be done by using Microsoft excel spread sheet. (Debeka, 2003)
The Research Report
―Results of the research can be described in short or in long reports. Short reports are appropriate when the problem is well defined, is of limited scope, and has a simple and straightforward methodology. Short reports are about five pages. Long reports are of two
types. Technical report is written for an audience of researchers. And management report, written for the nontechnically oriented manager or client.‖ (Cooper, Schindler, 2003) This paper is considered to be a tool for a managing director (dean) of the university who might not have research background, so the results of the research will be represented as managerial report.
1.4. The Research Plan
Research plan is needed to organize everything in a way that each stage would clearly derive from the previous one. It is a tool to control and follow up all procedures of research project. It starts off with stating objectives (primary and secondary) then problem analysis (includes research problems, questions, hypotheses, interconnection between objectives and problem). Research design is next one. It has four subsets: (1) research methodology (how the research will be made); (2) research techniques (methods and procedures for data gathering); (3) sample design and selection (what is the size of sample, is there any subsamples, how you will make sure that it is representative sample. How the sample size was determined). The fourth stage of research plan is proposed analysis (tabulation procedures, cross-analysis tabulations and their reasons, type of statistical analysis). (Smith, Albaum, 2005)
1.5. Measurement
In marketing research measurement plays a key role. Accurate measurement of variables brings to right results and therefore to right management decisions. The main goal of accurate measurement is to characterize customers` attitude toward a product. ―Researchers use the measurement process by assigning either numbers or labels to (1) people`s thoughts, feelings, behaviors, and characteristics; (2) the features or attributes of objects; (3) the aspects of ideas; or (4) any type of phenomenon or event using specific rules to represent quantities and/or qualities of the factors being investigated. For example, to gather data that will offer insight about people who shop for automobiles online (a marketing phenomenon), researcher collects information on the demographic characteristics, attitudes, perceptions, past online purchase
behaviors, and other relevant factors associated with these people.‖ (Hair, Bush, Ortinau, 2006)
Two of the primary criteria of evaluation in any measurement or observation are: Whether we are measuring what we intend to measure.
Whether the same measurement process yields the same results.
These two concepts are validity and reliability. Reliability is concerned with questions of stability and consistency - does the same measurement tool yield stable and consistent results when repeated over time. Validity refers to the extent we are measuring what we hope to measure (and what we think we are measuring). To apply these concepts to social research, we want to use measurement tools that are both reliable and valid. We want questions that yield consistent responses when asked multiple times - this is reliability. Similarly, we want questions that get accurate responses from respondents - this is validity. (Smith, Albaum, 2005)
1.6. Designing Questionnaires
After determining established set of scale measurements it is the time to format them into an instrument for collecting raw data from respondents. The purpose of designing reliable questionnaire is to collect high quality primary data which can be easily transformed into the information for the manager. The main principle in developing questionnaire is its logic, objective and consistent approach rather than creative way of questions development. Everyone understands that words go into questions and that questions go into questionnaires, but not everyone understands that writing questions does not give you a questionnaire. (Hair, Bush, Ortinau, 2006)
During the procedure of formulating and asking questions response/ nonresponse errors occur. Nonresponse errors can occur due to the length of questionnaire or questions, their complexity or inclusion of personal questions. To avoid such type of error it is necessary to use innovative way of questions formulation by keeping them concise and in the same time sufficient enough. The next step is to shuffle up the formats of questions to keep interest of respondent to answer. Keeping respondent well informed about directions of each part of questionnaire is also important. Researcher should put emphasis on style and format of questionnaire (font, color of paper, graphic attributes etc.). The final aspect is numbering the questions to help keep track for both researcher and respondent.
Response error rise when the actual value of variable contradicts with one in the report. This error can rise from both sides: researcher or respondent. Respondent is considered as a person who provides information through communication (interviews, questionnaire) or observation (researcher observe behavior of respondent). Response error though can occur during one or both of those processes. To verify reasons of errors researcher should analyze steps in delivering information. The first one is information formulation and the second is information transfer. Inaccuracy happens during formulation step and ambiguity during information transfer to respondent. (Smith, Albaum, 2005)
1.7. Inaccuracy
Inaccuracy as a cause of questionnaire design means that false report is obtained from the attitudes, preferences, beliefs, feelings of respondent. Questions and scales must be used that enable to get the whole picture of respondent perception on the matter rather than to get a fragment of his perception. Accuracy itself refers to the degree to which the data provide the researcher with a description of the true state of affairs. From this point ―questionnaire design precision‖ rise up which is the extent to which a questionnaire design can reproduce similar results over repeated usages. (Hair, Bush, Ortinau, 2006)
There are two types of inaccuracies: predictive and concurrent. Former one is caused by inaccurate intentions of researcher during problem formulation. Concurrent inaccuracy happens when respondent intentionally provides inaccurate information.
Inability to respond and unwillingness to respond are the most common concurrent inaccuracies. Inability to respond happens when question is posed the way it is hard to answer without certain actions of respondent (check, look up some features of product in question). These problems might occur if respondent does not remember product features; questionnaire is unrealistic, badly designed or directed to improper person. Also if construction of questions is developed with misuse of words or general terms.
―Unwillingness to respond‖ deals with motivation of respondent. Respondent will not provide accurate or any information due to several costs. One of them is time costs which require respondent to spend time for questionnaire completion. So, if respondent is busy or questionnaire is too long she would answer the questions as quick as she can without paying attention to accuracy. For this reason questionnaire section will contain this phrase: ―Do you
have time now to answer questions, or would you rather set a time when I could contact you again?‖
Second problem is perceived loss of prestige. Some questions might influence prestige of respondent and then he tends to answer in a way not to lose his prestige which leads to inaccurate answer. Examples of areas which involve prestige level is age, income, educational level and job position. The main key to solution of this problem is to ask for information twice in different ways.
Third area of questions that might bring to unwillingness to respond is invasion of privacy. If questions touch private information about respondent inaccuracy and nonresponse take place. Such area includes questions about family matters, income and money attitude, finance, respondent hygiene, political views, religion and etc. In this case indirect questions can help or in case of direct questions still have to placed they should be included in the end of questionnaire. (Smith, Albaum, 2005)
1.8. Ambiguity
Ambiguity is considered as errors in constructing written and oral words or behavior. Inaccuracy errors occur during the formulation of information whereas ambiguity errors happen during transfer of information through communication or observation. Unambiguous situation is the one where researcher asks question and respondent answer based on the same meaning of words. In this case two phase process takes place. When question interpreted by respondent has the same meaning as it is in interpretation of researcher. And answer by respondent is understood the same way as by researcher. (Smith, Albaum, 2005)
―The language of the questionnaire should approximate the level of understanding of the respondents. The choice of words will depend on their educational level, the usage of terms and idioms in the culture, and the frames of reference of the respondents. If some questions are either not understood or are interpreted differently by the respondent, the researcher will obtain the wrong answers to the questions, and responses will thus be biased. Hence, the questions asked, the language used, and the wording should be appropriate to tap respondents` attitudes, perceptions, and feelings.‖ (Sekaran, Bougie, 2009)
Also implicature is an issue related to ambiguity when researcher is using elliptical sentences (starting with ―Why‖, ―What‖, ―How‖) and respondent fill in the missing content
by herself. In standardized interviews respondent should interpret questions as he can which leads to miscommunication and wrong results. So, conversational interviewing is when researcher is trying to explain the meaning of question and not influence the answer. (Smith, Albaum, 2005) Interview refers to qualitative method to obtain data; this study has quantitative research, so it becomes crucial to construct clear and concise questions. For this purpose there will be pretest of questionnaire research by giving out it to my friends and get feedback. Another way to track understanding level of respondent is to set sub questions in questions which contain highest probability to mislead respondent. By simply asking the level of question comprehension (good or fair) researcher can identify the level of ambiguity in answers and track those answers which are answered with ―good‖ level of understanding. Question form and question wording has certain relationship to ambiguity.
There are four question/answer types: 1. Free answer (open-ended text)
2. Dichotomous and multiple choice answers (select k of n) 3. Rank order answers
4. Constant sum answers
1. Free answer questions imply that respondent will give full answer to the question in his own words. This type of questions require respondent to have ability to express completely and concisely. That is why free answers have great extent of ambiguity during interpretation process.
2. Dichotomous and multiple choice answers are the most common in questionnaires development. General form for both of these answer types is selection of ―k‖ optional answers out of ―n‖ available. ―Select exactly 1 of n Answers‖ is one of such type of answers. This is simple form where k=1 and n is up to researcher desire. In dichotomous question options (n values) range into two extremes (―Yes‖/ ―No‖, ―In favor‖/ ―Not in favor‖, ―Buy/Do not buy‖, etc). Multiple choice answers are just an extension of dichotomous questions. Multiple choice questions may require selection of several ―k‖ out of ―n‖ possible answers, or selection unlimited amount of ―k‖ answers out of given ―n‖ options.
3. Rank order answers allow to put gradation to answer options. This type of answers characterizes data on the most prevailing option and the one which has the least importance to
respondent. Typical questions can include determining ranking of preferences, first to last, most current to least current and etc. The most common bias here is that first optional answer in the question has more chances to be selected. Also tied rankings may cause another problem of data weakening. When it is allowed to rank several answer options into one ranking level it is impossible to determine results out of this answer. For the efficiency purposes maximum of answer options given in rank order questions vary from five to seven. If it is more than seven it is hard for respondent to identify clearly the right ranking order.
4. Constant sum question is the form of ranking using allocation of one hundred percent to the options containing reasons for the statement asked. It can be options for the reasons of company product purchase. (Smith, Albaum, 2005)
Also to create a good questionnaire researcher should include ―positively and negatively worded questions.‖ Instead of developing all questions positively it is better to mix them with negatively worded questions to reduce the probability of mechanical filling the questionnaire by respondent. ―A respondent who is not particularly interested in completing the questionnaire is more likely to stay involved and remain alert while answering the questions when positively and negatively worded questions are interspersed in it. For instance, if the respondent has circled 5 for a positively worded question such as, ―I feel I have been able to accomplish a number of different things in my job‖, he cannot circle number 5 again to the negatively worded question, ―I do not feel I am very effective in my job‖ … The use of double negatives and excessive use of the words ―not‖ and ―onl should be avoided in negatively worded questions because they tend to confuse respondents.‖ (Sekaran, Bougie, 2009)
1.9. Hints to improve quality of questionnaire: A. Neutrality and don`t know or no opinion
It is an option given to respondent to remain neutral to the question provided. Once third option is included researcher does not force respondent to answer and it makes questionnaire more polite to respondent. Based on the nature of the question researcher may include such options like ―don`t know‖, ―no opinion‖, or ―not applicable‖. ―Don`t know‖ might be attributed to question dealing with some facts whereas ―no opinion‖ can be attributed to a
certain attitude of respondent. If such type of option will be included it is important to increase sample size because of increased probability for respondent to choose neutral answer.
B. Dichotomous questions
It is the easiest type of questions for respondents. It is considered as a question with average probability for being ambiguous. But it has the lowest probability of being ambiguous among free-answer questions and multiple-choice questions.
C. Multiple choice questions
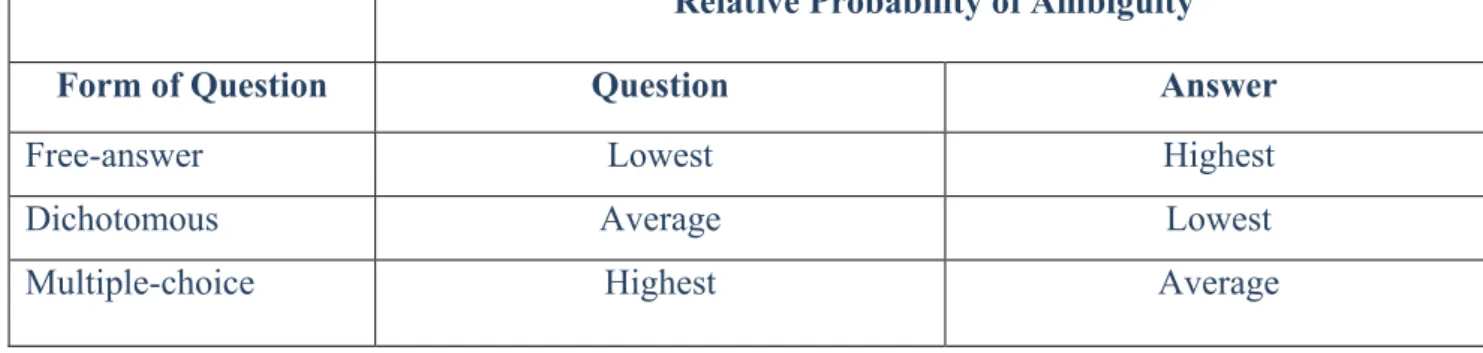
The researcher has two options if she wants more detailed information in a certain question. It is to create multiple choice question or free-answer question. Usually multiple choice questions are more complex and longer than the other two (dichotomous and free-answer). Ambiguity in such type of questions derives from inability to formulate mutually exclusive alternatives. Another reason for ambiguity is limitation of the chosen answer. Respondent should select only one option which most widely answers the question. For this reason researcher may offer to select as many options as respondent wishes. There is a table below which shows relative probability of ambiguity related to form of question.
Table 1 ―Form of Question and Relative Probability of Ambiguity‖ (Smith, Albaum, 2005)
D. Question wording
Selection of right words plays important role in questions development. So, in wording choose researcher should be extremely careful. Ambiguity in wording has several sources:
Question length
Respondent unfamiliarity with some words
Relative Probability of Ambiguity
Form of Question Question Answer
Free-answer Lowest Highest
Dichotomous Average Lowest
Ambiguity of context
Two questions included in one sentence Too broad questions
If questions are too long this will confuse respondent and affect data accuracy. For this reason researcher should keep questions concise and clear. If some words in question are unfamiliar to the respondent this will also lead to confusion and inability to provide right information. So, in case of scientific wording in questionnaire and non-homogeneous backgrounds of respondents low level of vocabulary should be used. Also researcher should verify whether questions imply only one matter in order not to mislead respondent. Questions that lack specificity should also be avoided. Those questions are developed with general words like ―how often‖ for example.
In general researcher must provide alternative question wording, pretesting and verification by observation. In alternative question wording first have of sample group may get options in one order and the second one in reverse order. Once questionnaire is ready pretesting is another good way to decrease ambiguity. Only one concern here is to choose relatively the same group of respondents as it will be in the real research. By close communication with respondent in pretesting step researcher can determine some troubles, misunderstandings arose during this step. And last advice is verification by observation. Researcher can (where it is possible) verify answers of respondents by observing their actions related to questions answered. It is not the easy activity, so only those questions will be verified where it is possible to do so. (Oppenheim, 1992)
1.10. Sampling procedures in Marketing Research
―Sampling is a selection of small number elements from a larger defined target group of elements and expecting that the information gathered from the small group will allow judgments to be made about the larger group. The main idea of sampling is that a decision is based on the assumption that the smaller portion, or sample, is representative of the larger population.‖ (Hair, Bush, Ortinau, 2006)
Chart 1 ―Defining Sample‖
Sampling procedure starts with defining of population. Population is amount of units (individuals, legal entities, households) which has one or more similar feature among each other. In order to specify population researcher should answer such questions as what kind of units (elements of analysis) to be included, where they reside or their origin and when (dimension of units in terms of timeframe). Population should be defined as precisely as possible. At the moment of finalizing population definition investigator decides whether it is necessary to investigate the whole amount of population (census) or a part of it (sample). The choice depends on the size of population. If the size of population is small census can be an optimal option otherwise should be created sample.
Sample design includes type of sample, sampling unit and sample frame. Majority of samples are selected by choice of investigator as non-probabilistic method. Where investigator selects elements of sample in terms of convenience, availability and own judgment. Researcher uses table or any other random selective device for the probable method. (Smith, Albaum, 2005)
Define population
Sample design
Sample size
Estimate costs of sampling Census vs. Sample
―Sampling unit is the basis of the actual sampling procedure. It is that segment of the population actually chosen by the sampling process. The sampling unit may contain one or more population elements. That is, these units may be individual elements or aggregates of individual elements.‖ (Smith, Albaum, 2005)
Sample frame is considered as a list of elements of the population. For instance it can be list of characteristics of elements which are expected to pass the interview or fill out questionnaire. In a perfect case sample frame should determine each population element once and should not include those elements which are not in the population criteria. There several options below of inaccurate sample framing process.
Chart 2 ―Sample Framing Processes‖
A. Incomplete Sampling frame B. Too Comprehensive C. Combination Sampling frame Population Sampling frame Population Population
There is also set of questions to ask during generation of sampling list:
Does the list contain everyone in the survey population?
Does the list include names of people who are not in the study population? How is the list maintained and updated?
Are the same sample units included on the list more than once?
Does the list contain other information that can be used to improve the survey? (Dillman, 2000)
There are four traditional approaches for the determining sample size: 1. Arbitrarily or judgmentally determined
2. Minimum cell size in analysis 3. Based on budget
There are two types of costs in sampling process: fixed and variable. Fixed costs are those which are determined and constant. Variable costs depend on the volume of study being conducted. The dashed line in the upper graph shows interrelation between costs and sample design. If costs are too high researcher reconsiders sample design or sample size.
The last step is actual choice of sample. There are two main criteria for this process: sample must be adequate and representative. For the sample being representative means that it reflects overall characteristics of the whole population. Adequacy is sought in sufficient amount of elements selected to provide stable results. Also there are two types of sampling designs: probability and non-probability samples. Non-probability sampling differs from probability sampling on the basis that in non-probability sampling, the sample elements do not have a known, nonzero chance of being selected for the sample. In probability sampling each element has a known and equal probability of selection. This study incorporates probability design because there are no any predisposed respondents. (Smith, Albaum, 2005)
1.11. Editing, Coding and Descriptive Analysis
―Completed questionnaires or other measurement instruments must be edited, coded, entered into a data set for processing by computer, and carefully analyzed before their complete meanings and implications can be understood.‖ (Smith, Albaum, 2005)
The main reason for this process is converting data obtained into information which will provide inferences and answers to research question. A certain sequence is needed to perform successful data analysis. In short, there should be definition of response categories at first, then editing and coding and at last tabulation. All these three steps will be implemented in the practical part.
1.12. Research Errors
In any research errors will occur, so management of errors must apply. Errors can arise in any stage of marketing process from problem formulation to report development. It is a goal of investigator to minimize those errors. The value of total error is comprised of sampling error plus non-sampling error. Sampling error (usually called as random sampling error) is the difference between planned sample and the list of interviewees it is formed. Non-sampling errors are those which are not related to the sample itself. Usually non-sampling errors related to sort of bias as the difference between the true value of that which is being measured and the average value derived from a number of independent measurements of it. There are eight major types of errors:
Population specification – difference between required population and population chosen. When researcher chooses inappropriate population for the data collection. Sampling difference between required sample and the one that has been selected. When sample does not represent the population selected by using probability sampling method.
Selection error usually occurs when researcher pick up respondents whom she knows, who is more pleasant, in general who is easily reached. This tendency deviates real population selected.
Frame error. Sample frame is a set of representatives of population who relate to required sample. The frame error occurs when elements which are not in the sample group are investigated.
Nonresponse error occurs when all members of the sample cannot be reached or they refuse to respond.
Surrogate information error occurs when investigator is unable to obtain responses and replace it with proxy answers leading to surrogate information.
Measurement error occurs in several stages of research: transmittal, response, analysis. In general, researcher represents information that he wants rather the real one.
Experimental error. When investigator is measuring the influence of independent variables on dependent one while controlling extraneous variables. (Smith, Albaum, 2005)
2.
PRACTICAL PART
2.1. Marketing Research Process Applied
For this study it has been identified that the problem of current situation in MU is its inability to attract more international students.
Problem Formulation: Prospective students do not choose MU for degree obtainment. Research goal: To identify ways on how to increase students‘ inflow into MU by means of detecting general preferences of MU customers (prospective students and current students). Research questions:
Based on the study of 7P approach, made by Jonathan Ivy, one research question arises.
1. On what element of marketing mix students relied more when choosing MU: ―People‖, ―Physical evidence‖ or ―Processes‖?
From another study made by Hsuan-Fu Ho and Chia-Chi Hung second research question arises:
2. Does the possibility of domestic market employability after graduation plays the key role for choosing MU?
Method of Inquiry
As been mentioned in the theoretical part the first step in method of inquiry is observation and description of a phenomenon or a group of related phenomena. This step is known for its qualitative methods of applicability.
Have been studying for almost two years in MU and communicating with dozens of international students I found several aspects to consider for MU attractiveness improvement. Students who stay longer than a semester differ from those who came just for one semester under Erasmus exchange program. This research deals with the first category of students and for them it is important to have more frequent university-student correspondence. Keeping the fact that education process in Masaryk university different and complicated in terms of Information Technology (student information system is very confusing with no English version of some pages) there should be prepared an orientation seminars on how to effectively use all university premises and surrounding city facilities. It can be easily done with the help of International Students Club which has excellent image among such clubs in Europe. There is orientation week for students but from the students point of view is more prepared to make things done (like ISIC card issue, register to information system) rather than providing students with tools on how to achieve what they need to. This can easily be done by information system additional applications of city, university map, student forums, and discussion groups. The information system should be done in more client friendly way with good English translation of the web pages.
This work would not include any hypothesis because of the chosen research design – explorative.
Research Methodology
In this will be applied nonexperimental method because of objectivity purposes. There is high risk of mislead and misinterpretation to the respondent which will affect the survey results.
Question number 1, 2, 3 in the survey (can be found in appendix of this work) was included for the reason to find additional information from prospective students who intend to continue their study. Question number 11 gives idea on the effective media channel that students got information from. Question number 12 and 13 will help to summarize general student opinion on MU and find some deviations from the rest of the questions.
Below are the questions in the survey which relate to research question number 1: ―On what element of marketing mix students relied more when choosing MU: ―People‖, ―Physical evidence‖ or ―Processes‖?
Question number 4, 6 ,7 was adopted from literature source (Jonathan Ivy, 2008) of theoretical part. This question identifies the level of ―Processes‖ element of marketing mix. Question number 5 based on the same literature source was adopted to verify another element of marketing mix – ―People‖. Question #8 uncovers the level of third element ―Physical evidence‖. Question number 10 encompasses all three elements to double check the main criteria that students choose or consider MU to study.
Below are questions in the survey which relate to research question number 2: ―Does the possibility of domestic market employability after graduation plays the key role for choosing MU?‖
Questions number 14 and 15 will help to identify the level of students‘ motivation to enter MU for the reason of higher chance of employability after graduation. These questions were adopted from literature source provided by Hsuan-Fu Ho and Chia-Chi Hung.
Question number 9 relates to both research questions because it covers the scale of significant factors that might affect student to choose MU.
Research Design
The study entitled ―Quantitative Marketing Research‖ attempts to accumulate the sequence of procedures to conduct successful marketing research. It has been chosen to use quantitative research for the reason that study aims to find out the answer of a research questions through numerical evidence. This method enables researcher to gather existing information and data regarding interrelationship between low rate of students registration to MU. The study will help to answer on two research questions posed in this work.
Selection of data collection techniques
The study incorporates two techniques of data collection: secondary and primary collection. Secondary information reveals current situation of HE marketing worldwide and primary information helps to find the match up for solution of MU problem and secondary information findings.
Sample design
Researcher uses probability sample design with quantity of respondents equal to 26.
Data collection
For study purposes data will be collected by giving out questionnaires to current and prospective students who study or intend to study in English in MU. Hard copy questionnaires will be collected after respondents finish answering them. Total collected questionnaires amount to 26.
Research errors
Population Specification error is mastered by questioning potential respondent whether she/he studies in English. Sampling difference researcher will overcome by keeping the highest level of variety of respondents (by country of origin). Selection error is out of the matter because researcher is not introduced to the majority of students studying in English. Nonresponse error may occur, for the further purposes of the research respondents would be asked the reasons for rejecting to fill out questionnaire. The same procedure is for the surrogate information – if researcher will not be able to get answers from respondents they will be asked about the reason of rejection.
2.2. Analysis and interpretation of data
Secondary and Primary data is analyzed and interpreted in section 2.3 and 2.4 below.
2.3. Secondary data
Marketing communication of universities
As has been mentioned previously in this work the best option to collect relevant primary data is to rely first on secondary information and then delve down in certain aspects by collecting primary information. In this item it will be explained what has been done in marketing communication of universities around the world. This part will also cover the question of what communication strategies and tools the international universities use to attract their students.
From the first finding to start, universities all over the world practicing advertising campaigns with such words as: ―Internationally renowned, Award winning, Prestigious, Proud history, Career oriented, etc. But not all the time these sparkling words are real truth. ―Does it actually matter whether a university has ―tradition‖ if its current practice is poor? Does it matter if a university is ―internationally renowned‖ if the particular course that is being considered is known to be badly operated by local standards? Does it really matter if a university has ―a proud history‖ if the present isn‘t very good?‖ (Dr. D.J. Toncich,2008)
Australian professor Dr. D.J. Toncich in 2008 published a book ―Study and Learning in the Australian University System‖ where he clearly stated various forms of
Marketing in universities of Australia. ―The most common example of universities selling the sizzle rather than the sausage appears in areas such as science, engineering and architecture, where potential students are bombarded with glamorous images of spacecraft, sky-scraper buildings; nuclear reactors, and so on‖ There are different ways how universities attract their students. There is a table provided by Dr. D.J. Toncich which explains the ways on how to promote different parts of university image.