University of Tennessee, Knoxville
Trace: Tennessee Research and Creative
Exchange
Chemical and Biomolecular EngineeringPublications and Other Works Chemical and Biomolecular Engineering
Spring 5-6-2013
The Sustainability of Coffee Brewing
Richard F Simmermanrsimmerm@utk.edu
Follow this and additional works at:http://trace.tennessee.edu/utk_chembiopubs
Part of theBiochemistry Commons
This Article is brought to you for free and open access by the Chemical and Biomolecular Engineering at Trace: Tennessee Research and Creative Exchange. It has been accepted for inclusion in Chemical and Biomolecular Engineering Publications and Other Works by an authorized administrator of Trace: Tennessee Research and Creative Exchange. For more information, please contacttrace@utk.edu.
Recommended Citation
Simmerman, Richard F. (2013). The Sustainability of Coffee Brewing. Chemical and Biomolecular Engineering Publications and Other Works. http://trace.tennessee.edu/utk_chembiopubs/97
The Sustainability of Coffee Brewing
Introduction:
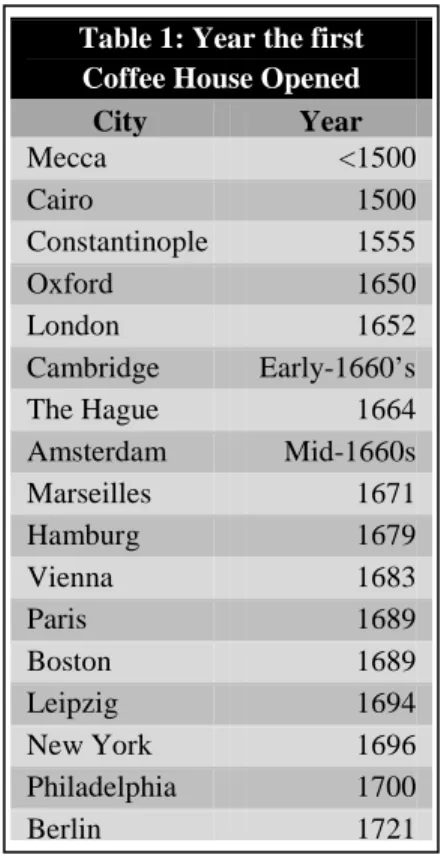
Whether the first cup of coffee was enjoyed in the 9th -century by Kaldi the goatherd as he was watching over his dancing goats in Ethiopia, or in the 11th-century by saint Omar in Ousab, Arabia (Weinberg and Bealer, 2001), over 2.25 billion cups are consumed daily all around the world (Ponte, 2002). These romantic coffee origin stories aside, there is evidence documenting the coffee plant and consumption of coffee, via roasting and brewing, from the mid-15th-century by Sufi ascetics in their monasteries in Yemen (Weinberg and Bealer, 2001). Coffee cultivation was exclusive to the Middle East until Baba Budan, another Sufi ascetic, smuggled unroasted coffee seeds from Mocha, Yemen to Mysore, Karnataka, India in 1670 (Wild, 2005). Coffee was initially introduced to Europe via Italy and later by both the Dutch and British East India Companies, which imported copious amounts of coffee (Ukers, 1976). Table 1 shows when the first coffeehouses were opened in different cities across the world (Weinberg and Bealer, 2001). The popularity of coffee grew in America during the Revolutionary
War and the War of 1812, during which the supply of tea available from the British was greatly reduced (Pendergrast, 2010). These wars, along with the Civil War, led to an enormous increase in the US demand for coffee. Industrialized countries account for most of the current high demand for coffee mentioned above, while more than 90% of coffee cultivation occurs in developing ones (2009). Figure 1 shows the percentage of coffee production that the top 10 producing countries make of the world total every year (2009). It is interesting that the top 10 countries produce nearly 84% of the world-wide coffee supply, and that Brazil alone cultivates more than one-third of the world’s coffee.
In short, over 8.25 million tons of coffee are produced world-wide annually (2009). Remarkably, only two different species of
coffee are cultivated to reach almost the entire crop, Coffea canephora (robusta) and
C. arabica (arabica). Arabica coffee is a tetraploid, that takes 9 months to ripen, yields 1500-3000 kg beans/ha, has an optimum temperature 15-24°C, an optimal rainfall need of 1500-2000 mm, an optimum altitude 1000-2000 m, is much more susceptible to disease and parasites, with a caffeine content per bean of 0.8-1.4%. Robusta coffee is a diploid, that takes 11 months to ripen, yields
Fig 1. Percentage of world-wide coffee production.
The amount of world-wide total from the top 10 coffee-producing countries from 2009-2010 is represented here.
Table 1: Year the first Coffee House Opened
City Year Mecca <1500 Cairo 1500 Constantinople 1555 Oxford 1650 London 1652 Cambridge Early-1660’s The Hague 1664 Amsterdam Mid-1660s Marseilles 1671 Hamburg 1679 Vienna 1683 Paris 1689 Boston 1689 Leipzig 1694 New York 1696 Philadelphia 1700 Berlin 1721
2300-4000 kg beans/ha, has an optimum temperature 24-30°C, an optimal rainfall need of 2000-3000 mm, an optimum altitude 0-700 m, is resistant to many diseases and parasites, with a caffeine content per bean of 1.7-4.0% (http://www.ico.org/botanical.asp).
After the coffee seeds have been harvested, the next step they undergo is processing to remove the fruit surrounding the bean. Coffee beans are processed using one of three different techniques: dry processing, wet processing, or semi-dry processing. Dry processing is the most ancient and least energy intensive processing technique. The entire fruit is spread thinly and allowed to air dry in the sun while being mixed occasionally to ensure uniform temperature (Davids, 2001). The dried fruit is later removed, usually via machine, and the product is known as natural or unwashed coffee. On the other hand the fruit surrounding the coffee bean is removed before drying in wet processing. The fruit is removed either using bacteria and enzymes in a process referred to as fermentation or it is scrubbed from the bean in mechanical wet processing (Davids, 2001). Fermentation uses large quantities of water in the fermentation as well as to wash the enzymes and bacteria from the beans, while mechanical wet processing uses less water, but has been implicated in influencing the taste of the coffee. The semi-dry method is employed in Brazil and parts of Africa, and removes the outer skin while leaving the fruit to dry and be removed mechanically afterward (Davids, 2001). For the most part the coffee beans are ready to be processed, although some beans will undergo decaffeination. The processes that allow for the removal of caffeine are very energy or water intensive (Ramalakshmi and Raghavan, 1999), although a natural coffee subspecies has been discovered with very low caffeine (Silvarolla et al., 2004).
Regardless of the technique used to process the coffee beans, the end result is referred to as green coffee beans, and the next step for these beans is roasting. During the process of roasting the beans are held at elevated temperatures for various sets of time. Generally the longer and hotter the roast the darker and more oily the beans become (Raemy and Lambelet, 1982), and they retain less of their original flavor and caffeine (Verlengia et al., 1965). The next step is to grind the beans into
different sizes which can be optimized for different brewing methods. The coffee grounds are then ready for brewing. Different processes of brewing will be evaluated, and their environmental, social, and economic impacts will be compared
and contrasted in this sustainability analysis.
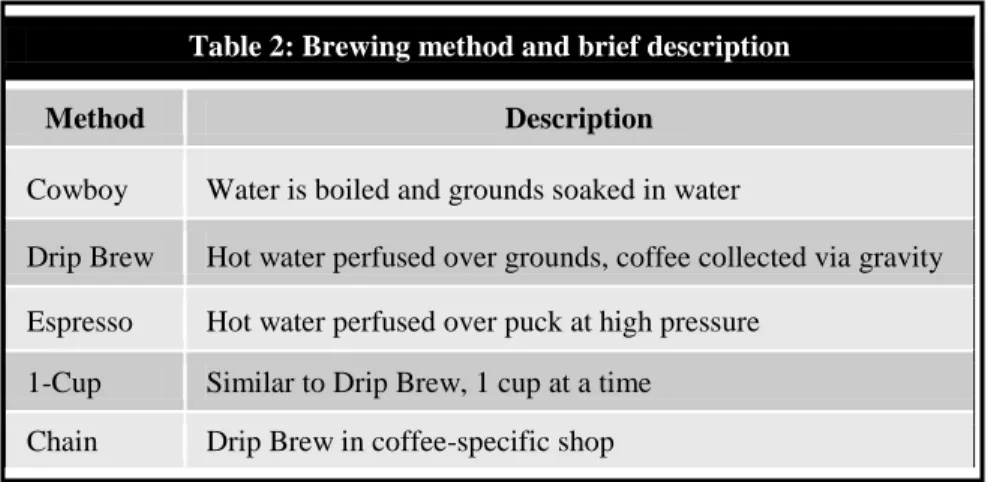
The different brewing processes analyzed are summarized in Table 2 and include: cowboy coffee, drip brewing, espresso, 1-cup brewers, and purchase from chain coffee stores.
Table 2: Brewing method and brief description
Method Description
Cowboy Water is boiled and grounds soaked in water
Drip Brew Hot water perfused over grounds, coffee collected via gravity Espresso Hot water perfused over puck at high pressure
1-Cup Similar to Drip Brew, 1 cup at a time Chain Drip Brew in coffee-specific shop
Cowboy coffee will include different methods to prepare: boiling one cup of water to make one cup of coffee, boiling a pot of water to make coffee in a pot, and coffee made with a French press. Drip
brewing will compare different machines to prepare: one pot of coffee and leaving the warming plate on until automatic shutoff, one pot of coffee and turning the warming plate off, and two half-pots of coffee turning the warming plate off each time. Espresso will use information from a case study from a neighborhood espresso serving coffee house. 1-Cup brewers will include two models of Keurig 1-cup brewers. Lastly Starbucks will be examined as the chain coffee shop. It has been estimated that amount of energy used to brew coffee accounts for 0.5% (2005) to 4% (2011) of residential electricity consumption. As Table 3 shows, the majority of home coffee makers are drip brewers which are declining in sales while sales of 1-cup brewers and espresso machines have been increasing (Energystar_1).
Methods Analyzed:
The first method of brewing we will analyze is cowboy coffee. As mentioned above, this method of brewing coffee consists of letting coffee grounds steep in boiling or nearly boiling water. The size of the grounds are either fine which allows the grounds to sink to the bottom of the cup or pot on their own, or large which is used in the case of a French press to allow the plunger to separate the grounds from the liquid. The energy needed to bring one 8 oz cup of water to boil from 20°C is 4.186 𝐽
𝑔℃∗236.6 𝑔 ∗ 80℃= 79.2 𝑘𝐽= 0.022 𝑘𝑊ℎ. Data was
generated by (Murphy, 2012) that shows the energy consumption from various methods of boiling water and is summarized in Table 4. The gas stove was tested with two different pots, an uncovered (u) pot on a large burner (lb) and a covered (c) pot on a small burner (sb). We assumed a generous efficiency of electricity conversion of 40% in devices powered by electricity. The efficiencies of the device and electricity were multiplied to yield total efficiency. The total efficiency is
used along with the energy calculated to bring one cup of water to a boil to yield the amount of energy the various methods used. The covered pot on the small burner on a gas
Table 3: US Retail Unit Sales of Coffee Makers (millions)
Product Type 2006 2007 2008 2009 2010 Growth Rate
Drip-Brew 19.4 19.4 19.3 19.2 18.5 -1.2% 1-Cup 1.2 1.7 1.8 2.7 4.1 36.0% Espresso 1.1 1.2 1.3 1.4 1.4 6.2%
Total 21.7 22.3 22.4 23.3 24.0 2.6%
Table 4: Energy to boil Cowboy Coffee
Boil Method Efficiency Electricity EfficiencyTot Energy (kWh)
Gas Stove (u, lb) 16 na 16 0.14 Gas Stove (c, sb) 27 na 27 0.081
Microwave 40 40 16 0.14 Electric Kettle 70 40 28 0.079 Electric Stove 27 40 11 0.20
stove along with the electric kettle were calculated to have the best total efficiencies at 27 and 28% respectively, and a power usage of 0.08 kWh per cup of water boiled, while the microwave and a covered pot on a small burner on an electric stove were the worst using around twice as much power. During the course of this project a device that would measure the amount of energy in kWh that devices plugged into it called a Kill-a-Watt was purchased. This device was used to measure the energy used by various devices to brew coffee, the results of which will be summarized in a later table. Electric Beach electric kettle model K2070 used 0.17 kWh of electricity to bring 5.5 cups to a boil, which is an electricity use of 0.031 kWh per cup of water.
The next method of coffee brewing examined was automatic drip brewing. Brewing with a drip brewer adds a warming plate, a decanter/carafe, a microprocessor, and a filter compared to cowboy coffee. A Cuisnart DCC-1200 was used in a study where the energy to brew various size pots of coffee was evaluated (Energystar_2). The pot was used to brew ten cups once and two five-cup pots; the energy used was 0.27 kWh and 0.23 kWh, respectively. This corresponds to 0.027 kWh and 0.023 kWh per cup. The amount of energy to make the paper filter for the coffee is 0.13 kWh per sheet, the adjusted amount for these two brews were 0.040 kWh and 0.049 kWh. While espresso machines do not use a warming plate, they do need additional machinery (an electric pump/piston) to pressurize the water so that it can be directed through the puck of coffee grounds and a boiler or thermoblock to generate steam for frothing milk. Espresso machines do have a much smaller market share than other coffee machines, as seen in table 3. A study was performed at Rick and Ann’s Restaurant and Pantry in Berkeley CA that charted the use of electricity for an espresso machine during a week and this was normalized to the amount of drinks sold that week (Young and Nickel, 2000). The amount of energy used per drink was 0.25 kWh, although the machine was left on all night and in standby mode it still used a lot of energy. In fact it used 33% of its total energy during times when no drinks were being prepared. This highlights the fact that consumer behavior has a very large influence on energy usage per cup of coffee produced.
The quickest growing market in coffee preparation machines are the 1-cup brewers, which have a growth rate of 36% in America as shown in table 3 (Energystar_1). The large majority of these brewers are the Keurig machines. While there are no warming plates or high pressure components in the Keurig machines, they do use plastic pods to brew single cups of coffee at a time. These pods have been copyrighted by Green Mountain Coffee and over 11 billion of them have been sold since 1998 (Greenmountain). The sales of which have been growing at a rate of 70% per year. The pieces that make up the pod can be recycled after use, but only after manual separation of the plastic, tinfoil, paper filter, and coffee grounds. Two different Keurig 1-cup brewers one with a reservoir and another without a reservoir were analyzed with the Kill-a-Watt and used 0.04 kWh and 0.17 kWh to make one cup of coffee in a day.
Finally, we will examine the amount of energy used to produce a cup of coffee at a Starbucks. Starbucks was chosen because it is such a large company, with a revenue of nearly $11 billion in 2010 (Starbucks_1) and almost 17,000 shops in 40 countries (Starbucks_2). Power use at Starbucks stores averages 6.8𝑘𝑊ℎ
𝑓𝑡2 per month, or using the average size of 2200 ft
2
store average since 2008, and assuming 1000 drinks per day sold per store this equates to 0.52 kWh per drink. This does not include the energy to make the paper cups and cardboard heat protectors as only 1.9% of customers use reusable cups (Starbucks_3).
Environmental Impact:
The table and graph below represent the amount of energy used per cup of coffee brewed.
Cups were assumed to be reusable and washed every 5 uses, except for the case of Starbucks, which assumed a paper cup and the cardboard protector. Also of interest is the amount of trash generated is magnitudes of order higher for 1-cup brewers. The pods are made up of 2.1 g of plastic, 0.3 g of tinfoil/plastic on top, and 0.9 g of paper filter with an area of 63.8 cm3 per cup. This means that the 11 billion pods that have been used have generated 7x10⁵ m3 or 281 Olympic-sized swimming pools worth of trash since 1998.
Gas 16%
Gas 27%
Microwave Kettle Stove Drip Brew
Espresso 1-cup Starbucks
Brew 0.14 0.08 0.14 0.08 0.20 0.04 0.25 0.04 0.52
Filter 0.02 0.01
Capsule
0.02 0.03
Cup 0.05 0.05 0.05 0.05 0.05 0.05 0.05 0.05 0.20
Societal Impact:
Coffee contains cafestol and kahweol (only in Arabica coffee), two diterpenes that have been shown to increase cholesterol in studies (Urgert et al., 1997). In the study by Urgert et al. subjects were given 60 mg/day of cafestol and 50 mg/day of kahweol, after 28 days the average cholesterol had risen by 39 mg/dL and low density lipoproteins (LDL) had risen by 31 mg/dL. These amounts of diterpenes are what someone who drank 50 cups of coffee a day would expect, but another study looked at increases in cholesterol from 5 cups a day of coffee prepared various ways (Urgert et al., 1995). They did not look at LDL specifically, but we are assuming that the ratio of LDL/cholesterol increase stays constant and the results are shown in table 5 and figure 2.
We will also briefly examine the practice of fair-trade coffee, as this is what Green Mountain Coffee exclusively uses in their Keurig 1-cup brewers. The fairtrade labeling organization is the corporation that certifies fair-trade coffee. This corporation $0.10 per pound of fair-trade coffee sold, which was nearly 75 million pounds in 2005 (Valkila, 2010). Fair trade certification guarantees a minimum price to farmers per pound of coffee, and attempts to directly link farmers with importers (Mendoza and Bastiaensen, 2003). There is a premium paid for fair-trade coffee at the market, and very little of the extra money makes its way back to developing countries, with estimates from 1.6 to 18% (Valkila, 2010), with even less making its way back to the farmers. Farmers can occasionally make 3 to 4 times more per pound if they sell outside of free-trade contracts.
Economic Impact:
We will examine the cost of a cup of coffee brewed in various ways. Drip brewing costs $0.09 per cup for the cheapest beans on Amazon and $0.13 per cup for Starbucks beans. Keurig is more expensive, costing $0.41 per cup for the cheapest and $0.89 for Starbucks brand. Puck espresso costs $0.36 for the cheapest puck and $1.33 for Starbucks brand. Bought from a store a
Fig 2. Cholesterol increase from coffee.
The amount coffee prepared in a variety of ways increases cholesterol and LDL compared to the maximum recommended levels 200 and 70 mg/dL, respectively.
Table 5: Cholesterol from 5 cups of coffee/day
Type of Prep Drip Brew Instant Espresso Boiled French Press Turkish
Cholesterol added (mg/dL) < 0.4 0.4 3.9 7.3 8.9 9.7 LDL <0.3 0.3 3.1 5.8 7.1 7.7 1 cup <0.1 <0.1 0.8 1.5 1.8 1.9
cup of Starbucks coffee is $1.45 and 2 oz. of espresso is $2.35. We generated a graph showing the amount of cups of coffee you would have to consume if you bought a coffee maker for coffee and espresso, and this is represented in figure 3.
Fig. 3. Amount of Coffee to Break Even.
Works Cited:
2005. 2005 Residential Energy Consumption Survey, in: Administration, U.E.I. (Ed.). 2009. Coffee: World Markets and Trade, in: Agriculture, U.S.D.o. (Ed.),
http://www.fas.usda.gov/htp/coffee/2009/December_2009/2009_coffee_december.pdf.
2011. Prepatory Studies for Ecodesign Requirements of EuPs Lot 25 Non-Tertiary Coffee Machines, in: Commission, E. (Ed.).
Davids, K., 2001. Coffee : a guide to buying, brewing, and enjoying, 5th ed. St. Martin's Griffin, New York. Energystar_1, http://www.energystar.gov/ia/products/downloads/ENERGY_STAR_Scoping_Report_Coffee_ Makers.pdf. Energystar_2, http://www.energystar.gov/ia/products/downloads/ENERGY_STAR_Scoping_Report_Coffee_ Makers.pdf. Greenmountain. http://www.ico.org/botanical.asp, http://www.ico.org/botanical.asp.
Mendoza, R., Bastiaensen, J., 2003. Fair Trade and the Coffee Crisis in Nicaraguan Segovias. Small Enterprise Development.
Murphy, T., 2012. Burning Desire for Efficiency.
Pendergrast, M., 2010. Uncommon grounds : the history of coffee and how it transformed our world, Rev. ed. Basic Books, New York.
Ponte, S., 2002. The 'latte revolution'? Regulation, markets and consumption in the global coffee chain. World Dev 30, 1099-1122.
Raemy, A., Lambelet, P., 1982. A calorimetric study of self-heating in coffee and chicory. Int J Food Sci & Tech 17, 451-460.
Ramalakshmi, K., Raghavan, B., 1999. Caffeine in Coffee: Its removal. Why and How? (vol 39, pg 441, 1999). Crit Rev Food Sci 39, 553-553.
Silvarolla, M.B., Mazzafera, P., Fazuoli, L.C., 2004. Plant biochemistry: a naturally decaffeinated arabica coffee. Nature 429, 826.
Starbucks_1. Starbucks_2. Starbucks_3.
Ukers, W.H., 1976. All about coffee, 2d ed. Gale Research, Detroit,.
Urgert, R., Essed, N., vanderWeg, G., KosmeijerSchuil, T.G., Katan, M.B., 1997. Separate effects of the coffee diterpenes cafestol and kahweol on serum lipids and liver aminotransferases. Am J Clin Nutr 65, 519-524.
Urgert, R., Vanderweg, G., Kosmeijerschuil, T.G., Vandebovenkamp, P., Hovenier, R., Katan, M.B., 1995. Levels of the Cholesterol-Elevating Diterpenes Cafestol and Kahweol in Various Coffee Brews. J Agr Food Chem 43, 2167-2172.
Valkila, J., 2010. Empowering Coffee Traders? The Coffee Value Chain from Nicaraguan Fair Trade Farmers to Finnish Consumers. Journal of Business Ethics.
Verlengia, F., Rigitano, A., Nery, J.P., Tosello, A., 1965. Variations of the caffeine content in coffee beverages. ASIC.
Weinberg, B.A., Bealer, B.K., 2001. The world of caffeine: the science and culture of the world's most popular drug. Routledge, New York.