Air Force Institute of Technology Air Force Institute of Technology
AFIT Scholar
AFIT Scholar
Theses and Dissertations Student Graduate Works
3-13-2007
Predicting Group Performance Using Cohesion and Social
Predicting Group Performance Using Cohesion and Social
Network Density: A Comparative Analysis
Network Density: A Comparative Analysis
Frederick W. PetersonFollow this and additional works at: https://scholar.afit.edu/etd
Part of the Social Psychology and Interaction Commons
Recommended Citation Recommended Citation
Peterson, Frederick W., "Predicting Group Performance Using Cohesion and Social Network Density: A Comparative Analysis" (2007). Theses and Dissertations. 3017.
https://scholar.afit.edu/etd/3017
This Thesis is brought to you for free and open access by the Student Graduate Works at AFIT Scholar. It has been accepted for inclusion in Theses and Dissertations by an authorized administrator of AFIT Scholar. For more
PREDICTING GROUP PERFORMANCE USING
COHESION AND SOCIAL NETWORK DENSITY: A
COMPARATIVE ANALYSIS
THESIS
Frederick W. Peterson, First Lieutenant, USAF
AFIT/GEM/ENV/07-M11
DEPARTMENT OF THE AIR FORCE AIR UNIVERSITY
AIR FORCE INSTITUTE OF TECHNOLOGY
The views expressed in this thesis are those of the author and do not reflect the official policy or position of the United States Air Force, Department of Defense, or the United
AFIT/GEM/ENV/07-M11
PREDICTING GROUP PERFORMANCE USING COHESION AND SOCIAL NETWORK DENSITY: A COMPARATIVE ANALYSIS
THESIS
Presented to the Faculty
Department of Systems and Engineering Management Graduate School of Engineering and Management
Air Force Institute of Technology Air University
Air Education and Training Command In Partial Fulfillment of the Requirements for the Degree of Master of Science in Engineering Management
Frederick W. Peterson, BS First Lieutenant, USAF
March 2007
AFIT/GEM/ENV/07-M11
PREDICTING GROUP PERFORMANCE USING COHESION AND SOCIAL NETWORK DENSITY: A COMPARATIVE ANALYSIS
Frederick W. Peterson, BS First Lieutenant, USAF
Approved:
//SIGNED// 13 Mar 07
Kent C. Halverson, Lt Col (Chairman) Date
//SIGNED// 13 Mar 07
Daniel T. Holt, Lt Col (Member) Date
//SIGNED// 13 Mar 07
AFIT/GEM/ENV/07-M11
Abstract
Group performance has been an important topic as evidenced by an extensive literature review that has supports a positive relationship between group cohesion and performance. Social network researchers have also found similar relationships between cohesion and group performance using social network density as a proxy for cohesion. The traditional cohesion construct is measured using an attitudinal instrument that relies on member perceptions that are aggregated at the group level. The density construct, on the other hand, is based on social network relations which are based on behaviors and actual member interactions and relationships. Considering these differences, although both cohesion measures have been shown to predict group performance, it is important to understand their subtle differences in order for leaders to accurately understand how to influence each. A study of 672 students in 48 groups provided empirical evidence supporting a positive relationship between task cohesion and performance, while also a negative relationship was found for social cohesion and friendship network density relating to performance. Results also indicate a significant relationship between group cohesion and social network density suggesting that social network density could be used as a proxy for group cohesion.
AFIT/GEM/ENV/07-M11
Acknowledgments
I would first need to thank my wife for her hard work at home and putting up with me during the final long months of thesis work. I would also like to express my sincere appreciation to my thesis advisor for his many thoughtful insights and corrections. I would to thank my committee members for many helpful suggestions. Finally, I would like to thank my section members for their support and advice.
Table of Contents
Page
Abstract ... iv
Dedication ...v
Acknowledgements ... vi
Table of Contents ... vii
List of Figures ... ix List of Tables ...x 1. Introduction ...1 2. Literature Review ...4 2.1 Introduction ...4 2.2 Group Cohesion ...4
2.3 Social Network Density ...6
2.4 Group Cohesion vs. Social Network Density ...8
2.5 Performance Predicting Abilities ...9
3. Methodology ...11 3.1 Sample ...11 3.2 Demographics ...11 3.3 Procedure ...12 3.4 Measures ...12 3.4.1 Performance ...12 3.4.2 Cohesion ...13 3.5 Analysis ...14 3.5.1 Regression ...14 3.5.2 Multitrait Multimethod ...15 4. Results ...17 4.1 Factor Analysis ...17
4.2 Multitrait Multimethod Analysis ...17
4.3 Regression Analysis ...19
4.3.1 Regression on Total Performance ...20
Page
4.3.3 Regression on Physical Performance ...21
4.3.4 Regression on Team Performance ...22
5. Discussion ...23
5.1 Introduction ...23
5.2 Factor Analysis Conclusions ...23
5.3 Multitrait Multimethod Conclusions ...24
5.4 Regression Conclusions ...24
5.5 Limitations and Future Research ...25
5.6 Summary ...26
Appendix A. Survey Instrument ...27
List of Figures
Figure Page
List of Tables
Table Page
1. Varimax Factor Analysis Results ...17
2. Multitrait Multimethod Results ...18
3. Regression on Total Performance...20
4. Regression on Academic Performance ...21
5. Regression on Physical Performance...21
PREDICTING GROUP PERFORMANCE USING COHESION AND SOCIAL NETWORK DENSITY: A COMPARATIVE ANALYSIS
1. Introduction
Group performance has been an important topic as evidenced by the many research papers relating to group performance. Researchers since the 1950’s (Bavelas, 1950; Festinger, 1950) have examined the relationship between small groups and
performance by analyzing how the members within the group interact with each another. These researchers suggested that the group interaction creates cohesion within the group and, the stronger the cohesiveness, the greater the productivity of the group (Cartwright, 1968). Since then, much emphasis has been placed on the importance of teamwork and its relation to performance (Beal, Cohen, Burke, & Mclendon, 2003). However, while many researchers agree with the teamwork-performance relationship (Evans & Dion, 1991; Klein & Mulvey, 1995; Oliver, Harman, Hoover, Hayes, & Pandhi, 2000), other empirical studies on the relationship between group cohesion and group performance have had varied results (Stogdill, 1972, Tziner, 1982).
Group cohesion was first defined by Festinger (1950) who referred to group cohesiveness as “the result of all forces acting on members to remain in the group” (p. 274). Recent group cohesion research considers this definition in three parts; task commitment, interpersonal attraction, and group pride (Beal et al., 2003). With an
increase in the study of social network analysis, social network density has been used as a measure of group cohesion (Yang & Tang, 2004). Social network density research has examined network density and found it be related to group performance (Balkundi &
Harrison, 2006; Reagons & Zuckerman, 2001; Sparrowe, Liden, Wayne, & Kraimer, 2001; Yang & Tang, 2004). Although the traditional definition of group cohesion and the more recent application of social network density are seemingly related, few researchers have noted the similarities or have investigated the differences. Several papers from the social network literature that mention group cohesion and use social network density as a proxy to quantify the forces that hold a group together. This indicates that researchers are still unclear about what each construct is measuring or assume group cohesion and social network density are the same. The answer to this problem may lie in the how each construct is measured.
Historically, research has shown that group cohesion constructs measured at the group level are strongly related to group performance (Beal, et al., 2003; Evans & Dion, 1991; Gully, Devine, & Whitney, 1995; Mullen & Copper, 1994; Oliver, et al., 2000). However, a potential limitation with the group cohesion construct is that the researchers may be only addressing one of the facets of group cohesion in their instruments and are may not be capturing all three facets in a single instrument (Beal, et al., 2003).
A meta-analysis of social networks suggests that there is a relationship between social network density and performance (Balkundi & Harrison, 2006). This relationship was a positive correlation between network density and group performance. Yang and Tang (2004) defined group cohesion index as network density and reported a positive correlation between network density and performance, indicating there may be a possibility of measuring group cohesion using social networks.
The purpose of this study is to investigate the construct of group cohesion by comparing and contrasting the most commonly used measurements for group cohesion and social network density, and then investigate the predictive nature of each instrument.
2. Literature Review 2.1 Introduction
Much of the earlier research on group performance relied on group cohesion as a main predictor (Evans & Dion, 2001; Oliver et al., 1998). There has been some
controversy with how well group cohesion predicts group performance in the past (Mudrack, 1989). Now, it is generally accepted that group cohesion is related to group performance, providing that a multifaceted definition of cohesion is used (Beal et al., 2003). Some preliminary studies indicate that group cohesion is a relatively stable group-level construct, even in the midst of significant organizational change that influences interpersonal interactions (Dowd & Paulsen, 2006).
The social network literature also studies cohesion. Although the underlying meaning of the cohesion construct may be similar, social network researchers use network density as a proxy for cohesion (Ying & Yang, 2004). Social network researchers have found similar relationships between network density and group performance (Ying & Yang, 2004). Considering these differences, although both cohesion measures have been shown to predict group performance, it is important to understand their differences in order for leaders to accurately understand how to influence each.
2.2 Group Cohesion
In 1950, Leon Festinger published a pivotal piece of literature that added greatly to the group cohesion construct. In this work he defined cohesion as “the resultant of all the forces acting on all the members to remain in a group” (Festinger, 1950, p. 274).
Festinger acknowledged that there is a possibility of several different types of cohesion. Current literature considers cohesion in three components: (a) interpersonal attraction, (b) task commitment, and (c) group pride (Beal, et al., 2003). Interpersonal attraction is defined as “a shared liking for or attachment to the members of the group” (Beal, et al., 2003, p. 995). Task commitment is defined as, “the extent to which the task allows the group to attain important goals or the extent to which a shared commitment to the group’s task exists” (Beal, et al., 2003, p. 995). Group pride is defined as, “The extent to which group members exhibit liking for the status or the ideologies that the group supports or represents, or the shared importance of being a member of the group” (Beal, et al., 2003, p. 995). While the Beal et al. (2003) suggests that all of the three components are important when measuring cohesion, most of literature only measures social and task cohesion (Beal, et al., 2003, Carless & DePaola, 2000, MacCoun, 1996). Social cohesion can be defined as the interpersonal attraction to the group and task cohesion can be defined as shared group commitment for the purpose of achieving task related outcomes (McIntyre, Strobal, Hanner, Cunningham, & Tedrow, 2003, MacCoun, 1996).
Much emphasis has been placed on the importance of group cohesion and its relation to performance (Beal, et al., 2003; Evans & Dion, 1991; Gully, et al., 1995; Klein & Mulvey, 1995; Mullen & Copper, 1994; Oliver, et al., 2000). Beal’s meta-analysis reviewed 64 separate articles on group cohesion and found that group cohesion is positively related to group performance on each of group cohesion’s three components (Beal, et al., 2003). The suggested mechanisms are social and motivational forces that exist between group members create bonds that lead to more productivity in the group (Beal, et al., 2003). When cohesion is strong, those bonds are believed to be strong, and
this causes the group to perform better than then the group normally would (Cartwright, 1968).
However, while many researchers agree with the cohesion-performance relationship (Beal, et al., 2003; Evans & Dion, 1991; Gully, et al., 1995; Mullen & Copper, 1994; Oliver, et al., 2000), other empirical studies have had varied results (Klein & Mulvey, 1995; Stogdill, 1972). One of the papers suggests that cohesion was mediated by group goal processes which caused the inconsistencies in the cohesion-performance relationship (Klein & Milvey, 1995). Another author suggested that the effects of cohesion are indirect and possibly mediated (Stogdill, 1972). In addition, researchers have also discovered inconsistencies in cohesion measurements (Mudrack, 1989; Oliver, et al.,2000; Gully, et al., 1995), suggesting that there could be a more effective means to measure group cohesion.
Although some researchers have pointed out inconsistencies with the performance relationship, the majority of the literature points to a positive cohesion-performance relationship (Beal et al., 2003, Mullen &Copper, 1994). This leads to the following hypothesizes from the group cohesion measures:
H1a: Task cohesion is positively related to group performance
H1b: Social cohesion is positively related to group performance
2.3 Social Network Density
Social network analysis grew out of research in the 1930’s that involved sociometric analysis using Kohler’s gestalt theory and Harvard researchers who were exploring patterns of interpersonal relations. Key breakthroughs that applied
mathematical methods to social theory occurred in the 1960’s by Harrison White, allowing for a well developed methodology of social networks to occur (Scott, 2000)
Many researchers using social network analysis techniques discuss cohesion of social networks (Balkundi & Harrison, 2006; Scott, 2000; Wasserman & Faust, 2006; Ying & Yang, 2004). However, although the underlying meaning of the cohesion construct may be similar across different researchers, social network researchers use density as a proxy for cohesion because a denser group has more ties among its members (Scott, 2000; Wasserman & Faust, 2006). Social network analysts view groups as a series of relationships between members (Wasserman & Faust, 2006), resulting in the ability to quantify the relationships into meaningful uses such as density (Wasserman & Faust, 2006). Social network density, measure of overall communication between individuals within a network, is simply an aggregation of the connections within a network, expressed as a ratio or percentage or reported connections in a network divided by the total number of possible connections (Degenne & Forse; 1999; Scott, 2000). The network type uses social network densities to describe what type of relationship is occurring between the groups’ members.
Two types of social networks are commonly referred to as prescribed/formal and emergent/informal networks (Ibarra, 1993). A formal network can be described as a set of formally specified relationships that occur between supervisors and subordinates or among equal peers who must accomplish an organizationally defined task or ties that form during the course of performing appointed work roles (Ibarra, 1993; Lincoln & Miller, 1979). An informal network develops out of people who seek out others that have the same self interest (Ibarra, 1993). Informal networks can be further broken down into
friendship/expressive and advice/instrumental ties (Balkundi & Harrison, 2006). A friendship network is one where the ties are of social interaction due to liking one
another. An example of this would be going out to eat as a group when it is not required. An advice network describes the ties through which information and guidance is shared that is related to the completion of the group’s work (Yang & Tang, 2004). An example of this is seeking advice from someone even though you are not required to do so.
Social network researchers have found similar relationships between cohesion (i.e., density) and group performance (Ying & Yang, 2004). Social network density research has shown density to have a correlation with group performance (Baldwin, Bedell, & Johnson, 1997; Balkundi & Harrison, 2006; Reagons & Zuckerman, 2001; Sparrowe, et al., 2001; Ying & Yang, 2004). In a recent meta-analysis between social network density and performance, Balkundi & Harrison (2006) found that there is a positive link between a task network and group performance, and friendship network and group performance. The following hypotheses from previous social network measures findings will be tested, thus the following hypotheses are offered:
H2a: Density in the friendship network is positively related to group performance
H2b: Density in the advice network is positively related to group performance
2.4 Group Cohesion versus Social Network Density
Cohesion and density are measured using different instruments. The traditional cohesion construct is measured using an attitudinal instrument that relies on member perceptions that are aggregated at the group level. The density construct, on the other hand, is based on social network relations which are based on behaviors and actual member interactions and relationships. However, when reading previous research of the
literature, many discuss cohesion and explain it as network density. An example of this is Ying and Yang (2004) reporting relationships between cohesion and group
performance while using social network density as a proxy for cohesion. Balkundi and Harrison’s (2006) paper specifically mentions that network density is conceptually different from the group cohesion construct because social network density captures a pattern of behavior which group cohesion does not. Group cohesion has also been defined as a way to measure the strength of the bonds within a group based on the premise that stronger bonds result in more cohesive groups (Beal et al., 2003). Social network density is described as a level of interrelatedness of all possible ties of a group (Scott, 2000). The definitions of group cohesion and social network density appear as they are both defining the same type of interaction and the strength of that interaction between group members. This research leads to the following hypotheses:
H3a: Task cohesion is positively related to density in the task network
H3b: Social cohesion is positively related to density in the friendship network
2.5 Performance Predicting Abilities
In addition to the investigation of the relationship between the traditional cohesion measure and social network density, it is also meaningful to understand the predictive ability of both. This will enable managers and leaders to use the best predictive measure to determine their groups’ performance.
In their meta-analysis of 35 studies Oliver et al. (2000), indicated the effect size of group cohesion to performance of .40. In their meta analysis of 64 studies Beal et al. (2003), found the effect sizes of group cohesion’s three facets (i.e., interpersonal attention, task commitment, and group pride) to be .20, .26, and .28, respectively.
A meta-analysis study has also considered cohesion using network density as a proxy. The Balkundi and Harrison (2006) meta-analysis found that density of an
instrumental network had a corrected correlation of .15 with group performance and that density of an expressive network had a corrected correlation .22 with group performance. The meta-analysis used 17 studies for the instrumental network correlation and nine studies for the expressive network correlation. All of the relationships were positive for both the group cohesion and network density predicting performance. Group cohesion has had a stronger relationship to performance than network density based on the meta-analyses previously discussed. This leads to the following hypotheses:
H4a: Task cohesion has a stronger relationship with group performance than density of the task network
H4b: Social cohesion has a stronger relationship with group performance than density of the social network
3. Methodology 3.1 Sample
The sample consisted of newly accessioned USAF officers attending an
introductory professional development course. The course covered a core curriculum in which the students were evaluated in team, physical fitness, and academic performances. The course had 670 students divided in to 48 groups with 13 to 14 people in each. These groups were composed of officers from different career fields throughout the USAF. Administrators at the squadron officer college consider demographics to ensure that the groups are as diverse as the Air Force in terms of ethnicity, career field, type of
commission, age, and gender. The administrators considered demographics when creating the groups to ensure that uniformity is such that there were no groups that had a particular advantage over the other due to previous experience working together. This type of structure and homogeneity of groups controls for potential group differences and allows for comparisons between groups and their performance. The uniformity of the groups will also help control nuisance variables such as prior experience working together or an advantage of experience of the Air Force.
3.2 Demographics
The sample had an age range from 22 to 40 with over 50% of them being 22 and 23. Males were 80.3% of the population. The ethic breakdown was: African American at 8.6%, American Indian at 0.3%, Asian at 5.5%, Hawaiian or Pacific Islander at 0.7%, Multi at 2.4 %, Caucasian at 81.5%, and the remaining were unknown. The educational
background had minimal variance with 90.8% of the sample had a bachelor’s degree, and the remaining had masters, doctorates, or unknown degrees.
3.3 Procedure
Questionnaires were administered twice during the professional development course. The primary researcher created 48 envelope packets that consisted of one flight commander questionnaire, one coded number roster for group names to keep the groups anonymous to the researchers, and 14 student questionnaires. The packets were then delivered to an on-site administrator who distributed the packets to the each group. The instructor then followed the provided instructions. The surveys were distributed on 17 Jan 07 during the first week of the course for time one, and then again on the 20 Feb 07 in the last week of the course for time two. The questionnaire and relevant instructions are located in appendix A.
3.4 Measures
3.4.1 Performance
Performance was measured using secondary data routinely measured by the training administrators as course outcome criteria. Performance measures consisted of physical fitness, academics, and team performance. Physical fitness was measured by a 3-mile run and an unofficial Air Force physical fitness test consisting of push-ups, sit-ups, and a 1.5 mile run. Individual student physical fitness scores were aggregated at the group level as a measure of group physical fitness. Academic performance was measured by a pretest and posttest with questions about the entire course core curriculum.
Individual test scores were aggregated at the group level as a measure of group academic performance. Team performance was measured by determining how a group performs in
direct competition with other groups in computer combat simulations and is measured individually by interactive exercises.
3.4.2 Cohesion
Three commonly used measures of group cohesion were used, as well as two social network measures that researchers purport to measure cohesion. Seashore’s (1954) scale is a 5-item measure (α = .89) of the social dimension of cohesion. The items were modified only to make the items relevant within an Air Force context. For instance, the Air Force uses the term “flight” instead of “group.” An example of an item is, “In my flight, people help one another on the job better than most other flights.” Langfred’s (1998) scale uses a 9-item measure (α = .71) to measure the social and task dimension of cohesion. An example of an item is, “I can rely or count on my fellow flight members to help me and support me if I am having difficulties.” Bernthal & Insko’s (1993) scale attempts to measure both social and task cohesion using a 4 item measure (α = .90). An example of the items is, “The people in my flight have high social skills” and “My flight is focused on completing the tasks.” The measures all used a Likert type scale.
The social network instrument is designed to measure both the social and task dimensions of cohesion. The instrument requires individuals within each group to evaluate their relationships with each other member in the group. The task network uses three items: (a)“I value this person’s opinion or advice,” (b)“I spend time on work-related tasks with this person,” and (c)“I go to this person for help on work-work-related tasks.” The Cronbach’s alpha for the task network of the instrument was .74. The friendship network consists of three items: (a)“I enjoy ‘hanging out’ with this person,” and (b)“I spend time in social-oriented activities with this person (dining out, sports, etc.),” and
(c)“I consider this person as a friend.” The Cronbach’s alpha for the friendship network of the instrument was .72. The six items were listed next to a roster of group members, creating a matrix-like form. Each group member was instructed to identify members in their group. Each statement that applied was marked by putting a check in the box under each appropriate item next to the name of each appropriate individual. Social cohesion was calculated using the density of the friendship network, while task cohesion was calculated using the density of the task network. The social network instrument used a dichotomous scale in which respondents indicated relationships with a checkmark, with no check mark indicating no relationship.
3.5 Analysis
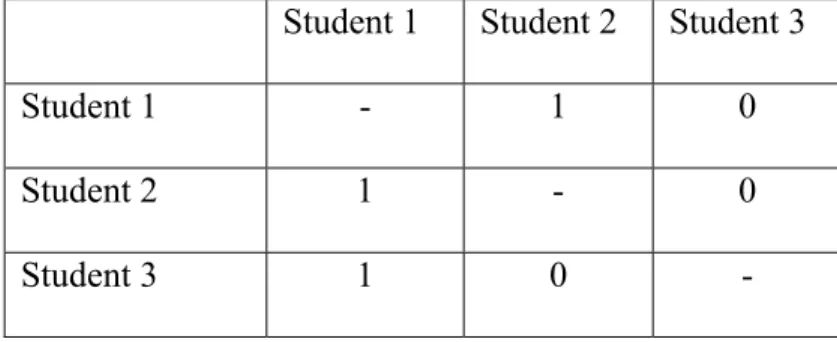
Responses for the social network were entered into a matrix. This matrix has the personnel in the group arrayed in the columns and in the rows, and each question
generates a unique matrix. An example matrix is shown below in Figure 1. In the matrix the person’s identification of a link was “1”. The density of the example matrix would be determined by calculating the total responses by the total possible responses. In this case it would be .5 (3/6). Also of note is that a person’s response on themselves is not
counted.
3.5.1 Regression
In testing the hypotheses, this research used linear regression with an estimation model of:
Yi = β0 + β1 (Task Component)i + β2 (SocialComponent)i
where Yi is the relevant performance measure (i.e. combined, academic, physical fitness,
i individuals; β1 represents the effect that the group task component has on the
performance measure; β2 represents the effect that the group social component has on the
performance measure. The group task component and group social component were identified from the measures described in section 3.4.2. Four regressions were completed on the four performance measures.
Question “I value this person’s opinion or advice”
Student 1 Student 2 Student 3
Student 1 - 1 0
Student 2 1 - 0
Student 3 1 0 -
Figure 1: Example Social Network Matrix
3.5.2 Multitrait Multimethod (MTMM)
Convergent and discriminant validity were estimated using the multitrait-multimethod (MTMM) process (Campbell & Fiske, 1959). This process has four conditions of the MTMM matrix that must be met to determine convergent and discriminant validity. The first condition requires “that the entries in the validity diagonal should be significantly different from zero and sufficiently large enough to warrant further examination of validity”(Campbell & Fiske, 1959, p. 82) The second condition is “that the validity diagonal value should be higher than the values in the corresponding row and column in the heterotrait-heteromethod triangles”(Campbell & Fiske, 1959, p. 82). This can be interpreted to mean that the value for similar correlations should be higher than values for non-similar correlations for any particular variable. The third condition “that a variable should correlate higher with an independent effort to
measure the same trait than with measures designed to get at different traits which happen to employ the same method”(Campbell & Fiske, 1959, p. 83). This can be interpreted to mean that the values of validity diagonals should be higher than the values in the
heterotrait-monomethod triangles. The final condition is “that the same pattern of trait interrelationship be shown in all of the heterotrait triangles of both the monomethod and heteromethod triangles”(Campbell & Fiske, 1959, p. 83). The first condition determines convergent validity and the last three conditions determine discriminant validity. Convergent validity is defined as a high correspondence between scores from two or more different measures of the same construct (Schwab, 2005). Discriminant validity is defined as when the scores from measures of different constructs do not converge (Schawb, 2005).
4. Results 4.1 Factor Analysis
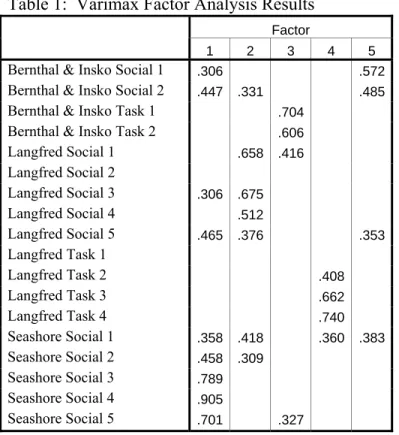
The factor analysis was done on the individual responses done at time two. The varimax factor analysis determined 5 different factors roughly breaking into the five different measures used to report group cohesion. Those factors show the Bernthal and Insko’s (1993) task and social cohesion measure are separate, Langfred’s (1998) task and social cohesion measures should have had three questions removed, and Seashore’s (1954) social measure should have had one question removed. This indicates that construct validity is good.
Table 1: Varimax Factor Analysis Results
Factor
1 2 3 4 5
Bernthal & Insko Social 1 .306 .572
Bernthal & Insko Social 2 .447 .331 .485
Bernthal & Insko Task 1 .704
Bernthal & Insko Task 2 .606
Langfred Social 1 .658 .416 Langfred Social 2 Langfred Social 3 .306 .675 Langfred Social 4 .512 Langfred Social 5 .465 .376 .353 Langfred Task 1 Langfred Task 2 .408 Langfred Task 3 .662 Langfred Task 4 .740 Seashore Social 1 .358 .418 .360 .383 Seashore Social 2 .458 .309 Seashore Social 3 .789 Seashore Social 4 .905 Seashore Social 5 .701 .327
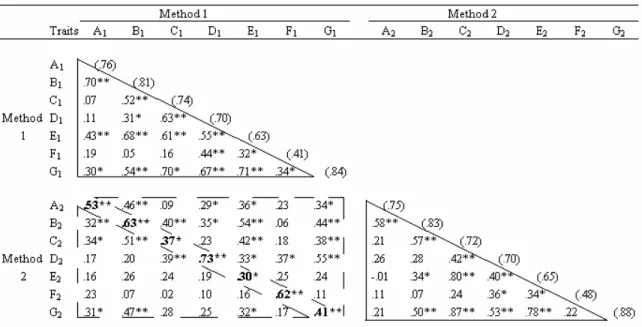
4.2 Multitrait MultiMethod Analysis
The validity diagonal meets the first aspect of the MTMM by being significantly different than zero on all values. The validity diagonal is sufficiently large enough to
examine and all of the values are significant. This indicates that there is some convergent validity.
Table 2: Multitrait MultiMethod Results
As for the second aspect, the values of the validity diagonal are larger than the values in their respective columns and rows in the heterotrait-heteromethod triangles for only A1-A2, B1-B2, D1-D2, and F1-F2 values. For the third aspect, the values in the
validity triangle should be larger the values in the heterotrait-heteromethod triangles. This condition is not met due to several correlations (ie, A1-B1, E1-G1, C2-E2, C2-G2, E2
-G2) being very high in the heteromethod triangles. The final aspect called for a pattern of
This indicates that there is a little discriminant validity because of the three aspects required for discriminant validity, only the pattern in the correlations was met.
Also of note is that network task density was not significantly related to any task cohesion measure at time one or time two and was slightly related to some social
cohesion measures and friendship network density. The friendship network density was significantly related to the social cohesion measures. The social cohesion measures were significantly related to one another and the task cohesion measures were significantly related to each other. There were also some instances of task cohesion being
significantly related to social cohesion. This leads to the conclusion that H3a was not supported and H3b was partly supported.
4.3 Regression Analysis
The regression analysis provided support for the hypothesis task cohesion having a positive relationship to performance with a positive b values of 17.012, 15.351,2.671, 2.559, 23.225, 16.227 for all the regressions. It does not support the hypothesis social cohesion is positively related performance because b values were mostly negative (i.e., -12.701, -8.687, -2.811, -2.556, -14.777, and –11.193). The hypothesis friendship network density will be positively related to performance was not supported due to a b value of -6.189 and -7.081 for the academic regression. The hypothesis of task network density having a positive relationship with performance was not supported because no significant b values were reported. The hypothesis of task cohesion being a better predictor than task network density was found to be true because task cohesion was a better predictor of performance than task network density due to task cohesion having significant b values reported. Social cohesion measures predicted performance more
consistently than friendship network density, but this was only a partial support for the hypothesis of social cohesion will be a better predicator than friendship network density because friendship network density did have a b value for predicting academic
performance. Following is a breakdown of each predictive measure for each type of performance.
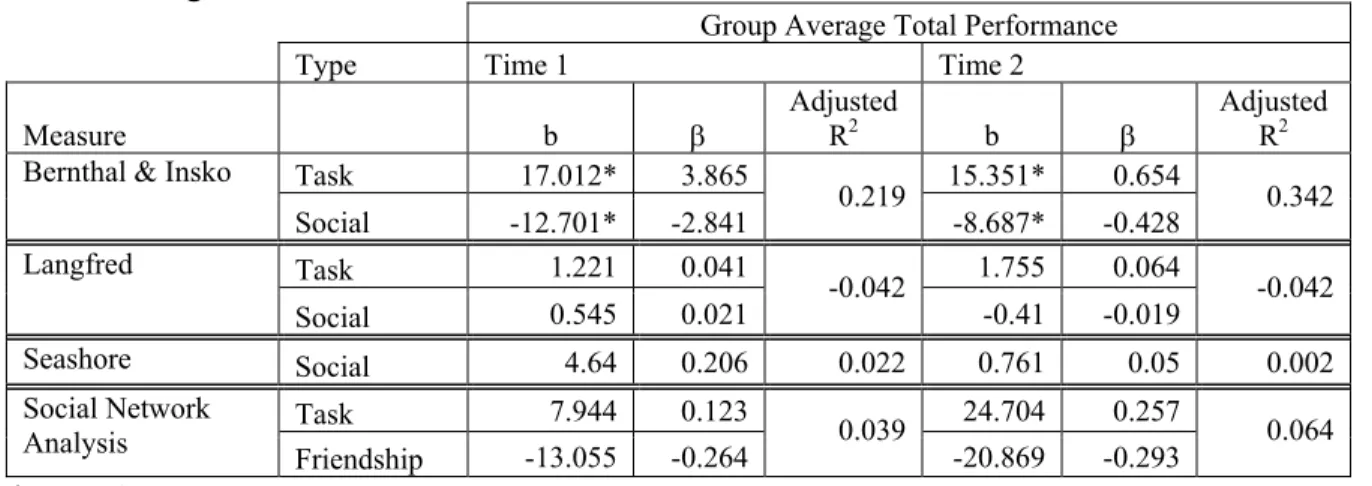
4.3.1 Regression on Total Performance
The Bernthal and Insko (1993) measure was the only measure that was significant for either time 1 or 2. In this measure both the task and social cohesion were significant with the social cohesion having a negative relationship and task cohesion having a positive relationship.
Table 3: Regression Total Performance
Group Average Total Performance
Type Time 1 Time 2
Measure b β Adjusted R2 b β Adjusted R2
Task 17.012* 3.865 15.351* 0.654
Bernthal & Insko
Social -12.701* -2.841 0.219 -8.687* -0.428 0.342 Task 1.221 0.041 1.755 0.064 Langfred Social 0.545 0.021 -0.042 -0.41 -0.019 -0.042 Seashore Social 4.64 0.206 0.022 0.761 0.05 0.002 Task 7.944 0.123 24.704 0.257 Social Network Analysis Friendship -13.055 -0.264 0.039 -20.869 -0.293 0.064 * = p<.05
b = raw regression coefficients
β = standardized regression coefficients
4.3.2 Regression on Academic Performance
As described in Table 3, Bernthal and Insko’s (1993) measure was related to academic performance with both of its task and social cohesion components having an effect on academic performance at both times. Another significant relationship was that the friendship density was related to academic performance at a negative relationship at
both times. There was also one significant negative social cohesion relationship at time 2 for the Langfred (1998) measure.
Table 4: Regression Academic Performance
Group Average Academic Performance
Type Time 1 Time 2
Measure b β Adjusted R2 b β Adjusted R2
Task 2.671* 0.392 2.559* 0.380
Bernthal & Insko
Social -2.811* -0.407 0.077 -2.556** -0.484 0.19 Task 1.119 0.146 -0.02 -0.306 Langfred Social -1.438 -0.212 0.004 -1.749* -0.003 0.053 Seashore Social -0.534 -0.092 -0.013 -0.628 -0.16 0.004 Task 4.047 0.238 1.474 -0.387 Social Network Analysis Friendship -6.189* -0.476 0.085 -7.081* 0.06 0.086 * = p<.05, ** = p<.01
b = raw regression coefficients
β = standardized regression coefficients
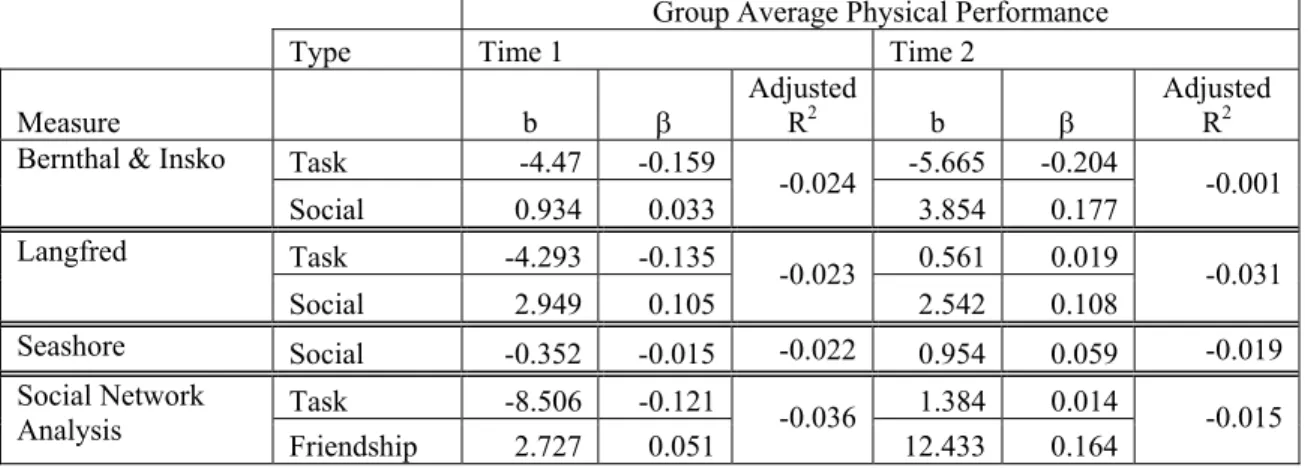
4.3.3 Regression on Physical Fitness Performance
There were no significant results for any of the measure in terms of physical fitness performance.
Table 5: Regression Physical Fitness Performance
Group Average Physical Performance
Type Time 1 Time 2
Measure b β Adjusted R2 b β Adjusted R2
Task -4.47 -0.159 -5.665 -0.204
Bernthal & Insko
Social 0.934 0.033 -0.024 3.854 0.177 -0.001 Task -4.293 -0.135 0.561 0.019 Langfred Social 2.949 0.105 -0.023 2.542 0.108 -0.031 Seashore Social -0.352 -0.015 -0.022 0.954 0.059 -0.019 Task -8.506 -0.121 1.384 0.014 Social Network Analysis Friendship 2.727 0.051 -0.036 12.433 0.164 -0.015
b = raw regression coefficients
4.3.4 Regression on Team Performance
As described in Table 5, Bernthal and Insko’s (1993) measure had a significant relationship to team performance for both social and task cohesion at both times. Also significant was Seashore’s (1954) measure at time one. It should be noted that
Seashore’s (1954) measure and Bernthal and Insko’s (1998) measure provided inconstant results in terms of the social cohesion component.
Table 6: Regression Team Performance
Group Average Leadership Performance
Type Time 1 Time 2
Measure b β Adjusted R2 b β Adjusted R2
Task 23.225** 0.647 16.227** 0.463
Bernthal & Insko
Social -14.777* -0.406 0.217 -11.193** -0.407 0.188 Task 2.124 0.059 -5.049 -0.17 Langfred Social -0.003 0 -0.041 -3.278 -0.088 0.003 Seashore Social 8.885* 0.291 0.065 -1.667 -0.081 -0.015 Task 7.381 0.085 37.167 -0.285 Social Network Analysis Friendship -9.293 -0.14 -0.035 -27.346 0.287 0.025 * = p<.05, ** = p<.01
b = raw regression coefficients
β = standardized regression coefficients
5. Discussion 5.1 Introduction
The purpose of this research was to compare a set of cohesion measures, to include social network density, and determine the predictive abilities in various measures of performance. Previous research had determined positive relationships between group cohesion and performance as well as positive relationships between network density and performance (Balkundi & Harrison, 2006; Beal et al., 2003; Oliver et al., 2000). Result indices predicted that social and task cohesion will be positively related to performance and advice and friendship network density will be positively related to performance. Also hypothesized was that group cohesion would have a stronger relationship with performance then network density. Previous research had used network density as a proxy for group cohesion due to similar definitions of cohesion in their research
(Balkundi & Harrison, 2006; Yang & Tang, 2004). This research result indices predicted task cohesion being positively related to advice network density and social cohesion being positively related to friendship network density.
5.2 Factor Analysis Conclusions
Factor analysis determined the construct validity of the group cohesion measures. The factor analysis did determine that three questions could have been removed from Langfred’s measure. With those questions were removed the reliabilities of the measures could improve enhancing the performance predicting capabilities of the measure. This is something that could be examined in a future study.
5.3 Multitrait MultiMethod Conclusions
Multitrait multimethod analysis was completed to determine convergent and discriminate validity. This analysis helped analyze the hypothesis that task cohesion will be positively related to task network density (H3a) and social cohesion will be positively related to friendship network density (H3b). The MTMM determined that there is some convergent validity which was expected for the cohesion measures because the cohesion measures are of the same construct and was also expected if the network densities to relate to the cohesion measures. The MTMM also determined that there was little discriminant validity which was also expected if the measures are measuring the same construct.
5.4 Regression Conclusions
The regression results showed that there is a positive relationship between the Bernthal & Insko task cohesion and total, academic, team performances. This was an expected result for all the task cohesion measures and this supports the hypothesis of task cohesion being positively related to performance (H1a). The regression showed a
negative relationship between Bernthal and Insko social cohesion and total, academic, and team performances. This was opposite of the hypothesis of social cohesion having a positive relationship with cohesion and could mean that while the group is socially active and information is flowing on the social cohesion, there is little attention to
accomplishing tasks. The regression showed the Seashore social cohesion was positively related to team performance. This was an expected result and supports the hypothesis the social cohesion will be positively related to performance. There was an inconsistency in the social cohesion measures due to the reported results. This inconsistency could be
explained by that they are both measuring different aspects of social cohesion. Regression showed that the friendship network density was negatively related to
academic performance. This could indicate that when the friendship network density is high, the individual may be more interested in personal relationships and maintaining those relationships then performing well (Balkundi & Harrison, 2006). The task network density produced no significant results. The best predicting measure was the Bernthal and Insko task and social cohesion measure because it produced significant results for three of the four performance measures. Because both the social and task cohesion components of the Bernthal and Insko measure predicted performance better than any other measure hypothesizes H4a and H4b were partially supported.
5.5 Limitations and Future Research
The structured groups allowed for control of nuisance variables, but also provided an environment that may not be the same as these same groups of people in different situations. One limitation is the times when the survey was administered. At time one the group should have been in the forming stage of Tuckman’s (1965) model. At time two the group could have been in the adjourning stage of Tuckman’s (1965) model. This implies that the groups’ internal bonds/ties could be different from when they are at the optimal performing stage. This could be a reason why many of the measures did not produce significant results with the regression. A possible reason why social cohesion and friendship network density had a negative relation with performance is because of the energy it takes to maintain the social bonds (Balkundi & Harrison, 2006) . Further
research should be done at separate times throughout the entire training to fully capture cohesion and network density. Another limitation is that task cohesion had few
established measures, and it would be worthwhile to determine a reliable task cohesion measure. Finally, the limitation of common method variance as described by Podsakoff and Organ (1986) applies in this situation because the common error of the measure is contaminating the measures the same way at both times. A way to correct this would be to use the flight commanders group cohesion survey results because then two methods would be utilized rather than one.
5.6 Summary
This study tested the predictive capability of instruments from group cohesion and social network analysis. It was shown that group cohesion and social network analysis had positive relationships with performance (Beal et al., 2003; Oliver et al., 2000; Balkundi & Harrison, 2006). Also shown was that social network density is sometimes used as a proxy for group cohesion (Balkundi & Harrison, 2006; Yang & Tang, 2004). This study confirmed that task cohesion is positively related to performance but found that social cohesion and friendship density are negatively related to performance. This study also found that group cohesion and social network density are slightly related.
Appendix A. Survey Instrument ASBC Student Survey
Study Title: Group Cohesion and Social Networks: A Comparative Analysis Participation: There are no anticipated risks associated with participation. There are also no direct benefits for participation. Your participation is completely voluntary and there is no penalty for non-participation. You do not have to answer any question(s) that you do not wish to answer. However, please consider that the greater the participation in each flight, the more insightful and useful the data will be for researchers.
Anonymity: We greatly appreciate your participation. All of your responses and information provided in this survey are anonymous.
Time Involved: This survey is anticipated to take no longer than 15 minutes.
Contact Information: If you have any questions about the survey, please contact Lt Col Kent Halverson, (937) 266-3652 or at [email protected].
Survey Instructions:
• There are no right or wrong answers, so don’t dwell on any one question— just answer honestly what first comes to mind.
• Please do not discuss your answers with other flight members—your responses should be independent. We don’t want your opinions and responses to influence other participants.
I have read the procedure above. I voluntarily agree to participate in the procedure by writing in a number below.
Write your number from coded roster: ______
Write your flight number: ___________
Section 1
Please fill in the circle that reflects the extent to which you agree with each statement.
1
Strongly Disagree2
Disagree3
Slightly Disagree4
Neither Agree Nor Disagree
5
Slightly Agree6
Agree7
Strongly Agree1. The people in my flight have high social skills.
1 2 3
4
5
6 7
2. My flight is focused on keeping a positive socialatmosphere.
1 2 3
4
5
6 7
3. The people in my flight have high problem-solving
skill.
1 2 3
4
5
6 7
4. My flight is focused on completing the tasks.
1 2 3
4
5
6 7
5. Other members in my flight are prepared to giveadvice or help me with my own tasks.
1 2 3
4
5
6 7
6. I need to rely on other flight members to be able tocomplete my tasks.
1 2 3
4
5
6 7
7. I can rely or count on my fellow flight members to
help me and support me if I am having difficulties.
1 2 3
4
5
6 7
8. My fellow flight members don’t help me when Ihave a problem.
1 2 3
4
5
6 7
9. The flight often does things together (like going out
to dinner) when off duty.
1 2 3
4
5
6 7
10.Suppose you are working in the classroom and your flight instructor leaves the room for a half of an
hour. My flight relaxes and goofs off.
1 2 3
4
5
6 7
11.I would give up a weekend or two in order to trainfor the flight physical training test.
1 2 3
4
5
6 7
12.I feel personally responsible to the flight for mytasks being carried out correctly.
1 2 3
4
5
6 7
13.When I have carried out my tasks correctly, I feelgood about what I have done for the flight.
1 2 3
4
5
6 7
14.I feel that I am part of my flight.1 2 3
4
5
6 7
15.If I had a chance to belong a different flight, Iwould move to that flight.
1 2 3
4
5
6 7
16.My flight gets along better than most other flights.1 2 3
4
5
6 7
17.In my flight, people stick together better than mostflights.
1 2 3
4
5
6 7
18.In my flight, people help one another on the job
better than most other flights.
1 2 3
4
5
6 7
19.I am likely to speak positively about the Air ForceSection 2
We all maintain many different types of relationships for various reasons. This section is used to identify your relationship with other flight members as you perceive them. For each statement below, put a check mark (√) in the box for those statements that apply to certain students. For instance, for those students for whom you value their opinion, put a
√ in the box under that column next to their number. Please refer to the attached roster provided to figure out who each assigned number refers to. Check as many boxes as necessary to identify all relationships specified at the top of each column.
Unique Arbitrary Student Coded Number I value this person’s opinion or advice. I spend time on work-related tasks with this person. I go to this person for help on work-related tasks. I enjoy ‘hanging out’ with this person. I spend time in social-oriented activities with this person (dining out, sports, etc.). I consider this person as a friend. Example √ √ √ 01 02 03 04 05 06 07 08 09 10 11 12 13 14
Biblography
Baldwin, T.T., Bedell, M.D. & Johnson, J.L. (1997). The social fabric of a team-based MBA program: Network effects on student satisfaction and performance. Academyof Management Journal, 40(6): 1369-1397.
Balkundi, P. & Harrison, D. (2006). Ties, leaders and time in team: strong inference about network structure’s effects on team viability and performance. Academy of Management Journal, 49(1), 49-68
Bavelas, A. (1950). Communication patterns in task oriented groups. Journal of the
Acoustical Society ofAmerica, 22, 271–282.
Beal, D.J., Cohen, R.R., Burke, M.J. & McLendon, C.L. (2003). Cohesion and
performance in groups: a meta-analytic clarification of construct relations. Journal of Applied Psychology, 88(6), 989-1004.
Bernthal. P. & Insko, C. (1993). Cohesiveness without groupthink: The interactive effects of social and task cohesion. Group & Organization Management, 18, 66-87
Campbell, D. & Fiske D. (1959). Convergent and discriminant validation by the multitrait-multimethod matrix. Psychological Bulletin, 56(2), 81-105
Carless, S.A. & De Paola, C. (2000). The measurement of cohesion in work teams. Small Group Research, 31(1), 71-88.
Cartwright, D. (1968). The nature of group cohesiveness. In D. Cartwright & A. Zander (Eds.), Group dynamics: Research and theory (3rd ed., pp. 91–109). New York: Harper
& Row.
Degenne, A. & Forse, M. (1999). Introducing Social Networks. London: SAGE
Publications.
Dowd, A. & Paulsen, N., (2006). Combining traditional survey and social network measures of group cohesion: a longitudinal study. Working paper at the University of Queensland, Australia.
Evans, C.R. & Dion, K.L. (1991). Group cohesion and performance: A meta-analysis.
Small Group Research, 22, 175-186.
Festinger, L. (1950). Informal social communication. Psychological Review, 57, 271–
Gully, S.M., Whitney, D.J. & Divine, D.J. (1995). A meta-analysis of cohesion and performance: Effects of level of analysis and task interdependence. Small Group Research, 26, 497-520.
Ibarra, H. (1993). Personal networks of women and minorities in management: a conceptual framework. Academy of Management. 18(1), 56-87
Klein, H. J. & Mulvey, P. W. (1995). Two investigations of the relationships among group goals, goal commitment, cohesion, and performance. Organizational Behavior and Human Decision Processes, 61, 44–53.
Langfred, C.W. (1998). Is group cohesiveness a double-edged sword? An investigation of the effects of cohesiveness on performance. Small Group Research, 29, 124-143.
Lincoln, J. & Miller J. (1979). Work and friendship ties in organizations: a comparative analysis of relational networks. Administrative Science Quarterly, 24, 181-199
MacCoun, R. J. (1996). Sexual orientation and military cohesion: A critical review of the evidence. In G. M. Herek, J. B. Jobe, & R. Carney (Eds.), Out in force: Sexual
orientation and the military. Chicago: University of Chicago Press.
McIntyre, R.M., Strobel, K., Hanner, H., Cunningham, A., & Tedrow, L. (2003). Toward an understanding of team performance and team cohesion over time throughthe lens of time series analysis. United States Army Research Institute for the Behavioral and
Social Sciences.
Mudrack, P. E. (1989). Group cohesiveness and productivity: A closer look. Human Relations, 9, 771–785.
Mullen, B. & Cooper, C. (1994). The relation between group cohesiveness and Performance: An integration. Psychological Bulletin, 115, 210-227.
Podsakoff, P, Organ, D. (1986) Self-reports in organizational research: problems and prospects. Journal of Management, 12(4), 531-544
Oliver, L.W., Harman, J., Hoover, E., Hayes, S.M., & Pandhi, N.A. (1999). A
quantitative integration of the military cohesion literature. Military Psychology, 11(1),
57-83.
Reagans, R. & Zuckerman, E.W. (2001). Networks, diversity, and productivity: The social capital of corporate R&D teams. Organizational Science, 12(4), 502-517.
Schwab, D.P. (2005). Research Methods for Organizational Studies. Lawrence Erlbaum
Scott, J. (2000). Social network analysis: A handbook (Second ed.). London: SAGE
Publications Ltd.
Seashore, S.E. (1954). Group cohesiveness in the industrial work group. Ann Arbor,
Mich.; Institute for Social Research
Sparrowe, R.T., Liden, R.C., Wayne, S.J., & Kraimer, M.L. (2001). Social networks and the performance of individuals and groups. Academy of Management Journal, 44(2):
316-325.
Stogdill, R.M. (1972). Group productivity, drive, and cohesiveness. Organizational Behavior and Human Performance, 8,26–43.
Tuckman, B. (1965). Developmental sequence in small groups. Psychological bulletin, 63, 384-399.
Tziner, A. & Vardi, Y. (1983). Ability as a moderator between cohesiveness and tank crews performance. Journal of Occupational Behavior, 4,137–143.
Wasserman, S. & Faust, K. (1994). Social network analysis: Methods and applications.
Cambridge: Cambridge University Press.
Yang, H. & Tang, J. (2004). Team structure and team performance in IS development: a social network perspective. Information and Management, 41, 335-349.
REPORT DOCUMENTATION PAGE Form Approved OMB No. 074-0188
The public reporting burden for this collection of information is estimated to average 1 hour per response, including the time for reviewing instructions, searching existing data sources, gathering and maintaining the data needed, and completing and reviewing the collection of information. Send comments regarding this burden estimate or any other aspect of the collection of information, including suggestions for reducing this burden to Department of Defense, Washington Headquarters Services, Directorate for Information Operations and Reports (0704-0188), 1215 Jefferson Davis Highway, Suite 1204, Arlington, VA 22202-4302. Respondents should be aware that notwithstanding any other provision of law, no person shall be subject to an penalty for failing to comply with a collection of information if it does not display a currently valid OMB control number.
PLEASE DO NOT RETURN YOUR FORM TO THE ABOVE ADDRESS. 1. REPORT DATE (DD-MM-YYYY)
22-03-2007
2. REPORT TYPE
Master’s Thesis
3. DATES COVERED (From – To)
Sep 2005 – Mar 2007
5a. CONTRACT NUMBER
5b. GRANT NUMBER 4. TITLE AND SUBTITLE
Predicting Group Performance using Cohesion and Social Network Density: A Comparative Analysis
5c. PROGRAM ELEMENT NUMBER
5d. PROJECT NUMBER
5e. TASK NUMBER 6. AUTHOR(S)
Peterson, Frederick, W. S., First Lieutenant, USAF
5f. WORK UNIT NUMBER
7. PERFORMING ORGANIZATION NAMES(S) AND ADDRESS(S)
Air Force Institute of Technology
Graduate School of Engineering and Management (AFIT/EN) 2950 Hobson Way WPAFB OH 45433-7765 8. PERFORMING ORGANIZATION REPORT NUMBER AFIT/GEM//ENV/07-M11 10. SPONSOR/MONITOR’S ACRONYM(S)
9. SPONSORING/MONITORING AGENCY NAME(S) AND ADDRESS(ES)
N/A
11. SPONSOR/MONITOR’S REPORT NUMBER(S) 12. DISTRIBUTION/AVAILABILITY STATEMENT
APPROVED FOR PUBLIC RELEASE; DISTRIBUTION UNLIMITED.
13. SUPPLEMENTARY NOTES
14. ABSTRACT
Group performance has been an important topic as evidenced by an extensive literature review that has supports a positive relationship between group cohesion and performance. Social network researchers have also found similar relationships between cohesion and group performance using social network density as a proxy for cohesion. The traditional cohesion construct is measured using an attitudinal instrument that relies on member perceptions that are aggregated at the group level. The density construct, on the other hand, is based on social network relations which are based on behaviors and actual member interactions and relationships. Considering these differences, although both cohesion measures have been shown to predict group performance, it is important to understand their subtle differences in order for leaders to accurately understand how to influence each. A study of 672 students in 48 groups provided empirical evidence supporting a positive relationship between task cohesion and performance, while also a negative relationship was found for social cohesion and friendship network density relating to performance. Results also indicate a significant relationship between group cohesion and social network density suggesting that social network density could be used as a proxy for group cohesion.
15. SUBJECT TERMS
Social Networks, Group Cohesion, Performance, Group Dynamics
16. SECURITY CLASSIFICATION OF:
19a. NAME OF RESPONSIBLE PERSON
Kent C. Halverson, LtCol, USAF (ENV) REPORT U ABSTRACT U c. THIS PAGE U 17. LIMITATION OF ABSTRACT UU 18. NUMBER OF PAGES
44 19b. TELEPHONE NUMBER (Include area code) (937) 255-6565, ext 4709; e-mail: [email protected]