EFFECTS TO THE VELOCITY AND BOUNDARY LAYER THICKNESS
NORLIZAA BT MOHAMAD
A thesis submitted is fulfillment of the requirements for the award of the degree of Bachelor of Manufacturing Engineering
Faculty of Manufacturing Engineering Universiti Malaysia Pahang
ABSTRACT
Wind tunnel is one of the tools that used in the aerodynamics research to recognize the air flow moving through a solid. It is not only been used in automotive but also in the construction of the building. Develop of the wind tunnel require specific parameters that need to be consider. Parameters such as contraction ratio and diffuser angle plays an important role to obtain a good result to the model. To have a better understanding about thermo fluids, the development of low speed wind tunnel are required. From the subsonic wind tunnel, the study is to determine the best contraction ratio of the flow quality of the air in the exit. The study is conducted by fabricate the low speed wind tunnel and by using Computational Fluids Dynamic (CFD) to obtain the data for different contraction ratio. The varying velocity and the boundary layer thickness between different contraction ratio will be attempted. The selection of the contraction ratio in designing the wind tunnel can affect the fluids flow. As the higher contraction ratio, the higher velocity at the test section can be obtained, reduced power loss and thin thickness of the boundary layer can achieved.
ABSTRAK
Terowong angin adalah satu alat yang digunakan dalam penyelidikan aerodinamik untuk mengenal pasti aliran udara bergerak melalui pepejal.Ia bukan sahaja digunakan dalam automotif tetapi juga dalam pembinaan bangunan.Penghasilan dan pembentukan terowong angin memerlukan parameter yang khusus yang perlu di pertimbangkan.Parameter seperti nisbah pengecutan dan dan sudut pengembangan memainkan peranan penting untuk mendapatkan hasil aliran angin yang baik kepada model.Untuk pemahaman yang lebih baik mengenai termo bendalir,penghasilan terowong angin dengan kelajuan rendah diperlukan.Penyelidikan terowong angin subsonik,adalah untuk menentukan nisbah pengecutan terbaik kualiti aliran udara dari masuk ke keluar.Kajian ini dijalankan dengan mereka terowong angin halaju yang rendah dengan Komputasi Dinamik Bendalir (CFD) untuk mendapatkan data.Halaju yang berbeza-beza dan ketebalan lapisan sempadan antara nisbah pengecutan berbeza dikaji.Pemilihan nisbah pengecutan dalam rekacipta terowong angin boleh menjejaskan aliran bendalir.Semakin tinggi nisbah pengecutan,semakin tinggi halaju angin di tempat ujian,kehilangan tenaga yang semakin berkurang dan ketebalan lapisan sempadan yg nipis boleh dicapai.
TABLE OF CONTENTS PAGE ACKNOWLEDGEMENT ABSTRACT ABSTRAK TABLE OF CONTENTS LIST OF TABLES LIST OF FIGURES LIST OF SYMBOLS LIST OF ABBREVIATION vi vii viii ix xii xiii xv xvi CHAPTER 1 INTRODUCTION
1.1 INTRODUCTION TO WIND TUNNEL
1.2 PROJECT BACKGROUND
1.3 PROBLEM STATEMENT 1.4 PROJECT OBJECTIVES 1.5 SCOPES OF THE PROJECT
1.5.1 Collect and gather the information from handbooks and journal
1.5.2 Design the wind tunnel using CAD
1.5.3 Prepared the material to make wind tunnel 1.5.4 Fabrication of wind tunnel
1.5.5 Experiment and research on contraction ratio
1.6 SIGNIFICANT OF THE RESEARCH 1.7 ARRANGEMENT OF THE THESIS
1.7.1 Chapter 1 1.7.2 Chapter 2 1.7.3 Chapter 3 1.7.4 Chapter 4 1.7.4 Chapter 5 1 2 3 3 4 4 4 4 4 5 5 5 6 6 6 6 6
CHAPTER 2 LITERATURE REVIEW
2.1 INTRODUCTION
2.2 TYPES OF WIND TUNNEL 2.3 SETTLING CHAMBER 2.4 CONTRACTION SECTION 2.5 TEST SECTION
2.6 DIFFUSER
2.7 COMPUTATIONAL FLUID DYNAMICS
7 9 11 14 16 16 18 CHAPTER 3 METHODOLOGY 3.1 INTRODUCTION
3.2 FLOW CHART OF THE PROJECT 3.3 DESIGN OF THE WIND TUNNEL 3.4 FABRICATION OF WIND TUNNEL
3.4.1 Contraction section 3.4.2 Test section 3.4.3 Diffuser 3.4.4 Drive section 3.4.5 Settling chamber 3.4.6 Assembly 3.5 COSMOS FLOXPRESS
3.6 SOLIDWORKS FLOW SIMULATION 3.7 ANALYSIS THE RESULT
19 20 20 22 22 24 26 28 28 29 30 32 34 CHAPTER 4 RESULT AND DISCUSSION
4.1 INTRODUCTION
4.2 RESULT OF EXPERIMENT 4.3 ANALYSIS THE RESULT
4.3.1 Effect of contraction ratio to velocity
35 35 36 36
4.3.2 Comparison boundary layer thickness with different contraction ratio
4.3.3 Comparison between CR 9, CR 12 and CR 15
42 49
CHAPTER 5 CONCLUSION AND FUTURE WORK
5.1 INTRODUCTION 5.2 CONCLUSION
5.3 RECOMMENDATION FOR THE FUTURE RESEARCH 51 51 52 REFERENCES APPENDIX A APPENDIX B 53 55 59
LIST OF TABLES
Table No. Title Page
3.1 Dimension of each part of wind tunnel 22
3.2 Density of air at certain temperature 31
4.1 Result of different contraction ratio affect velocity of air 38 4.2 4.3 4.4 4.5 4.6 4.7 4.8 4.9
The value of KL include of angle
Comparison of KL between sudden changes and gradually changes Contraction ratio = 1 Contraction ratio = 3 Contraction ratio = 6 Contraction ratio = 9 Contraction ratio = 12 Contraction ratio = 15 41 42 46 46 47 47 49 49
LIST OF FIGURES
Figure No. Title Page
2.1 Wind tunnel test 7
2.2 Open loop wind tunnel 9
2.3 Blower tunnel 10
2.4 Suck down tunnel 10
2.5 Closed loop wind tunnel 11
2.6 Types of honeycombs 12
2.7 Settling hamber 13
2.8 Shape of the contraction section 15
3.1 Flow chart of the project 20
3.2 Open loop wind tunnel (design) 21
3.3 Part of wind tunnel 21
3.4 Contraction section 23
3.5 Stick the two boards together so that they stand on one edge 25
3.6 Test section after assemble 25
3.7 Diffuser section 27
3.8 Circular hole on the front blade and the stand 28
3.9 Attach hook to the surface of the part 29
3.10 Complete assembly of wind tunnel 30
3.11 Flow chart for simulation in FloXpress 30
3.12 4.1 4.2
Flow chart for SolidWorks Flow Simulation CR : 1
CR : 3
32 36 37
4.3 4.4 4.5 4.6 4.7 4.8 4.9 4.10 4.11 4.12 4.13 4.14 4.15 CR : 6 CR : 9
Effect of contraction ratio on maximum velocity Contraction section value
Sudden contraction Gradually contraction
Effect of contraction ratio on loss coefficient CR : 1
CR : 3 CR : 6 CR : 9
Boundary thickness against displacement point Boundary thickness against displacement point
37 38 39 39 40 41 42 44 44 45 45 48 50
LIST OF SYMBOLS mm milimiter ᵒ ᵒC Degree Degree celcius kg/m3 V Density Kinematic viscoscity Velocity A KL g hL Ac Cc δ U x Uδ m Area Loss coefficient Standard gravity Loss of head
Cross-sectional area of vena Coefficient of contraction Boundary layer thickness
Free stream velocity in component Length of the distance
Free stream velocity at boundary layer Mass flow rate
LIST OF ABBREVIATIONS
CFD Computational fluid mechanics CR
Re
Contraction ratio Reynolds number
CHAPTER 1
INTRODUCTION
1.1 INTRODUCTION TO WIND TUNNEL
Wind tunnel is a crucial tool in engineering both for model test and research. Wind tunnel widely uses in test the proposed model of the aircraft by aerodynamicists. By using the wind tunnel, the researcher will learn and know how the aircraft will fly. Through the study the wind tunnel, researcher can control the flow conditions which affect forces on the aircraft. Wind tunnel helps the researcher to have a better understanding about aerodynamics principle and improve the performance of the aircraft.
For years, the aerospace and automotive industries have been enhancing designs to lower the overall drag coefficient by streamlining the exterior panels and choosing different materials. Minimizing losses to drag and other external frictional forces, gives the vehicle more power to reach its optimal peak. In other words, reducing certain parameters optimizes the overall vehicle fuel efficiency. The drag coefficient which is a directly proportional constant to drag forces can be reduced by minimizing the frontal area of a body and deflecting airflow away from sudden, sharp or hollow contours.( A.Sunny, S. ,2011).In order to study the this kind of problem, the experiment were carry out by using wind tunnel.
There are two main wind tunnel configurations which is open circuit tunnel and closed circuit tunnel. (Carlone, B. G. ,2008).The open circuit wind tunnel is the simplest and most affordable to build. In these tunnels air is expelled directly into the laboratory and typically reinvested after circulating through the lab, though some tunnels utilize
instead a compressed gas source.(Tatman).Closed circuit tunnels (also called closed return) form a enclosed loop in which exhaust flow is directly returned to the tunnel inlet. These tunnels are usually larger and more difficult to build. They must be carefully designed in order to maximize uniformity in the return flow. These tunnels are powered by axial fan(s) upstream of the test section and sometime include multistage compressors, which are often necessary to create trans- and supersonic air speeds.
1.2 PROJECT BACKGROUND
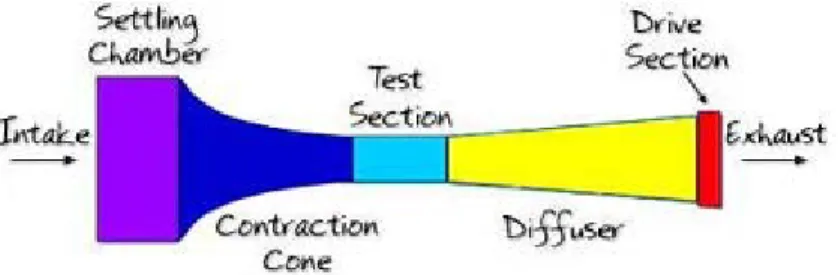
This project is about to design the low speed wind tunnel. It is because its ease and low cost of construction. (Carlone, B. G. ,2008).In order to design the wind tunnel the study of every single section is very important. It is because every part in the wind tunnel will affect the fluid flow and the force to the aircraft or automobiles. The design of wind tunnel is an open circuit. This research is focus on subsonic tunnel which is Mach number <1.0.There is several parts need to be considering which are:
a) Settling chamber-A critical component for the wind tunnel is the settling chamber, most often the placed at the entrance of the contraction cone. (Carlone, B. G. ,2008).It contains the honeycombs and screens used to moderate longitudinal.
b) Contraction Section-The air moves from a wide area into a narrow area. In this section the air velocity are increase and low pressure. The contraction ratio plays important role for this section.
c) Test section-The aircraft/model is mounted here and the air flows around it. The test section should be long enough that flow disturbances resulting from a contraction or screens are sufficiently damped before the reaching the test object. (Tatman)
d) Diffuser- The chambers that slowly expand along their length, allowing fluid pressure to increase and decreasing fluid velocity. This section allow the air spreads out and move slowly.
e) Drive section-The drive section provides the force that causes the air to move through the wind tunnel.
1.3 PROBLEM STATEMENT
Universiti Malaysia Pahang (UMP) refers to Faculty of Manufacturing Engineering,do not have a wind tunnel for a reference to the subject of thermo fluids and research. So that, by having this research and make it real it can be a teaching tool and help the student or researcher to do improvement and expand the usage for the future. By having the research on the open circuit of wind tunnel, it will be easier to manipulate variables since we are designing the tunnel ourselves and it will be a trial and error type of process. From the trial and error, we can learn and applied the thermo fluids that had learned. Besides that,the right parameters should consider in the development of wind tunnel.
1.4 PROJECT OBJECTIVE
There are several objectives of this project which is:
i. To develop a wind tunnel for research and teaching tool for the student especially in subject thermo fluids.
ii. To build and gain the uniformity of flow in wind tunnel at low cost. iii. To study the suitable parameters for the parts of wind tunnel.
1.5 SCOPE OF THE PROJECT The scopes of the project include:
1.5.1 Collect and gather the information from handbooks and journals
The studies are focus on the parameters consideration to design the wind tunnel. From the collect and gather information, the wind tunnel can be designing as good as possible. Collecting data also help in gaining knowledge and better understanding about the wind tunnel in order to achieve objective of this research. 1.5.2 Design the wind tunnel using CAD software
The wind tunnel is design using the Solidworks software based on the specification and the dimension. From the gathering information in design the wind tunnel, the wind tunnel can meet the specification and dimension.
1.5.3 Prepared the material to make wind tunnel
After design the wind tunnel, the material to fabricate are selected. In selecting the material for the fabrication, thetypes of process involve and material properties are takes into account.
1.5.4 Fabrication of wind tunnel
When all the material that needed is prepared the fabrication process of the wind tunnel will takes places. In thisprocess, the process plan prepared in order to make sure the fabrication process run smoothly without any constraint.
1.5.5 Experiment and research on contraction ratio
When the fabrication had been finished, the experiment was conducted to know the significant of the contraction ratio that affects the design of the wind tunnel. The data that obtained through the experiment will be analyzed.
1.5.6 Analysis and interpreting the data
For the analysis data, it will base on the contraction ratio that affects the velocity in the wind tunnel. Besidesthat, flow of the fluids into the contraction section that different CR will be analyzed. By using the FloXpress and Flow Simulation the data that obtained are present in graph. Fromthat, the plotted graph will be analyzed based on the pattern. This result will interpret and come up with a conclusion.
1.6 SIGNIFICANCE OF THE RESEARCH
This research will contribute to the UMP student and lecturer as wind tunnel will be a teaching tool. It will help student to have a better understanding about thermo fluids. Through this project the wind tunnel will be part of research tool. For example, last time the solar car that had competition in Darwin have high drag force that not been examine due to no wind tunnel. So, by having this wind tunnel, the model of the car can be trying and running. So, it helps the researcher to overcome the problem of drag. Wind tunnel also will be part of main tool to be study especially in automotive and aerospace industry in Malaysia.
1.7 ARRANGEMENT OF THE THESIS These thesis are divided into the five chapter.
1.7.1 Chapter 1
This chapter is introduction to the wind tunnel and background of the research. This chapter also includes the problem statement, objectives of the research and scope of the project. Generally, this chapter explains the overview of the research.
1.7.2 Chapter 2
Chapter 2 is about the literature review that focuses on recent studies or previous research. It is also as a guideline for the designing the wind tunnel and the parameters that had been consider by the researcher. From this chapter, it is a reference and in orderto design the open loop wind tunnel.
1.7.3 Chapter 3
Chapter 3 is about methodology. It is a method to conduct the research step by step. For this research, chapter 3 will explains the details about design process, fabrication process and how the simulation takes places in designing the wind tunnel.
1.7.4 Chapter 4
This chapter will discuss the result and analyze the data that had been achieved through the experiment and research. This chapter includes the graph and data for analysis the effect of the contraction ratio to the wind tunnel.
1.7.5 Chapter 5
Chapter 5 is a conclusion for the whole research that had been conducted. This chapter will summarize the entire result and project objective. It also includes the recommendations for this project research.
CHAPTER 2
LITERATURE REVIEW
2.1 INTRODUCTION
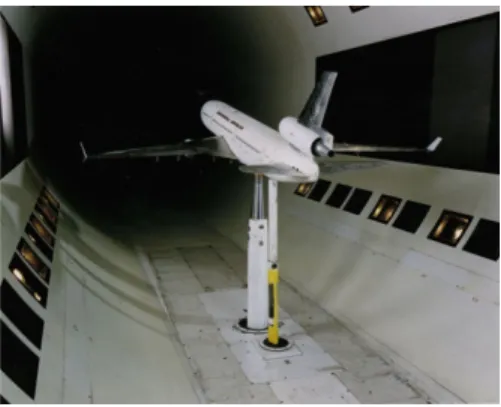
Wind tunnel is a devices and tool in the engineering which is a large tubes and air moving inside. Wind tunnel mostly used by aerodynamicists for aerodynamics test. It is because by using the wind tunnel, the researcher will know and learns how the aircraft will fly. From the Figure 2.1 it shown that, the air craft model is placed in the wind tunnel for the test.
Figure 2.1: Wind Tunnel Test Source: NASA (1996)
Through the study of wind tunnel, researcher can control the flow conditions which affect forces on the aircraft. Wind tunnel helps the researcher to have a better understanding about aerodynamics principle and improve the performance of the aircraft.
The wind tunnel can be classified to the four groups that can be differentiate by the Mach number which is:
i) Subsonic or low-speed wind-tunnels (M<1)
The Mach number is less than 1 and generally comes out to be around 0.4 for this case.The flow speed of this wind tunnel reach maximum can be 135m/s. This type of wind tunnel is most cost effective due to the ease of the design and low wind speed. (Agrawal, 2008)
ii) Transonic wind-tunnels (M=1)
Mach number is equal to 1 and maximum velocity of the transonic wind tunnels can reach up to speed of sound 340m/s. This type of the wind tunnels commonly use in aircraft industry as most operate around of this speed. (Agrawal, 2008)
iii) Supersonic wind-tunnels (1<M<3)
The Mach number is between 1 to 3.However the velocity of air in the test section can be up to the Mach 5.This is proficient using convergent - divergent nozzles. This wind tunnel requires power that very high. (Agrawal, 2008)
iv) Hypersonic wind-tunnels (M>5)
Wind velocity in test section of such type of wind tunnels can measure between Mach 5 and Mach 15. This is also achieved using convergent - divergent nozzles. (Agrawal, 2008)
The main parts of the wind tunnels are settling chamber, contraction section, test section and diffuser. The most important section in the wind tunnel is the test section where the models are placed.
2.2 TYPES OF WIND TUNNEL
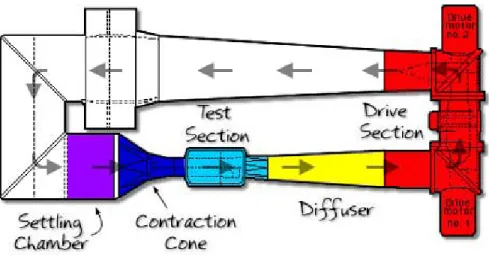
There are two main wind tunnel configurations which is open circuit tunnel and closed circuit tunnel. There is an intake and exhaust. In open loop circuit, the power that
needed to drive the wind tunnel is high because of the loss of energy in the out-flowing air. (Bj¨orn Lindgren & Arne V. Johansson, October 2002).Even though the open circuit wind tunnel is the simplest and low cost to build, they are relatively immune to temperature fluctuations and large disturbances in return flow, provided that the volume of the laboratory is much greater than that of the tunnel. (Tatman)
Figure 2.2: Open Loop Wind tunnel Source: Ben Goldberg & Tom Carlone ( 2008)
Bradshaw and Mehta (2003) stated that the open circuit can be divided into two which is suckdown and blowers tunnels which can be differentiate by the location of the fan.
i) Blower tunnels: The fan for the blower tunnels is situated at the inlet, so it is
more flexible and the test section can be easily interchanged or modified with seriously distracting flow. The exit of the diffuser can frequently be completely omitted to allow easier contact to test samples and instruments, though the omission often results in a noticeable power loss.(Tatman)
ii) Suck down tunnels: Inlet is open to the atmosphere. It is less problematic
because these tunnels do not pass through the fan before entering the test section even though it is more susceptible to low frequency unsteadiness in the return flow than blowers.(Tatman)
Figure 2.3: Blower tunnel
Source: The Journal of Experimental Biology 200, 1441–1449 (1997)
Figure 2.4: Suck down tunnels
Source: The Journal of Experimental Biology 200, 1441–1449 (1997) Closed circuit wind tunnels recirculate the air and thus normally need less power to achieve a given flow speed. As name implies, closed loop circuit tunnels form an enclosed loop in which exhaust flow is directly returned to the tunnel inlet.
Figure 2.5: Closed Loop Wind tunnel Source: Ben Goldberg & Tom Carlone. (2008)
Based on research by the Tatman, these tunnels are usually large and more difficult to build. These tunnel need to be designed carefully in order to maximize the uniformity of the return flow. The tunnels are power-driven by the axial fan(s) upstream of the test section and sometimes include multistage compressors, which are often used to create transonic and supersonic wind tunnels. The chances of dirt entering the system also very low compare to open loop wind tunnels. The flow also is more uniform even though is type of tunnels is more costly than open type wind tunnels. (Agrawal, 2008)
2.3 SETTLING CHAMBER
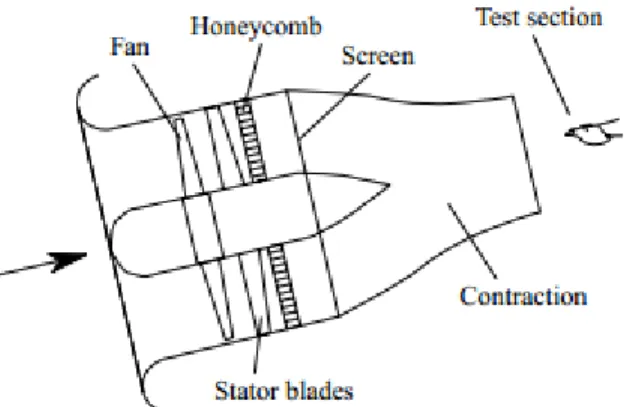
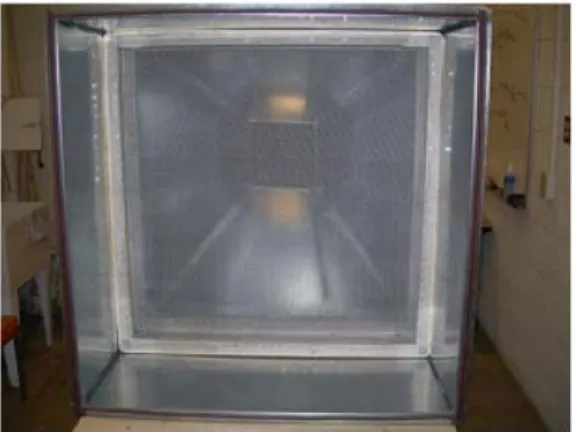
Settling chamber is a critical component in at the entrance of the contraction for the open loop wind tunnel and mostly this part control the air inlet flow to the contraction section. Research by the Tatman found out the settling chamber contains the honeycombs and screens that used to moderate the longitudinal variations in the flow. The settling chamber is located between the fan or wide angle diffuser and the contraction. Settling chamber is often rectangular or square cross section and it serves to straighten and smooth the flow down-stream of the fourth corner. (Slezinger, 1966).Uneven turbulent flow can cause the unpredictable forces to be experienced in the test section. The less turbulent, the better the wind tunnel simulate the actual flying condition. (Carlone, 2008)
a) Honeycombs
i. The mains functions of the honeycombs are to reduce the non-uniformities
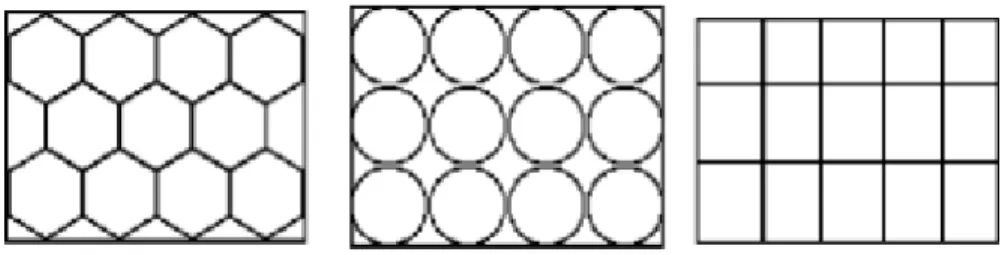
flow. The honeycomb can be made of hexagonal, circular or square cells. Not much of this aspect has been thought trough in the design process yet. However, hexagonal cell are more preferred compare to the other shape due to reduce the turbulence air (Carlone, 2008) .
ii. Research had found that, for optimum benefits, honeycombs should be 6-8
diameters thick and cell size should be on the order of about 150 cells per settling chamber diameter.(Tatman)
Figure 2.6: Types of honeycombs Source: Rafiuddin (2008) b) Screens
i. Screens are usually located just downstream of the honeycomb and
sometime at the inlet section. The function of screens is to produce a smooth airflow. Based on the research by Tatman, screens create a static pressure drop and serve to reduce boundary layer size and increase flow uniformity. A screen is characterized by its open area ratio, which is defined in the equation below :
2 1 − = L d β (2.1) Where d = wire diameter L = length of the screen.
ii. At least one screen in the settling chamber (ideally the last) should have an
open-area ratio of ß<0.57, as screens with lower ratios are known to produced non uniformities in the flow. This is presumable due to the formation of small vortices created by the random coalescence of tiny jets emitted from the screen.
iii. The open ratio of the screen and the density, kinematic viscosity and mean
velocity of the fluid effect the pressure drop across a screen.
Figure 2.7: Settling chamber with screens Source: Tatman