ImaNote: a Web-Based Multi-User Image Map
Viewing and Annotation Tool
________________________________________________________________________ Abstract
Categories and Subject Descriptors: H 3.5 [Information Storage and Retrieval] – Online Information Services – Web-based services; H 5.3 [Information Interfaces and Representation] – Group and Organization Interfaces – Computer supported cooperative work; D 2.2 [Software Engineering] – Design Tools and Technique – User Interfaces
General Terms: Design, Interaction
Additional Key Words and Phrases: Annotation, Map, Interaction Design, Web Application, Community
________________________________________________________________________
1.
ImaNote (Image Map Annotation Notebook) is a web-based multi-user tool that allows cultural heritage professionals to display high-resolution images and to link and add personal annotations as well as multimedia resources to them. The augmented images can be navigated by using a simple zoomable user interface that includes an overview. Though initially targeted to the cultural heritage sector, the tool allows any user to save and share his/her annotations and memoranda to any image, or compilation of images.
To support the community-centered usage, it is possible to use RSS (Really Simple Syndication) to keep track of the annotations added to the image and to make links on user’s own blog, web site or email that permanently points to the annotations on the image. It is also possible to create user groups and easily share annotations between group members.
1.1.
Among the objectives of the project have been to create an accessible digital media environment that includes tools for storing, classifying, and searching cultural heritage materials and for aggregating them into meaningful wholes from parts. We have sought to make use of interactive technology to facilitate non-linear discursive encounters and support a decentralization of the author’s role. Annotation tools, such as ImaNote, can
potentially extend personal desktops into collaborative environments therefore augmenting the capabilities of personal information spaces as communication and exchange channels. Thus the emphasis on social software in which many authors with diverse points of view can contribute to one application.
1.2.
From early on the intended target audience was that one of heritage professionals. The idea has been that “image map notebooks” or annotated atlases of images could be used by these professionals as part of the plans for design of an exhibition; as part of personal research into items in a collection; and as part of the documentation regarding the public’s reaction to an ongoing exhibition.
From this perspective, user interface design and web-based cartography are the two most important related design contexts for ImaNote. With respect to cartography, the definition of the genre has been very broad throughout the research and development. Developing ImaNote as a user interface emerged naturally and as part of the general transition into Web 2.0 applications. Here the idea was to gather together and link diverse sorts of media into one repository, and to enable the sharing information that is of a visual (and possibly auditory) nature with other community members.
1.2.1.
The work of You et al. on the usability of web map zoom and pan functions serves as a starting point when considering the low-level properties of user interaction in this context [You et al. 2007]. Zooming and panning are fundamental in numerous map-related tasks, coupled with orientation, which was not included in their study.
Hornbæk et al. studied the effects of an overview map on user performance and found out that while the overview did not offer better navigation speed the user satisfaction was increased nonetheless. The importance of map design and personal preferences became apparent as well. [Hornbæk et al. 2002] Finally we would like to mention the work of Furnas and Bederson, which provides an interesting take on the representation and analysis of zoom levels and panning in the form of space-scale diagrams [Furnas & Bederson 1995].
Google Maps is a popular web-based world map providing both satellite images and traditional maps. The freely available data as well as the Google Maps API (Application Programming Interface) have given rise to a wide variety of location-based web applications with annotation capabilities. These applications often combine data from multiple sources and go with the name “Google mashups” [Ajmani 2007]. Two interesting examples of such mashups are PlaceOpedia (http://www.placeopedia.com/), which connects Wikipedia articles to their locations, and The Historical Marker Database, which uses Google Maps to display the locations of historical events.
1.2.2.
The practice of annotating is a common activity that a person does for different reasons, for example learning, recalling, thinking, understanding, joining ideas, and so on. A number of studies have been done in relation to the way people annotate when they are writing and reading on paper materials [Marshall 1997; Marshall 1998; Ruvane, 2007]. Some other research has focused its attention on the different web-based
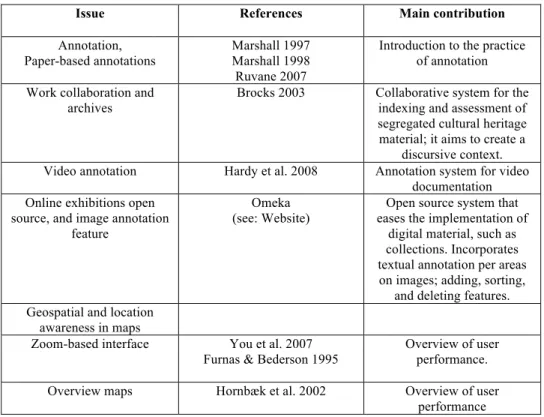
annotation tools proliferated by the hypertext model. The branches of this type of digital-annotation tools are wide-ranging, and it is possible to find them either, as an open access tool "open for everybody" or a private system used only by members of a specific community. Most of them have a broad combination of features (e.g., highlighting text, posting sticky notes, bookmarking), and also allow embedding diverse types of media (e.g., images, video). A literature overview of annotation-related papers and their contributions is provided in Table I.
Their adaptations by a single user or communities of users are as well diverse; in many cases, their use not only depends on the technology and design of the tool, but also on the possibilities of assistance that the tool affords to their activities. Therefore, it is possible to see digital annotations tools for example used for: (a) assisting work-collaboration, (b) promoting social interactions and opinion-sharing, (c) tagging and describing photographs, (d) assisting teaching and learning, (e) mapping geographical places and location awareness; this is just to mention a few general activities. In contrast to other areas of study, within the cultural heritage domain the implementation of custom made digital annotation tools designed to assist context annotation is not extensively research. The following are examples of digital annotation systems that were designed having in mind the cultural heritage domain:
• Mattotea (http://www.hpc.jcu.edu.au/projects/mattotea) is a collaborative web-based video repository system with annotation feature developed by the DART Project (dataset acquisition, accessibility & annotation, e-research technology) funded by the Australian Commonwealth Government’s Department of Education, Science and Training. In 2005, the James Cook University in Australia used Mattotea tool in a case study; the project aimed to preserve the Aboriginal cultural heritage by producing video with the aboriginal community of Gugu Badhun, located on the Valley of Lagoons, north Queensland, Australia. It also planned to produce teaching resources using the annotation feature as a way to add extra information about the videos [Hardy et al. 2008].
• Collate, Collaboratory for Annotation, Indexing and Retrieval of Digitized Historical Archive Material (http://www.collate.de/) was a three years European founded project within the 'Digital Heritage and Cultural Content' activities that ended in 2003. It was designed to document cultural heritage assets happen to be distributed among several archives. The tool allowed researchers and communities of experts the indexing and retrieval of digitized documents, as well as to produce annotations for creating discursive context about them. Collate was tested using material from the heritage of European film making of the 20’s and 30’s. It documented 18,000 digitized historical documents, films and photographs from the national archives of Germany, Austria and the Czech Republic. • Omeka (http://omeka.org/) is a web-based collection-publishing platform developed by the Center of New Media at George Mason University and the Institute of Museum and Library Services since 2007. It aims to bring Web 2.0 solutions to cultural heritage professionals and academics, in order to facilitate the creation of digital publications resources, such as interactive exhibitions. The platform delivers a set of templates that can be modified due to its open source characteristic. In 2009, Omeka incorporated an Image Annotation plugin that allows the user to attach annotations to any image; it has searching, sorting, and deleting features for administrators and an image annotation gallery for item page.
Table I. Literature review concerning the research field related to digital-annotation tools and zoom-based interfaces:
Issue References Main contribution
Annotation,
Paper-based annotations Marshall 1997 Marshall 1998 Ruvane 2007
Introduction to the practice of annotation Work collaboration and
archives Brocks 2003 Collaborative system for the indexing and assessment of segregated cultural heritage material; it aims to create a
discursive context. Video annotation Hardy et al. 2008 Annotation system for video
documentation Online exhibitions open
source, and image annotation feature
Omeka
(see: Website) eases the implementation of Open source system that digital material, such as collections. Incorporates textual annotation per areas on images; adding, sorting,
and deleting features. Geospatial and location
awareness in maps
Zoom-based interface You et al. 2007 Furnas & Bederson 1995
Overview of user performance.
Overview maps Hornbæk et al. 2002 Overview of user
performance
2.
The usability goals were to make the navigation easy to understand, and to make it easy to find details of special interest. With these objectives in mind, the interface design aimed to enhance the experience of perusing through the image by giving the viewer an extreme close up view of the details, providing the feeling of touching the image and creating the feeling of being in front of an augmented version of the image.
2.1.
The main interface consists of an overview image, a main image, navigational controls for zooming, and additional controls related to annotating the image. The aim was to make the main interface scale well to different browser window sizes to improve the accessibility of the software.
2.1.1.
Image display area displays the actual image along with the annotations related to the currently visible area. Each visible annotation consists of a black and a white rectangle, to ensure that they can be easily spotted on all kinds of images. When the cursor is positioned on top of an annotation, the annotation's EPI (Electronic Post-It note) appears next to it, in accordance to the details-on-demand principle of information visualization [Shneiderman 1996]. It is also possible to click and drag the annotations to a different position.
Next to the image display area is an overview area that displays the whole image as a small version, world-in miniature. On top of the overview image there is a rectangle that designates the area currently visible in the larger image display area. While according to Hornbæk there was no apparent speedup with world-in-miniature the overall user satisfaction was greater [Hornbæk 2002].
The image can be navigated by zooming and panning. Zooming is achieved via two simple HTML links, labeled + and – for zooming in and out—a metaphor commonly found in user interfaces. It is possible to zoom in as close as 1:1, and zoom out arbitrarily far, using premade magnification steps or scale levels. You et al. call this mode of zooming original center zoom design [You et al. 2007]. Zoom-in by marquee method is another powerful approach, but was discarded due to its interference with the EPIs.
Panning the image can be done in two ways. The user can either click on a spot in the overview image which results in the main image being centered on the clicked location re-centering or he/she can simply click on the main image and move the cursor while holding down the mouse button (moving by dragging). The third approach mentioned by You et al., panning buttons, was omitted due to its laborious nature.
2.1.2.
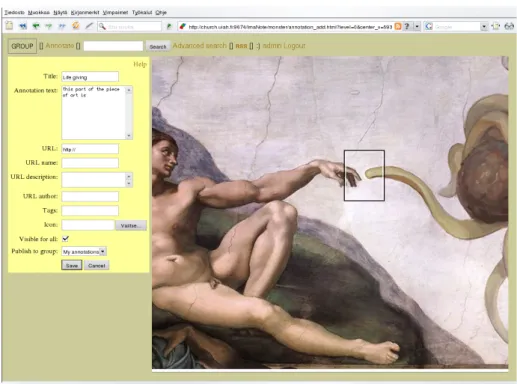
The Annotate function is used to create the EPIs that are one of the main features of ImaNote. After the user has chosen to create a new annotation, a new movable note will appear on the image and the user can fill in details for the note’s EPI (see Figure 1). An EPI contains the following information: The Title which is a description of the annotation used for identification and recall, and the Annotation text which lets the users describe the image, or section of it, in the annotation. The Annotation text can be a summary about key aspects pertaining the image and the resource that are being brought together through the annotation. It can also contain an explanation about why the particular resource is being linked to the image.
Figure 1: A screen shot showing the EPI creation process
A URL field lets the user to link to an external file or site, allowing for example the use of various media types such as video clips to enrich the user experience. In the URL description field, a textual description can be added. The name of the author of the resource located via the URL given above, if available, can also be entered in the URL author field.
The Tag field provides for a way to label the annotations with keywords so they are easier to sort and search afterwards. It is also possible to join multiple words to form one tag using double quotes (e.g. "Karelian Isthmus"). In the Internet, collaboratively generated keywords and tags are also referred to as folksonomies [Mathes 2004]. To further ease recognition and sorting annotations, users can utilize the icon field to insert an icon or image into the annotation.
2.1.3.
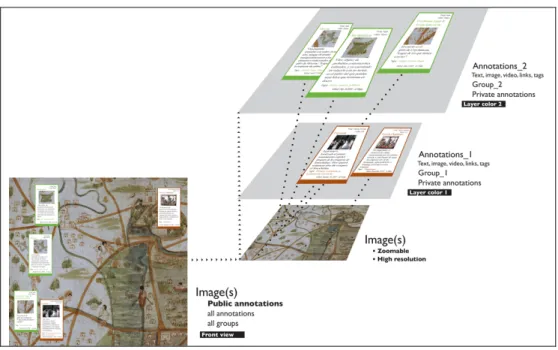
The group function displays the groups that the current user belongs to. It enables the user to select whether to display public annotations or the annotations created by the members of a particular group. Conceptually the annotations made by different groups can be thought of as layers on top of the image (see Figure 2).
Figure 2: ImaNote layer structure for annotations and groups. Project: The Digital Facsimile of Map of Mexico 1550
If a user has previously created or been given an user account, he/she can log in using his/her user name and password. After logging in, users see their own annotations emphasized on the image and they can create new ones, as well as edit their existing annotations. There are four levels of users with varying rights to produce and edit the content, as described in Table II.
Table II. Task list for user group features in ImaNote
TASK Administrator / Manager Group leader Group member Public Adding images to ImaNote site
•
Authorizing group•
•
Creating user groups•
Adding icons to annotations•
•
•
Annotating maps/images•
•
•
Publishing annotations / Private, Group, or•
•
•
Public Publishing Public annotations
•
Sharing annotations with selected Pack members•
•
Sharing annotations with Group members•
Sharing annotations with selected Group members•
Can get list of all notes of all Groups as well
as Public
•
Can get list of all notes of their Group and Public
•
Can view the
map/image
•
2.1.4.
It is possible to search for annotations by simply listing words that the results must contain. However, if more specific searching is needed, it is possible to use advanced search and specify that certain parts of the annotation (title, main text, author etc.) must match the given search conditions. Search result is a list of EPIs and by clicking on a specific EPI the image will be centered at its location so that users can easily locate the results on the image.
2.2.
All management and configuration of ImaNote, such as adding new images, adding new users and changing groups is done through a series of simple HTML forms, which are divided by category (image management, user management, etc.). Some of these forms require that the user has logged in as Zope administrator (see technical implementation below), but for example the form for adding users can be set to work without authentication, if the creation of new user accounts doesn't need to be confirmed.
3.
The technical implementation ImaNote follows the common client-server model. The server side components are written in Python and implemented as a Zope product. Zope is an open source application server that runs on almost all operating systems (GNU/Linux, MacOS X, *BSD, Microsoft Windows etc.), and therefore ImaNote can be installed on any of these platforms. The client (browser) side of ImaNote heavily uses javascript to enhance the user experience, but even without it the basic interface is usable, albeit clumsy. If the client doesn't support javascript, a simpler version of the interface is provided, and the image is created using a standard HTML image map. With javascript enabled the full interface works with most modern browsers, including Firefox, Internet Explorer and Opera.
3.1.
RSS (Really Simple Syndication) is a web feed format used generally to publish frequently updated content. In ImaNote each image provides an RSS feed that contains at most ten annotations that have recently been edited or created. Each feed entry contains the corresponding annotation’s most important details (author, title, description, etc.) and a URL pointing to the location of the annotation on the image. This way users can easily track latest changes, as they cannot only see what has changed, but where it has happened as well.
3.2.
Because there might be multiple users looking at the image simultaneously, loading the whole image and zooming it would impose hard CPU load on the server if done on the fly. When a new image is first added to ImaNote, several zoom levels of the original image are created and each his split into smaller 128 by 128 pixel images which are then stored individually. This take sup more space, but reduces server CPU load when users are browsing the image as only those 128 by 128 blocks of the specific zoom level are loaded. Determining the parts that need to be loaded is done on the client side using javascript. If javascript is not used the image is composited on the server side.
ImaNote can handle any image that fits into the main memory of the server. However, adding a new large image to the system may require a significant amount of time because of the heavy processing. After processing an image its size doesn't have almost any effect on the overall performance, as the amount of 128 by 128 images needed to compose an image depends mainly on the size of the user's browser window.
4.
ImaNote evolved as a response to the needs of two research initiatives of the Systems of Representation group at the Media Lab of University of Art and Design Helsinki, namely the Map of Mexico 1550 and Exploring Carta Marina Cultural Heritage Forum. Among the key objectives of these projects was the dissemination of cultural heritage knowledge via the use of digitally born artifacts. In addition two other case studies namely, Conversational Map and The Secret Life of Objects have enabled us to test the software from the point of view of a participatory platform. The results from these all these projects has served as real world test cases for ImaNote and helped to develop its concepts and interface further.
4.1.
In the beginning, during the years 2002–2003, the tool's functionality revolved around the necessity to display a version of the digital facsimile of the Map of Mexico 1550 at exhibition venues, such as the Aztecs exhibition held in the Royal Art Academy gallery in London, UK. The facsimile used in this exhibition was a high fidelity two-dimensional digital replica created from a subset of the data gathered for the project. It was displayed as a stand-alone interactive installation with a touch screen. The original prototype, not yet called ImaNote, was programmed in C++ and OpenGL, which tied it to a specific platform and didn't allow for easy sharing of content.
At this time, the interaction design was built around the metaphor of navigation of information space via multiple levels of magnification. This was implemented through an overview zoomable user interface. Our work at this point was informed by developments of the online map collections of the American Memory project at the Library of Congress in Washington D.C. A key difference, however, was in our choice to develop open source software that is freely available and does not require the use of special plugins.
Usability tests were conducted in March 2003 when the digital facsimile of the Map of Mexico 1550 was installed in the Museum of Cultures in Helsinki. During four days we carried on interviews and observed user interaction with especially invited guests, as well as normal museum visitors. Differentiated set of tasks and questions were prepared for each of these groups. Some of the people invited were experts in anthropology, history and education. The tests and their results are discussed in detail in a separate report [Salgado & Díaz-Kommonen 2003].
4.2.
Carta Marina by Olaus Magnus is the first scientific map of the Nordic countries. There are two known extant copies of the artifact. One is in the collections of the Hof- und Staatsbibliothek in Munich and the other was bought by Uppsala University Library in 1962 from Switzerland and is among the items on display in the Library’s museum [Lindgren]. Between the years 2003 and 2004, the tool was designed and re-engineered for use in displaying the newly created digital facsimile, Digital Carta Marina, via the WWW (Figure 3). This facsimile is based on the Uppsala University Library’s museum version.
The result of these efforts was DisplayMap tool, an early version of ImaNote. This work was done as part of Communities of Interest to Promote the Heritage of European Regions (CIPHER), a research and development project in the area of cultural heritage funded by the European Union IST 5th framework. During these developments, a class of grade 6 students and their teacher used and tested the tool as part of their educational activities in areas such as art education, geography, history, and language writing skills.
Figure 3: A screenshot showing part of Digital Carta Marina loaded in ImaNote.
Work on creating an video anthology of Narratives and Legends of the historic center of Mexico City during the year 2005 brought the need to further improve the DisplayMap tool. As a result the tool was further developed into ImaNote, a generalized image annotation tool.
4.3.
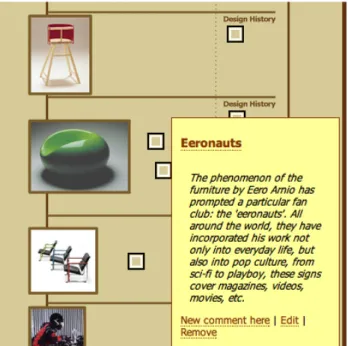
“Conversational Map” (Keskustelukartta) and “The Secret Life of Objects” (Esineiden Salatut Elämät) (see Figure 4) were additional cases in which ImaNote was tested as part of cultural heritage initiatives. In these projects visitors' comments were gathered and displayed in the museum exhibition and online using ImaNote. In both cases, a designer created a compiled image following the floor plant of the building and layout of the exhibition–a map–that visitors could navigate and annotate. The map concept was chosen to identify and annotate the objects exhibited. The objects were points for discussion; visitors added their comments and, with them, a rectangle or square to the map. Thus, the conversation had many threads, all based on the objects exhibited [Salgado et al. 2009a; Salgado et al. 2009b].
“Conversational Map” was exhibited for four days in November 2005 as part of the “Young Artists' Biennale: Small Heaven in Kunsthall.” During those days, a number of Biennale-related events and workshops were held at the museum. The map was placed in the exhibition without comments previously added, and a design researcher was there almost the whole time that the stand was open. The participative piece was presented as a digital guestbook where visitors could leave comments. The presence of the design researcher who told visitors about the project was key to encouraging participation.
Forty-four comments were collected, all of them from casual visitors to the museum, except one from a museum staff member. [Salgado & Díaz-Kommonen 2006]
“The Secret Life of Objects, An Interactive Map of Finnish Design” was an exhibition at the Design Museum Helsinki. A stand displaying the map was part of this temporary exhibition (March 18th to June 1st, 2008) based on the museum’s permanent collection. At the opening, the map contained pre-prepared materials (videos, pictures, music, poems, text comments, etc.) collected at workshops and over the course of a weekend when a prototype was tested. There were also texts by the museum’s education team that added historical context to the design objects. Co-designing this exhibition and the workshops with the museum's education team was a means to develop this prepared material and to influence digital comments left by casual visitors [Salgado et al. 2008]. Nobody encouraged the visitors to participate during the exhibition, and the stand itself was not supervised. Nonetheless, about one hundred comments were collected through the stand. These comments were printed during the course of the exhibition and displayed near the objects being discussed. Staff members, including guards and guides, also left comments on the participatory piece, and used it as part of the exhibition’s guided tours. The comments gathered were of a wide variety in terms of the tone, content, and topics that they presented. This is an example of a comment left by a visitor in the interactive map near an art object, “Spider” in the exhibition in Design Museum Helsinki:
Spiders are scary. Spiders give me the creeps but they also fascinate me…so strange that I fear them but at the same time I want to look at them closely… I guess fear and admiration go hand in hand?!
4.4.
Currently, there is a new and active line of investigation on the digital facsimile of the Map of Mexico 1550. This line of research focuses on the use of the ImaNote tool in the by communities of researchers.
The Map of Mexico is a painted artifact that shows two distinctive cultures and the way they represent images: “European-Renaissance/map-landscape” and “Mesoamerican Toponymy-Signs” [León-Portilla & Aguilera 1986]. Since ImaNote allows creating different layers of information, a group called “Signs” was formed to annotate descriptive texts of the approximate 173 toponymy signs that are depicted on the map. The first annotations created on the layer of the “Signs” group have been made using as source the work published by Miguel León-Portilla and Carmen Aguilera in their book “Mapa de México-Tenochtitlan y sus contornos hacia 1550”. Following the book’s guidelines, these annotations are divided into four big groups according to the classification provided by them in their study: (1) Mountains and Hills, (2) Rivers and Tributaries, (3) Villages, (4) Places.
The project “Digital-Signs of the Map of Mexico” aims to support scholars interested on Mesoamerican culture and scholarship of toponymy signs. Within the domain of cultural heritage the topic can be of interest to, for example, epigraphers, historians, anthropologists, and curators that could use the annotations for comparing the analysis and graphical structures of the signs to other signs represented on separated maps, codex, and Colonial manuscripts. The tool also allows the members of these communities to add extra layers of information regarding the signs, in order to get an in-depth analysis of the topic.
5.
ImaNote can support any kind of image, which makes it suitable for multiple purposes involving visual annotation, such as describing different parts of a piece of art, or augmenting a map with a layer of detailed information. According to the feedback gathered in exhibitions and throughout the work in the projects, it is of interest to the general public, and can be accessed by visitors without instructions or other kind of additional support. The interface has been kept simple and easy to access using existing web technologies. However, it needs further development to work with devices having extremely small screen sizes, such as mobile phones and PDAs.
The tool has been successfully used in several large international exhibition venues, such as the Map of Mexico 1550 installation in the Beta Lounge Helsinki exhibition in Ars Electronica 2006, and in the Museum of the Future pavilion at the Universal Forum of Cultures held in Monterrey Mexico in the autumn of 2007. Our current and future efforts include further development of the tool in the context of digital tools and social media practices.
REFERENCES
AJMANI,V. 2007. Google Maps Mashups. Wrox Press, Birmingham, U.K.
DÍAZ-KOMMONEN,L., AND SALGADO,M. 2003. Interface Design and Usability in the Digital Facsimile of Map of Mexico 1550. In Discovering New Media, University of Art and Design Helsinki Working Papers, 336– 343.
FURNAS,G.W., AND BEDERSON B.1995. Understanding Multiscale Interfaces. In Proceedings of CHI 95, 234– 241.
HORNBÆK,K.,BEDERSON,B., AND PLAISANT,C. 2002. National Patterns and Usability of Zoomable User Interfaces with and without an Overview. In ACM Transactions on Computer-Human Interaction, 4(9), 362–389.
LEÓN-PORTILLA,M., AND AGUILERA,C.1986. Mapa de México y sus contornos hacia 1550. Mexico DF, Celanese Mexicana.
LINDGREN, MARGARETA, 2003. Carta Marina, Map from 1539 created by Olaus Magnus,
HTTP://cipher.uiah.fi/forum/materials/carta_marina?lang=en (Accessed on Nov. 20, 2009.)
MARSHALL,C.C. 1997. Annotation: From Paper Books to the Digital Library. In Proceedings of the Second ACM International Conference on Digital Libraries, Philadelphia, 131–140.
MARSHALL, C.C. 1998. Toward an Ecology of Hypertext Annotation. In Proceedings of the Ninth ACM Conference on Hypertext and Hypermedia: Links, Objects, Time and Space-Structure in Hypermedia Systems, Pittsburgh, 40–49.
MATHES,A. 2004. Folksonomies—Cooperative Classification and Communication through Shared Meta-Data (http://www.adammathes.com/academic/computer-mediated-communication/folksonomies.html.)
RUVANE,M.R. 2007. Defining Annotations: A Visual (Re)Interpretation. In Proceedings of the American Society for Information Science and Technology, 43(1), 1–5.
SALGADO,M., AND DÍAZ-KOMMONEN,L. 2006. Visitor’s Voices. In Museums and the Web 2006: Proceedings, Albuquerque, USA.
SALGADO,M.,SAVOLAINEN,J.,SVINHUFVUD,L., BOTERO, A.,KRAFFT,M.,KAPANEN,H.,DESOUSA, D., EEROLA,E.,LOUHELAINEN,A., AND VAKKARI,S.2008. Co-designing Participatory Practices around a Design Museum Exhibition. In Proceedings of the 6th International Conference of Design History and
Design Studies (ICDHS), Osaka, 106–109.
SALGADO,M.,JAUHIAINEN,T., AND DÍAZ,L. 2009a. Re-thinking an Annotation Tool for Museum Community-Created Content. Nordic Design Research Conference (Nordes), Oslo.
SALGADO,M.,SAAD-SULONEN,J., AND DÍAZ,L. 2009b. Using On-line Maps for Community-Generated Content in Museums. In Museums and the Web 2009: Proceedings, Toronto.
SHNEIDERMAN,B. 1996. The Eyes Have It: a Task by Data Type Taxonomy for Information Visualizations. In
Proceedings of the IEEE Symposium on Visual Languages, Washington, 336–343.
YOU, M.,CHEN C.-W., LIU, H., AND LIN,H. 2007. A Usability Evaluation of Web Map Zoom and Pan Functions. In International Journal of Design, 1, 15–25.