Social context decouples the relationship between a sexual ornament and
testosterone levels in a male wild bird
Pablo Vergara
a,⁎
,1, Jesús Martínez-Padilla
a,b,1,2 aUniversity of Aberdeen, School of Biological Sciences, Tillydrone Avenue, Aberdeen AB24 2TZ, UK
bDepartment of Evolutionary Ecology, Museo Nacional de Ciencias Naturales, CSIC, José Gutiérrez Abascal 2, 28006. Madrid, Spain
a b s t r a c t
a r t i c l e i n f o
Article history: Received 9 April 2012 Revised 16 July 2012 Accepted 18 July 2012 Available online 27 July 2012 Keywords:Dominance
Lagopus lagopus scoticus Sexual selection Social context
In order to maximisefitness individuals should adjust their level of signalling according to their surrounding social environment. However,field experiments showing such adjustment of current signalling associated to changes in social context are lacking. Here, we manipulated levels of male aggressive- and dominance-related displays in a wild bird in our treated area by increasing testosterone levels using implants in a subset of males. We then compared the expression of sexual signals (i.e. comb size) between non-treated red grouseLagopus lagopus scoticusmales from control and treatment areas. We further explored the potential endocrinological mechanism linking social environment and signal expression by analysing testosterone levels in all males. Our treatment successfully increased overall aggressive- and dominance-related behaviours in the treatment area. Furthermore, testosterone-implanted birds increased their comb size as repeatedly shown in previous studies in male red grouse. Interestingly, untreated males living in the treatment area decreased their comb size, whilst increasing testosterone levels. Since comb size is a signal of dominance, untreated males from the treatment area may have perceived themselves as subordinate individuals and decreased their signalling levels to avoid con-frontations with testosterone-treated, dominant individuals. In conclusion, ourfindings show that social context has the potential to regulate sexual signalling and testosterone levels. Our results highlight the role of social con-text when exploring the link between testosterone and behaviour, as it may reverse the relationship between both traits. Our results suggest that social context affects signalling and testosterone independently.
© 2012 Elsevier Inc. All rights reserved.
Introduction
In animal communication, signals can be defined as phenotypic traits produced by the signaller that have evolved because they change the be-haviour of receivers in ways that benefit the signaller (Maynard Smith and Harper, 2003). The presence and quality of receivers changes over time and space so, to maximise the benefits associated with signalling, the signallers have to alter the expression of their signal according to their surrounding environment. It is therefore expected that individuals adjust the expression of a signal according to the context in which they live (e.g.Setchell and Dixon, 2001). Social context is among the most im-portant factors that affect animal communication, specifically the expres-sion and reliability of signals (Burmeister and Wilczynski, 2000; Vergara et al., 2012a). Changes in population sex-ratio (Gautier et al., 2008) or dominance hierarchy can also affect the expression of social or sexual sig-nals, as socially subordinate individuals often reduce investment in signal-ling (Burmeister et al., 2005; Karubian et al., 2011; Setchell and Dixon, 2001; Zuk and Johnsen, 2000). However, experimental manipulations of
the social context that explore how it mediates signal expression remain limited, and the scarcity offield experiments is particularly noteworthy (Vergara et al., 2012a).
Among the physiological mechanisms linking social context and sig-nals in general, and sexual sigsig-nals in particular, the role of the endocrine system is of particular interest (Fusani, 2008). The social environment may have profound effects on androgen, particularly testosterone levels. For instance, it has been shown that testosterone levels increase when intra-sexual competition is more intense (Cristóbal-Azkarate et al., 2006; Wingfield and Hanhn, 1994). Androgens are supposed to be the link between the environment and ornament expression, and as such they influence the expression of male sexual signals in a wide va-riety of taxa (Folstad and Karter, 1992). It is widely assumed that im-plants of exogenous testosterone typically enhance sexual traits, although the increase in androgen levels is not always associated with a concomitant increase in ornament expression (Adkins-Regan, 2005). The link between androgens and aggressive behaviour has largely been considered the most plausible explanation for the dominance often exhibited by most ornamented males (Senar, 2006). Under such a scenario, we could expect an indirect effect of the social context on sexual traits via changes in testosterone levels, i.e. enhanced sexual sig-nalling after intense levels of intra-sexual competition because of an in-crease in endogenous testosterone levels (McGraw et al., 2003; Setchell
⁎Corresponding author. Fax: +44 1224 272396. E-mail address:[email protected](P. Vergara). 1
Both authors contributed equally. 2Fax: +34 915645078.
0018-506X/$–see front matter © 2012 Elsevier Inc. All rights reserved. http://dx.doi.org/10.1016/j.yhbeh.2012.07.007
Contents lists available atSciVerse ScienceDirect
Hormones and Behavior
et al., 2008). However, results are often inconsistent among and within species, and in fact, the way that social context influences sexual signals through changes in testosterone levels is likely much more complex
(Adkins-Regan, 2005; Burmeister and Wilczynski, 2000). Changes in
intra-sexual competition might not be associated with concomitant changes in sexual signalling, despite increases in testosterone levels, suggesting that social context affects both androgens and signalling inde-pendently (e.g.Burmeister and Wilczynski, 2000). In addition, androgens and sexual signalling levels are not always correlated, or if so, such rela-tionship might be context-dependent (Adkins-Regan, 2005; Burmeister and Wilczynski, 2001; Setchell et al., 2008). Therefore, further research is needed to understand the effects of social context on animal communi-cation. Our approach here is to experimentally manipulate the social con-text in a population by means of testosterone implants in a subset of males, and analyse both sexual ornament expression and androgen levels in control (un-implanted) males.
The red grouseLagopus lagopus scoticusis a tetraonid bird living in the moorlands of northern UK. Male red grouse are territorial during spring, corresponding with the breeding season, but also during autumn and spo-radically throughout winter (Watson and Moss, 2008). Autumn territorial behaviour is vital to males, as those that fail to establish or maintain a ter-ritory have low survival prospects (Mougeot et al., 2003b; Watson, 1985). In agreement, aggressiveness, intra-sexual displays and testosterone levels increase during autumn (early–middle October, seeMougeot et al., 2005a). Male–male aggressive encounters are mediated by a variety of dominance-related signals, such as territorial calls, ground andflight displays and supra-orbital combs (Mougeot et al., 2005a; Watson, 1985; Watson and Jenkins, 1964). Males erect their combs during intra- and inter-sexual encounters, and males displaying bigger combs are typically dominant, more aggressive and preferred by females (Moss et al., 1979; Redpath et al., 2006). Experimental studies have shown that comb size is a condition- and testosterone-dependent trait (Martínez-Padilla et al.,
2010; Mougeot et al., 2004, 2006), although both properties can be
context-dependent (Moss et al., 1996; Vergara et al., 2012a,b). Further-more, males can rapidly (i.e. in a few days) increase or reduce the size of their combs depending on their current position in a dominance hier-archy (Moss et al., 1979).
Here we manipulated the social environment within a population by implanting some of the territorial males with exogenous testoster-one in autumn. Previously, it has been shown that males implanted with testosterone increase their aggressive behaviour and sexual dis-plays (Moss et al., 1994; Mougeot et al., 2004, 2005a, 2006). In partic-ular, wild grouse implanted with testosterone show higher call rate, higher rate of aggressive encounters with other males and more in-trusions to neighbouring territories (Moss et al., 1994; Mougeot et al., 2005a). Unsurprisingly, manipulations of testosterone at a popula-tion level also modified the social environment: increased overall aggressiveness, reduced recruitment of young individuals back into the population and subsequent population density, modified kin struc-ture (fewer kin groups and related individuals with the male populations) and decreased body condition (Moss et al., 1994, 1996; Mougeot et al., 2003a, 2005b; Vergara et al., 2012a). These effects suggest that manipula-tions of testosterone at a population level increase intra-sexual competi-tion (Vergara et al., 2012a). Following previous experimental designs, during autumn, ca. 40% of males living in a given area were treated with testosterone to modify social context. We then compared the expression of sexual signal (i.e. comb size) and testosterone levels of intact, un-manipulated, males living within the Treatment-area (T-area) with indi-viduals living in a neighbouring and non-manipulated Control-area (i.e. C-area, see below). As comb size is a signal of dominance adjusted to the current position in the hierarchies (Moss et al., 1979), wefirst expected that non-treated individuals living in the T-area would de-crease their comb size to avoid confrontations with dominant and more aggressive, implanted individuals. Second, as a result of the expected overall increase in aggressiveness in the T-area, we expected higher levels of testosterone in non-implanted individuals living in
the T-area than in those males living in the C-area, because of the posi-tive effect of aggressive environments in testosterone levels (Oliveira, 2004).
Material and methods Manipulation of social context
Our experiment was carried out on Invermark moor (56° 54′N, 02° 50′W) in autumn 2011. Two 1-km2areas of heatherCalluna vulgaris dominated moorland, separated by a 100 m wide buffer area were ran-domly assigned as Treatment or Control areas. During early autumn (12–27 September, see ESM), we caught 88 and 82 males in the T- and C-areas respectively, which corresponds to 85% and 79% of the estimated number of territorial males living in these areas (estimated density=104 males/km2; see below). We caught male red grouse by dazzling and netting them at night. We ringed each male and deter-mined its age (i.e. young,b1-year-old or adult, >1-year-old) from plum-age. We measured comb area (maximum comb length×width, mm2) and body mass (g) as indices of ornament size and body condition respectively (Mougeot et al., 2006; Vergara et al., 2012a,b). Comb size was measured by both P.V. and J.M.-P. and repeatability between researchers was high (r=0.96, F7, 8=64.18, Pb0.001; Lessells and
Boag, 1987). To avoid bias in the day of capture, we randomly selected which area to work on each night.
Testosterone and empty implants
In the T-area, 39 males (44 % of captured males within this area), were implanted with testosterone (Treated-males), while the rest of the individuals were left un-manipulated. Treated birds were implanted with two silastic tubes (1.57 mm inner and 2.41 mm outer diameter, 20 mm long)filled with testosterone (Sigma Aldrich Co. Ltd., Poole, Dorset, UK) and sealed with glue at both ends. Implants were inserted between skin and breast muscles on theflank, under local anaesthesia. We previously determined the length of the tubing during trials on captive grouse with the implants increasing circulating testosterone levels by 2 SD of the autumn values for 2–3 months (S. Redpath and F. Mougeot, unpublished data). Males in the control area were not implanted with testosterone. Empty implants do not have detectable ef-fects on body condition, breeding success or survival (Moss et al., 1994). However, to reject any potential confounding effect of the implanting it-self on our results, a subsample of non-treated individuals captured within both T-area (n= 15) and C-area (n= 22) were given equivalent sized, empty implants, in order to compare their body mass, comb size and testosterone levels with those of non-implanted birds. Empty im-plants did not influence any of the study variables (allP> 0.22). Thus, we will not distinguish between empty- and non-implanted individuals hereafter and all were considered as control males. We had therefore considered three experimental groups:
1) Control individuals living in the control-area. 2) Control individuals living in the treatment-area. 3) Treated individuals living in the treatment-area.
Radio-tagging
A subsample of birds (32 males in C-area, 33 control males in T-area and 19 treated males in the T-area) werefitted with a radio-collar with a unique frequency (TW3-necklace radio-tags; Biotrack, Wareham, Dorset, UK) to facilitate relocation and recapture. Radio-collared birds did not differ from non radio-Radio-collared individuals in any of the study variables (allP> 0.18). We chose to include more males within the control groups because we were interested in study-ing the effect of social context rather than the effect of exogenous testosterone. We recaptured 56 radio-collar males 18 ± 0.4 days
(mean ± S.E.M.) after thefirst capture (control males in C-area n = 20; control males in T-area, n = 21; treated males in T-area, n = 15). Two birds died (natural mortality) during the study (1 control in C-area and 1 control in T-area). Ten out of the 56 recaptured birds were located in the buffer area or in a different area than in thefirst capture (3 control males from the C-area, 2 control males from the T-area and 5 treated males). These individuals were exclud-ed from the analyses. Recaptures startexclud-ed at least 11 days after the last male was implanted with testosterone (see ESM). At the second capture, comb size and body mass were measured again to assess within-individual changes in ornamentation and body condition in relation to the experiment. We also took a blood sample to quantify testosterone levels in the second capture only (see below).
Testosterone assays
Blood samples (1 ml) from males were collected by intravenous extraction from the brachial vein. Plasma was separated by centrifug-ing blood for 10 min at 8000 rpm and storcentrifug-ing it at −80 °C until analysis for measuring testosterone. We measured plasma testoster-one concentration using a commercially available testostertestoster-one enzyme immunoassay (Elisa Kit EIA-1559 from DRG Diagnostics, Marburg, Germany), an assay that has been developed and validated for determining testosterone levels in small volume (20μl) avian plasma samples (Washburn et al., 2007). Duplicate sample analy-ses showed that the testosterone assays were highly repeatable (r = 0.86,F15, 16= 13.90,Pb0.01;Lessells and Boag, 1987). All mea-surements are given in ng ml−1.
Grouse density and calling behaviour
We estimated grouse density by a method previously validated for red grouse (Evans et al., 2007). Briefly, we conducted playbacks at 6–8 points (3–4 in each area), 250 m apart. At each point, we played male territorial calls (flight and ground calls), four times, once in each of the four cardinal directions, using a portable tape player. Before and after the playback, we scanned the surrounding area with binoc-ulars forfive minutes and recorded males that responded by calling or were seen within a 100 m radius of the survey point. Playbacks were conducted in the morning (8:00–12:00) avoiding days with strong wind or rain (Evans et al., 2007). Densities (grouse or male per km2) in each area were calculated using the equations provided in
Evans et al. (Evans et al., 2007). We calculated the proportion of males calling as the total number of males calling/total number of males seen per point. We conducted these surveys 20th of April (i.e. before the manipulation) and 10th of October, more than two weeks after the last implant of testosterone was given (see ESM).
Statistical analyses
First, we tested for changes over time (before treatment vs. after treatment) in density and the proportion of males calling using gen-eralised linear models (GENMOD procedure in SAS 9.2). Models werefitted to the data using a Poisson error distribution corrected for over dispersion and a log-link function. Second, we tested for treatment effects (three-level fixed factor) on changes over time (first capture, before treatment, vs. second capture, after treatment) in comb size and body mass using general linear mixed models (GLMM, PROC Mixed procedure). In these models, individual identity was considered as a random effect, to account for repeated measures. The individual identity × time interaction was also included as a ran-dom term to correct for potential bias in ranran-dom intercept models
(Schielzeth and Forstmeier, 2009). Only males with measurements
at both captures were included in these models. Finally, we used GLMs to test for treatment effects on the data collected upon recapture (testosterone levels and its association with comb size and body mass). Age was included as a two-level fixed factor (young vs. adult) in the previous models to account for age-class dif-ferences in the study variables. We used the Satterthwaite method to calculate degrees of freedom. Testosterone concentration was log-transformed to achieve a normal distribution (log-log-transformed values S–W test;P= 0.67).
Results
Effect of the experiment on male calling behaviour and density
Changes over time in the proportion of males calling differed be-tween areas, but not in density (Table 1). Before implanting, density (F1,6=0.11,P=0.75) and the proportion of males calling (F1,5=0.09, P=0.77) did not differ significantly between areas (median±SD; calling behaviour: T-area=0.58±0.23; C-area =0.58±0.41; density: T-area = 102±42; C-area=102±48). After the implanting the number of indi-viduals remained similar in both T- and C-area (F1,4=0.58,P=0.48;
Table 1
Effect of the experiment on the change in (a) population density (grouse/km2
), and (b) calling behaviour (proportion of males calling per playback point) before and after the implanting, effect of the experiment on the change in (c) comb area (mm2
) and (d) body mass (g) between captures and (e) the effect of the experiment in log-transformed tes-tosterone levels (ng ml−1). The models analysing (a) and (b) were run using generalised linear models. The models analysing (c) and (d) were run using general linear mixed models (GLMMs) and also included individual identity and its interaction with time as random factors. In all models, Time was included as a two-level factor (before implanting vs. after implanting). In models (a) and (b), Area was included as a two-level factor (C-area vs. T-area). In models (c), (d) and (e), Treatment was included as a three-level factor: 1) Control in-dividuals living in the C-area; 2) Control inin-dividuals living in the T-area; 3) Testosterone-treated inin-dividuals living in the T-area. Parameter estimates for“Area”correspond to C-area. Parameter estimates for“Treatment”correspond to control males living in the C-area. Parameter estimates for“Time”correspond to surveys before implanting in models a) and b) and to thefirst capture in models c) and d).
Dependent variables Explanatory variables Statistics
a-Density Area F1,11= 0.43,P= 0.52,estimate± SE = 0.28 ± 0.42
Time F1,12= 3.12,P= 0.07,estimate± SE = 0.74 ± 0.42
Area × Time F1,10= 0.66,P= 0.43,estimate± SE = 0.73 ± 0.90
b-Calling behaviour Area F1,9= 3.84,P= 0.08,estimate± SE = 0.08 ± 0.24
Time F1,9= 0.29,P= 0.60,estimate± SE = 0.34 ± 0.23
Area × Time F1,9= 5.66,P= 0.04,estimate± SE =−0.89 ± 0.38
c-Comb area Treatment F2,41=17.72,Pb0.01,estimate±SE=−166.3±18.2
Time F1,42=93.97,Pb0.01,estimate±SE=−165.7±11.0
Treatment × Time
F2,42=108.79,Pb0.01,estimate±SE=149.3±13.3
d-Body mass Treatment F2,41= 1.18,P= 0.31,estimate± SE =−21.9 ± 18.1
Time F1,42= 32.12,Pb0.01,estimate± SE = 24.4 ± 7.0
Treatment × Time
F2,42= 0.60,P= 0.55,estimate± SE =−9.4 ± 8.7
median ± SD, T-area = 86 ± 130; C-area = 117 ± 255), but males liv-ing in the T-area called more frequently than those in the C-area (F1,4= 10.13,P= 0.03, median ± SD; T-area = 1.00 ± 0.09; C-area = 0.33 ± 0.22).
Effect of the experiment on comb size
Before testosterone implanting, comb area and body mass did not differ significantly between both areas and treatment groups (all
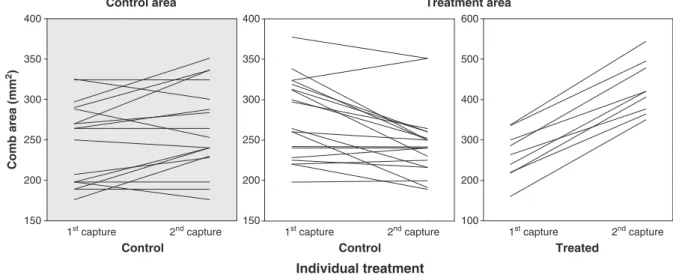
P> 0.11). The experimental manipulation of testosterone influenced levels of sexual signalling. First, we found that changes in comb size within individuals significantly differed between treatments (Table 1,
Fig. 1). Treated birds increased comb size after testosterone implants more than control males from T- and C-areas (GLMM, interaction treatment× time, bothPb0.01,Fig. 1). In addition, the change in comb size between experimental groups differed between control birds from the C- and T-area (GLMM, interaction treatment× time,F1,34= 18.31,Pb0.01). Specifically, control males from the T-area decreased their comb size in relation to control males from the C-area (Fig. 1). In addition, control males from T-areas decreased their comb size (within experimental group GLMM, time,Pb0.01,Fig. 1) whereas control males from C-areas increased them (within experimental group GLMM, time,
P =0.04,Fig. 1). Average comb size from the second capture also dif-fered between treatments (GLM, treatment F2,41= 62.25, Pb0.01). Comb size in treated males (428± 17 mm2), was bigger than the comb size of males from the two other groups (post-hoc test both
Pb0.01). Comb size of control birds from the C-area (263 ± 12 mm2) did not differ from that of control birds from the T-area (246± 12 mm2) (post-hoc testP= 0.11). Body mass decreased between cap-ture and recapcap-ture, but this change did not differ among treatments (Table 1). None of the previous results changed when including day of capture in the models described above.
Effect of the experiment on circulating testosterone levels
Upon second capture, testosterone levels differed significantly between experimental groups (Table 1,Fig. 2). Testosterone levels did not differ between treated and control individuals from the T-area (post-hoc test P= 0.88, Fig. 2), and both groups showed testosterone levels significantly higher than those of individuals from the C-area (post-hoc tests: control males from C-area vs. control males from T-area,P= 0.01; control males from C-area vs. treated males, P= 0.04, Fig. 2). Testosterone levels did not differ between age-classes (F1,36= 2.57,P= 0.11) and the age × treatment interaction was not significant (F2,34= 0.26, P= 0.77). Comb size (dependent
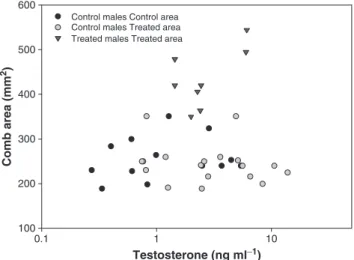
variable) and testosterone levels were not significantly related (F1,37= 0.52,estimate± SE = 24.9± 34.6,P= 0.47,Fig. 3), irrespective of the treatment (testosterone × treatmentF1,33= 2.80,P= 0.07,Fig. 3; within treatment relationships: control birds C-areaF1,11= 0.40,P= 0.53; control birds T-areaF1,16= 0.61,P= 0.44; treated birds T-area F1,6= 3.56, P= 0.10) and age-classes (testosterone × age F1,35= 0.60, P= 0.44). Body mass was not correlated with testosterone levels, irrespective of treatment and age (allP> 0.29). None of these results changed when including sampling date in the models.
Discussion
Sexual signalling and social context
Animal communication theories predict that social environment can affect signal expression, yet experimental tests of this prediction in thefield are lacking. Here, we were able to increase aggressive-and dominance-related displays, elements of social context, aggressive-and pro-vided experimental evidence that it modified sexual signalling levels in a wild vertebrate. Specifically, we showed that male red grouse de-creased their sexual signalling levels (i.e. comb size) when levels of Control area Control
Individual treatment
Comb area (mm 2) Control Treated Treatment area 400 350 300 250 200 150 400 350 300 250 200 150 600 500 400 300 200 1001st capture 2nd capture 1st capture 2nd capture 1st capture 2nd capture
Fig. 1.Changes in comb size (mm2
) between captures (before vs. after implanting) according to individual treatment and area.
Control area Treated area Control Individual treatment Testosterone (ng ml − 1) Control Treated 12 10 8 6 4 2 0 13 18 9 ns
Fig. 2.Testosterone levels (ng ml−1
) ± SD according to treatment and area. n.s. P> 0.05, *Pb0.05. Sample sizes are given above bars. Note that analyses were run using log-transformed testosterone levels.
calling behaviour and the size of the combs in a subset of individuals were experimentally increased. Exploring the endocrinological mech-anism behind such changes in sexual trait expression, we found that such a decrease in ornament size was not explained by testosterone levels. Instead, the decrease in comb size was associated with an in-crease in testosterone levels.
In agreement with previous studies, treated birds increased comb size after testosterone implanting, reaching similar sizes to those nat-urally displayed by males in spring (seeMougeot et al., 2006). In ad-dition, and as expected because of the autumnal peak in intra-sexual competition in red grouse (Mougeot et al., 2005a), individuals living in the C-areas increased their comb size. Most interestingly, we found that control, non-treated, males living in a more competitive area (T-area) decreased their comb size after the experimental ma-nipulation of social context. The reason behind such a decrease in male comb size might be that such males became subordinate to treated males. Treated males increase their comb size and that in-crease can be interpreted as a proxy of aggressiveness potential and dominance (Moss et al., 1979; Zuk and Johnsen, 2000). As a conse-quence, control, subordinate males may react to the increased comb size of their treated conspecifics by decreasing their ornament size, in order to avoid confrontations with dominant individuals (e.g.Moss et al., 1979; Zuk and Johnsen, 2000). This is perhaps the most plausible reason, but we cannot rule out similar reasoning with other dominance-related behavioural (e.g. aggressiveness, calling,flight displays) or pheno-typic (e.g. coloration) traits that are also associated with both testosterone levels and dominance in red grouse (Martínez-Padilla et al., 2010; Moss et al., 1994; Mougeot et al., 2005a). Among these, calling behaviour is a testosterone-dependent trait that deserves further speculation. Calling behaviour is a testosterone-dependent signal in red grouse and it has been considered an important signal mediating male–male territorial confrontations (Mougeot et al., 2005a). Interestingly, we found that the proportion of males calling increased in the T-area after the implanting. Therefore, similar to comb size, calling behaviour could be interpreted as a signal of dominance, an idea that would require further confirmation.
Higher testosterone levels after increased levels of male aggressive behaviours
As predicted by the feedback between androgens and social context (reviewed inOliveira, 2004), we found that experimentally increased male–male competition promotes an increase in testosterone levels. Furthermore, the increase in testosterone levels shown in control indi-viduals living in the T-area, was similar to that found in T-implanted males (Fig. 2). Treated males showed the expected increase in
testosterone levels with respect to the average autumn values in this species (Mougeot et al., 2005a). However, the high levels of testoster-one of control, non-implanted males, living in the T-area is somewhat surprising. The reason behind such increase can be explained because of the high level of intra-sexual competition in the study area, regard-less of the experimental treatment. Intra-sexual competition in red grouse increases along population density (Mougeot et al., 2003a). Pop-ulation density in the study area was extremely high: 104 males/km2as compared with densities of around 40 males/km2shown in the same area a few years before (authors' unpublished data). Furthermore, tes-tosterone levels of individuals living in the C-area were above the aver-age autumn values in red grouse (e.g.Bortolotti et al., 2009). This suggests high and natural intra-sexual competition level in the study population that we boosted when implanting with exogenous testos-terone some males in the T-area. This created an extremely competitive environment that helps us to understand the high testosterone levels found in non-implanted birds from the T-area.
The role of androgens in regulating comb size
Our results suggest an inconsistency regarding the link between tes-tosterone and ornament expression (Fusani, 2008). On the one hand, we found that comb size increased in males implanted with exogenous tes-tosterone, as shown in previous experiments (Martínez-Padilla et al., 2010; Mougeot et al., 2004). On the other hand, we found that control, untreated, males living in the treatment area also had increased levels of endogenous testosterone but did not increase comb size. Furthermore, we also found that testosterone and comb size were not correlated (Fig. 3). These inconsistencies show that the relationship between circu-lating testosterone levels and sexual signalling is not simple, as repeatedly reported (Adkins-Regan, 2005). Indeed, the relationship can be complex (e.g. non-linear) and context- or condition-dependent (Burmeister and Wilczynski, 2001; Perez-Rodriguez et al., 2006; Safran et al., 2008).
It has been proposed that the relation between testosterone and orna-mentation may be mediated by other hormones released by the endo-crine system, such as corticosterone. This idea has received support in the study species and in a recent experiment it was shown that the effect of testosterone implants on comb size was mediated by corticosterone levels of individuals (Bortolotti et al., 2009). Specifically, they found that the more stressed the birds were (i.e., higher corticosterone levels), the less testosterone-dependent the expression of the ornament was (Bortolotti et al., 2009). In addition, equivalent manipulations to the one described in our experiment in red grouse showed that stressful condi-tions of the T-area promote a loss of male body condition of individuals living in this area (Vergara et al., 2012a). Although, we did notfind such expected negative effect of the experiment on the condition of individ-uals, likely because of the limited time between captures, we cannot rule out that corticosterone levels were affected. Perhaps corticosterone is the hormone that may regulate the ornament expression under given stressful circumstances. We cannot disregard however, that control indi-viduals living in the T-area use their endogenous testosterone to increase other androgen-dependent displays (e.g. coloration, calling orflight dis-plays) and behaviours (e.g. aggressiveness) not measured here, thereby explaining the decrease in their comb size. Further studies will help to clarify the mechanism behind the changing testosterone-dependence of comb size.
At this point we should however acknowledge the limitations of our experimental approach. The study was based on a limited sample size in the sense that each area (Treated vs. Control) constitutes a sin-gle plot. However, our“Before vs. After”comparison design, and the fact that the experiment was carried out in natural conditions provide robustness to our main conclusions, but further, if possible replicated, experimental studies are needed to corroborate the presentfindings. In conclusion, we provided an experimental demonstration in wild conditions that social context can regulate both sexual signalling 600 500 400 300 200 100 0.1 1 10 Testosterone (ng ml−1) Comb area (mm 2)
Control males Control area Control males Treated area Treated males Treated area
Fig. 3.Relationship between comb size and testosterone levels (ng ml−1 ). Different treatments are presented with different symbols. Note that analyses were run using log-transformed testosterone levels.
and testosterone levels. Males decreased their dominance-related sig-nalling in response to a more competitive environment, but enhanced their testosterone levels as expected when faced with increasing male–male competitiveness. Ourfindings suggest that social context may regulate sexual signalling and testosterone independently, and that testosterone levels and ornament expression do not have to be necessarily linked in a simple way.
Acknowledgments
We are grateful to R. Tarjuelo, M. James, J.A. Fargallo and I. López-Rull who helped in thefield, and the owner and head keeper from Invermark for allowing us to conduct the work. We thank S.M. Redpath, F. Mougeot, R. Tarjuelo and two anonymous reviewers for valuable comments. L. Pérez-Rodriguez helped with testosterone analyses. P.V. was supported by an Intra-European Marie Curie Fellowship (European Union Seventh Framework Programme, FP7/2007-2013, grant agreement no. 252499). J.M.-P. was supported by a JAE-doc fellowship from CSIC. We held all the necessary UK Home Office licences for conducting these procedures (PPL60/3824). This study was partially funded by a Natural Environment Research Council grant (NE/D014352/1).
Appendix A. Supplementary data
Supplementary data to this article can be found online athttp:// dx.doi.org/10.1016/j.yhbeh.2012.07.007.
References
Adkins-Regan, E., 2005. Hormones and Animal Social Behaviour. Princeton University Press, New Jersey.
Bortolotti, G.R., Mougeot, F., Martínez-Padilla, J., Webster, L.M.I., Piertney, S.B., 2009. Physiological stress mediates the honesty of social signals. PLoS One 4, e4983. Burmeister, S.S., Wilczynski, W., 2000. Social signals influence hormones independently of
calling behavior in the treefrog (Hyla cinerea). Horm. Behav. 38, 201–209. Burmeister, S.S., Wilczynski, W., 2001. Social context influences androgenic effects on
calling in the green treefrog (Hyla cinerea). Horm. Behav. 40, 550–558. Burmeister, S.S., Jarvis, E.D., Fernald, R.D., 2005. Rapid behavioral and genomic responses
to social opportunity. PLoS Biol. 3, e363.
Cristóbal-Azkarate, J., Chavira, R., Boeck, L., Rodríguez-Luna, E., Veàl, J.J., 2006. Testosterone levels of free-ranging resident mantled howler monkey males in relation to the num-ber and density of solitary males: a test of the challenge hypothesis. Horm. Behav. 49, 261–267.
Evans, A.E., Mougeot, F., Redpath, S.M., Leckie, F., 2007. Alternative methods for esti-mating breeding density in an upland game bird, the red grouseLagopus lagopus scoticus. Wildl. Biol. 13, 130–139.
Folstad, I., Karter, A.J., 1992. Parasites, bright males and the immunocompetence handicap. Am. Nat. 139, 603–622.
Fusani, L., 2008. Testosterone control of male courtship in birds. Horm. Behav. 54, 227–233. Gautier, P., Barroca, M., Bertrand, S., Eraud, C., Gaillard, M., Hamman, M., Motreuil, S., Sorci, G., Faivre, B., 2008. The presence of females modulates the expression of a carotenoid-based sexual signal. Behav. Ecol. Sociobiol. 62, 1159–1166.
Karubian, J., Lindsay, W.R., Schwabl, H., Webster, M.S., 2011. Bill coloration, aflexible signal in a tropical passerine bird, is regulated by social environment and androgens. Anim. Behav. 81, 795–800.
Lessells, C.M., Boag, P.T., 1987. Unrepeatable repeatabilities: a common mistake. Auk 104, 116–121.
Martínez-Padilla, J., Mougeot, F., Webster, L.M.I., Pérez-Rodríguez, L., Piertney, S.B., 2010. Testing the interactive effects of testosterone and parasites on carotenoid-based ornamentation in a wild bird. J. Evol. Biol. 23, 902–913.
Maynard Smith, J., Harper, D., 2003. Animal Signals. Oxford University Press, Oxford, UK. McGraw, K.J., Dale, J., Mackillop, E.A., 2003. Social environment during molt and the ex-pression of melanin-based plumage pigmentation in male house sparrowsPasser domesticus. Behav. Ecol. Sociobiol. 53, 116–122.
Moss, R., Kolb, H.H., Marquiss, M., Watson, A., Treca, B., Watt, D., Glennie, W., 1979. Aggressiveness and dominance in captive cock red grouse. Aggress. Behav. 5. Moss, R., Parr, R., Lambin, X., 1994. Effects of testosterone on breeding density,
breeding success and survival of red grouse. Proc. R. Soc. Lond. B Biol. Sci. 258, 175–180.
Moss, R., Watson, A., Parr, R., 1996. Experimental prevention of a population cycle in red grouse. Ecology 77, 1512–1530.
Mougeot, F., Redpath, S.M., Leckie, F., Hudson, P.J., 2003a. The effect of aggressiveness on the population dynamics of a territorial bird. Nature 421, 737–739.
Mougeot, F., Redpath, S.M., Moss, R., Matthiopoulos, J., Hudson, P.J., 2003b. Territorial be-haviour and population dynamics in red grouseLagopus lagopus scoticus. I. Population experiments. J. Anim. Ecol. 72, 1073–1082.
Mougeot, F., Irvine, J.R., Seivwright, L., Redpath, S.M., Piertney, S., 2004. Testosterone, immunocompetence, and honest sexual signaling in male red grouse. Behav. Ecol. 15, 930–937.
Mougeot, F., Dawson, A., Redpath, S.M., Leckie, F., 2005a. Testosterone and autumn territorial behavior in male red grouseLagopus lagopus scoticus. Horm. Behav. 47, 576–584.
Mougeot, F., Piertney, S.B., Leckie, F., Evans, S., Moss, R., Redpath, S.M., Hudson, P.J., 2005b. Experimentally increased aggressiveness reduces population kin structure and subsequent recruitment in red grouseLagopus lagopus scoticus. J. Anim. Ecol. 74, 488–497.
Mougeot, F., Redpath, S.M., Piertney, S., 2006. Elevated spring testosterone increases parasite intensity in male red grouse. Behav. Ecol. 17, 117–125.
Oliveira, R.F., 2004. Social modulation of androgens in vertebrates: mechanisms and function. Adv. Study Behav. 34, 165–239.
Perez-Rodriguez, L., Blas, J., Vinuela, J., Marchant, T.A., Bortolotti, G.R., 2006. Condition and androgen levels: are condition-dependent and testosterone-mediated traits two sides of the same coin? Anim. Behav. 72, 97–103.
Redpath, S.M., Mougeot, F., Leckie, F., Evans, A.D., 2006. The effects of autumn testosterone on survival and productivity in red grouseLagopus lagopus scoticus. Anim. Behav. 71, 1297–1305.
Safran, R.J., Adelman, J.S., McGraw, K.J., Hau, M., 2008. Sexual signal exaggeration affects physiological state in a social vertebrate. Curr. Biol. 18, R461–R462.
Schielzeth, H., Forstmeier, W., 2009. Conclusions beyond support: overconfident esti-mates in mixed models. Behav. Ecol. 20, 416–420.
Senar, J.C., 2006. In: Hill, G.E., McGraw, K.J. (Eds.), Color Displays as Intrasexual Signals of Aggression and Dominance. Harvard University Press, pp. 87–137.
Setchell, J.M., Dixon, A.F., 2001. Changes in the secondary sexual adornments of male mandrillsMandrillus sphinxare associated with gain and loss of alpha status. Horm. Behav. 39, 177–184.
Setchell, J.M., Smith, T., Wickings, E.J., Knapp, L.A., 2008. Social correlates of testosterone and ornamentation in male mandrills. Horm. Behav. 54, 365–372.
Vergara, P., Martínez-Padilla, J., Mougeot, F., Leckie, F., Redpath, S.M., 2012a. Environ-mental heterogeneity influences the reliability of secondary sexual traits as condi-tion indicators. J. Evol. Biol. 25, 20–28.
Vergara, P., Mougeot, F., Martínez-Padilla, J., Leckie, F., Redpath, S.M., 2012b. The condition-dependence of a secondary sexual trait is stronger under high parasite infection level. Behav. Ecol. 23, 502–511.
Washburn, B.E., Millspaugh, J.J., Morris, D.L., Schulz, J.H., Faaborg, J., 2007. Using a com-mercially available enzyme immunoassay to quantify testosterone in avian plasma. Condor 109, 181–186.
Watson, A., 1985. Social class, socially-induced loss, recruitment and breeding of red grouse. Oecologia 67, 493–498.
Watson, A., Jenkins, D., 1964. Notes on the behaviour of the red grouse. Br. Birds 57, 137–170. Watson, A., Moss, R., 2008. Grouse. Collins, London.
Wingfield, J.C., Hanhn, T.P., 1994. Testosterone and territorial behaviour in sedentary and migratory sparrows. Anim. Behav. 47, 77–89.
Zuk, M., Johnsen, T.S., 2000. Social environment and immunity in male red jungle fowl. Behav. Ecol. 11, 146–153.