ORIGINAL ARTICLE
Apparent diffusion coefficient and Magnetic
resonance spectroscopy in grading
of malignant brain neoplasms
Mahmoud Abd Elaziz Dawoud
1, Mohamed Fouad Sherif
2,
Mohamed Adel Eltomey
*Radiology & Imaging Department, Faculty of Medicine, Tanta University, Elbahr Street, Tanta 31111, Egypt
Received 14 May 2014; accepted 2 August 2014 Available online 30 August 2014
KEYWORDS ADC; Spectroscopy; Grading; Brain; Neoplasms
Abstract Aim: This work aims to study the role of combined apparent diffusion coefficient (ADC) and Magnetic resonance spectroscopy (MRS) in grading malignant brain neoplasms.
Methods: A prospective study included 40 patients who were evaluated by standard contrast enhanced MRI, diffusion weighted imaging and multivoxel spectroscopy.
Results: Statistically significant difference was found between tumoral ADC values in low grade versus high grade tumors and metastasis and also between the peritumoral ADC values in metas-tasis versus low and high grade tumors. Statistically significant difference is noticed between tumoral Cho/Cr ratio values in low grade versus high grade tumors and metastasis, and also perit-umoral Cho/Cr ratio values in low grade and metastasis versus high grade tumors. Statistically sig-nificant difference between tumoral Cho/NAA ratio in low grade versus high grade tumors and metastasis and lastly between peritumoral Cho/NAA ratio in low grade and metastasis versus high grade tumors was found. Lipid and lactate peaks were found frequently in high grade tumors and metastasis.
Conclusion: The combination of calculated ADC values and MR spectroscopy is useful in grading of malignant brain tumors and were more useful together than each on its own.
2014 The Egyptian Society of Radiology and Nuclear Medicine. Production and hosting by Elsevier B.V.
1. Introduction
Intracranial tumor management and treatment depends on proper grading. High grade gliomas are frequently treated by resection followed by radiotherapy and chemotherapy, while surgery alone is usually sufficient for treating low grade gliomas(1–3).
* Corresponding author. Address: 1 Othman Ibn Affan Street, Tanta, Egypt. Tel.: +20 40 333 3 893 (home), +20 40 333 8 445 (work), mobile: +20 128 817 6 817.
E-mail addresses:[email protected](M.A.E. Dawoud),
[email protected] (M.F. Sherif ), Mohamed.Eltomey@med. tanta.edu.eg(M.A. Eltomey).
1 Mobile: +20 100 602 3 295. 2 Mobile: +20 100 194 3 928.
Peer review under responsibility of Egyptian Society of Radiology and Nuclear Medicine.
Egyptian Society of Radiology and Nuclear Medicine
The Egyptian Journal of Radiology and Nuclear Medicine
www.elsevier.com/locate/ejrnm
www.sciencedirect.com
http://dx.doi.org/10.1016/j.ejrnm.2014.08.003
0378-603X2014 The Egyptian Society of Radiology and Nuclear Medicine. Production and hosting by Elsevier B.V.
Open access under CC BY-NC-ND license.
Imaging plays an integral role in intracranial tumor man-agement. Magnetic resonance (MR) imaging in particular has emerged as the imaging modality most frequently used to evaluate intracranial tumors(4).
Diffusion-weighted imaging (DWI) provides image contrast which is dependent on the molecular motion of water(5).
The use of ADC values within the enhancing tumor tissue and the peri-tumor area provides quantitative information on tumor cellularity and characterization of tumor-related edema that is not readily discernible on conventional MRI(6). Magnetic resonance spectroscopy is generally known as an analytical method in chemistry to identify molecules and to determine their biophysical characteristics. Magnetic reso-nance spectroscopic imaging (MRSI) is a non-invasive imaging technique that provides metabolic information on brain tumor(7).
2. Aim of the work
This work aims to study the role of the combined application of apparent diffusion coefficient (ADC) values and Magnetic resonance spectroscopy (MRS) in grading of malignant brain neoplasms.
3. Patients and methods
Between March 2013 and March 2014, 40 patients (29 males and 11 females) known to have intracranial space occupying lesions by CT were included in this study. Their ages ranged from 9 years to 67 years (mean 41.4 ± 16.4).
3.1. MRI examination of brain
All the cases were evaluated by standard brain MRI protocol at our institution using 1.5T MRI machine (GE Signa 1.5T, GEMSOW), the protocol includes a 3 plane localizer, Axial & Sagittal T1WI, Axial T2 WI, Axial fluid attenuation inver-sion recovery (FLAIR). Post contrast T1WI in axial, coronal and sagittal planes using Gadolinium-DTPA (0.2 mg/kg). A slice thickness of 5 mm and 4 mm spacing was used.
Diffusion weighted imaging (DW) with apparent diffusion coefficient calculation of brain lesions for all patients: DW images were obtained using an axial echo-planar Spin Echo sequence, on average 5-mm section thickness. DW images and ADC maps were acquired by using b-values of 0 and 1000 s/mm2applied in theX,YandZdirections. Post process-ing of ADC maps was performed usprocess-ing software provided on the machine console. Regions of Interest (ROIs) for ADC cal-culation were placed manually in the solid enhancing parts of the tumor, preferably avoiding cystic or necrotic areas, and in the peritumoral regions. Standard mean ADC values were calculated automatically and expressed in 10 3mm2/s.
Point resolved spectroscopy (PRESS) technique was applied using long and short TE (144 & 35 ms), respectively. Sampling analysis was performed by Multivoxel MR spectro-scopic technique (MVS), 2 or 3 were positioned in the solid parts of the lesions guided by enhancement in post contrast T1WIs avoiding areas that showed signs of hemorrhage or necrosis, also avoiding contamination from nearby bone or CSF spaces, the voxels size ranged from 1·1·1 cm3 to 2·2·2 cm3, other similar voxels (2 or 3) were placed in
peri-lesion edema. A voxel was positioned in the contralateral normal brain white matter to obtain a reference spectrum. Choline/Creatine and Choline/N-Acetyl Aspartate ratios were calculated for the tumor and peritumoral edema. Lipid and lactate peaks were read at 1.3 ppm on long and short TE sequences as present or absent.
Surgical resection was performed in 28 patients and stereo-tactic biopsy in 12 patients, the resected specimens were evalu-ated by Histopathology.
The study was approved by the local ethics committee at our institution, patient consent was obtained from all study subjects and their data were kept in a secure electronic file in an anonymous manner to insure patient confidentiality.
Statistical analysis was performed using Mann–WhitneyU
test to compare the ADC values and MRS ratios, Chi-square test was performed on the lipid peak in long and short TE,p
value of <0.05 was considered statistically significant. Soft-ware used was Minitab V.17 (Minitab Inc. USA).
4. Results
The final histopathological results of the 40 patients revealed 28 cases of primary tumors divided into 11 cases of low grade glioma (WHO I–II) (27.5%), 17 cases of high grade glioma (42.5%) including 5 cases of anaplastic astrocytoma (12.5%), 12 cases of glioblastoma multiformis (30%), while metastasis was found in 12 cases (30%) (Table 1, Figs.4A,5A,6A).
ADC values of the tumoral area were higher in low grade tumors (1.216 + 0.059·10 3mm2/s) than high grade (0.95 +
0.12·10 3mm2/s) and metastatic tumors (0.99 + 0.153·
10 3mm2/s). A statistically significant difference was seen between tumoral ADC values in low grade versus high grade tumors and metastasis with p< 0.0001 and p= 0.0026, respectively. No statistically significant difference of the tumoral ADC values between high grade tumors and metasta-sis was foundp= 0.5208 (Table 2, Figs.1A,4B,5B,6B).
Peritumoral ADC values calculated were higher in metasta-ses (1.66 ± 0.068) than high grade primary tumors (1.22 ± 0.065) (Table 3). ADC values of the peritumoral area were higher in metastatic tumors (1.66 ± 0.068·10 3mm2/s) than low grade (1.59 + 0.052·10 3mm2/s) and high grade tumors (1.22 ± 0.065·10 3mm2/s). A statistically significant differ-ence was seen between the peritumoral ADC values in
Table 1 Showing histological diagnosis of the 40 cases included in the study.
Primary low grade (WHO I–II) Primary high grade (WHO III–IV) Metastatic Total Number of patients 11 (27.5%) 17 (42.5%) 12 (30%) 40
12 GBM 5 AA
metastasis versus low and high grade with p= 0.0210 and
p= 0.0102, respectively. No statistically significant difference of the peritumoral ADC values between Low and high grade tumors was foundp= 0.832 (Table 2, Figs.1B,4B,5B,6B).
Cho/Cr ratio values of the tumoral area were lower in low grade tumors (2.23 + 0.512) than high grade (4.48 + 2.09) and
metastatic tumors (4.23 + 2.02) (Table 3). A statistically signifi-cant difference was seen between Cho/Cr ratio values in low grade versus high grade tumors and metastasis with p= 0.0003 and
p= 0.0019, respectively. No statistically significant difference of the Cho/Cr ratio values between high grade tumors and metasta-sis was foundp= 0.6419 (Table 3, Figs.2A,4C,5C,6C).
Table 2 Showing ADC values in tumoral and peritumoral regions of the cases.
Primary low grade (WHO I–II) Primary high grade (WHO III–IV) Metastatic ADC tumoral (·10 3mm2/s) 1.216 ± 0.059 0.953 ± 0.12 0.997 ± 0.153
ADC peritumoral (·10 3mm2/s) 1.59 ± 0.052 1.22 ± 0.065 1.66 ± 0.068
Fig. 1 (A) Box and whisker plot of the ADC values in the tumor. (B) Box and whisker plot of the ADC values in the peritumoral region.
Fig. 2 (A) Box and whisker plot of the Cho/Cr ratio in the tumor. (B) Box and whisker plot of the Cho/Cr ratio in the peritumoral region.
Fig. 3 (A) Box and whisker plot of the Cho/NAA ratio in the tumor. (B) Box and whisker plot of the Cho/NAA ratio in the peritumoral region.
Cho/Cr ratio values of the peritumoral area were lower in low grade tumors (1.25 + 0.344) and metastasis (1.28 + 0.523) than high grade tumors (2.071 ± 0.95). A sta-tistically significant difference was seen between Cho/Cr ratio values in low grade and metastasis versus high grade tumors withp= 0.0225 andp= 0.0139, respectively. No statistically significant difference of the peritumoral Cho/Cr ratio values between low grade tumors and metastasis was found
p= 0.926 (Table 3, Figs.2B,4E,5E,6E).
Cho/NAA ratio values of the tumoral area were lower in low grade tumors (1.99 + 0.86) than high grade (7.81 + 1.72) and metastatic tumors (7.49 + 2.03). A statisti-cally significant difference was seen between Cho/NAA ratio values in low grade versus high grade tumors and metastasis withp< 0.0001 andp= 0.0001, respectively. No statistically significant difference of the Cho/NAA ratio values between high grade tumors and metastasis was found p= 0.5799 (Table 3, Figs.3A,4C,5C,6C).
Cho/NAA ratio values of the peritumoral area were lower in low grade tumors (1.1 + 0.2) and metastasis (1.14 + 0.207) than high grade tumors (2.8 + 1.07). A statisti-cally significant difference was seen between Cho/NAA ratio values in low grade and metastasis versus high grade tumors
with p< 0.0001. No statistically significant difference of the peritumoral Cho/NAA ratio values between low grade tumors and metastasis was foundp= 0.6223 (Table 3, Figs.3B,4E,
5E,6E).
Both long and short TE (144 and 35 ms), respectively were used to evaluate the presence of lactate and lipid. The lactate peak was well demonstrated on the long TE while the lipid peak was much more evident on the short TE.
Chi square test showed a statistically significant difference between the presence of lipid peak in metastatic and high grade tumors on both long and short TE p= 0.02 & p= 0.47, respectively.
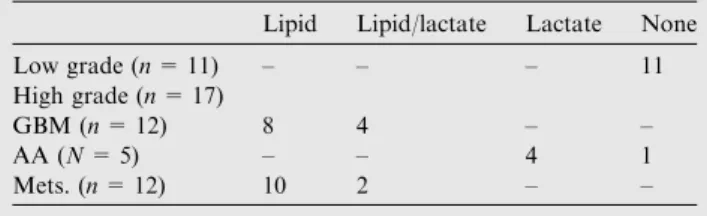
Low grade primary tumors showed absent lactate and lipid on both long and short TE sequences.
Lactate peak on long TE was seen in 5 cases of GBM, 4 cases of AA and 2 cases of metastatic tumors. It was less evi-dent on short TE being seen in only 4 cases of AA (Tables 4 and 5).
Lipid peak was most frequently seen in metastatic tumors on both long and short TE, 8 & 10 cases, respectively. GBM also showed lipid peak on both long and short TE, in 4 & 8 cases, respectively (Tables 4 and 5, Figs.4D,5D,6D).
Fig. 4 Forty year old male complaining of headache. Operative resection biopsy revealed low grade glioma (WHO grade I). (A) Axial post contrast T1WI showed a well defined rounded focal lesion in the left parietal region showing thick faint marginal enhancement, no peritumoral edema was seen. (B) ADC map of the lesion, the intratumoral ADC value was 1.15·10 3mm2/s, peritumoral ADC value was 1.62·10 3mm2/s. (C) Multivoxel Long TE (144 ms) spectroscopy in the tumor showed Cho/Cr = 3.25, Cho/NAA = 1.91. (D)
Multivoxel Short TE (35 ms) in the tumor showed absence of lipid and lactate peaks. (E) Multivoxel Long TE (144 ms) spectroscopy in the peritumoral region showed Cho/Cr = 1.78 and Cho/NAA = 2.06.
5. Discussion
The low accuracy of differentiation of primary intracranial tumors and metastasis on convention MR imaging leads to the need of more advanced MR techniques including diffusion weighted imaging and MRS(8).
Our results showed that tumoral ADC values were higher in low grade tumors than high grade tumor and metastasis with a statistically significant difference between primary low grade tumors and primary high grade and metastatic brain tumors, however ADC values failed to differentiate primary high grade tumors from metastatic brain tumors, our results matched those of Server et al. (3), Murakami et al. (9)and Lee et al.(10). These findings could be attributed to the fact that the higher the grade of malignancy the cellularity of the tumor increases thus restricting water diffusion. On the other hand several studies failed to differentiate between primary low and high grades tumors. Including those of Pavlisa et al.
(11)and Rollin et al.(12).
In this study it was found that ADC values in peritumoral area were significantly higher in metastatic tumors than those
of low and high grade primary tumors and that there was no statistically significant difference in the peritumoral ADC value between low and high grade tumors. These results matched those of Lee et al. (10) and Server et al. (3). Lee et al. (10) explained this finding by the increased cellularity in the peritumoral region in primary tumors as a result of infil-tration, while in metastatic tumors there is vasogenic edema with no infiltration. It is noted that the Guzman et al. (13)
reported the ability of peritumoral ADC values to differentiate low from high grade tumors, contradicting our results. This contradiction could be attributed to the limitation of having a small population in this study.
Choline/Creatine (Cho/Cr) ratio in the tumoral area was significantly lower in primary low grade tumors than in pri-mary high grade tumors and metastasis, no significant differ-ence was seen between primary high grade tumors and metastasis. This agreed with the result of Martinez-Bisbal et al. (14), Chen et al. (15) & Shokry (16) that increase in Cho/Cr ratio in lesion could only differentiate low grade pri-mary tumors from high grade pripri-mary tumors. The increase in Cho/Cr ratio in high grade tumors was reported to correlate
Fig. 5 Fifty-six year old female complaining of headache. Stereotactic biopsy revealed GBM (WHO grade III). (A) Axial post contrast T1WI showed a well defined irregular shaped intraaxial space occupying lesion in the right parieto-temporal region showing uneven peripheral strong marginal enhancement, moderate peritumoral edema was seen with mass effect. (B) ADC map of the lesion, the intratumoral ADC value was 0.95·10 3mm2/s, peritumoral ADC value was 1.42·10 3mm2/s. (C) Multivoxel Long TE (144 ms)
spectroscopy in the tumor showed Cho/Cr = 4.45, Cho/NAA = 6.125. (D) Multivoxel Short TE (35 ms) spectroscopy in the tumor showed a high lipid peak. (E) Multivoxel Long TE (144 ms) spectroscopy in the peritumoral region showed Cho/Cr = 2.23 and Cho/ NAA = 2.07.
significantly with expression of proliferating cells by Chen et al.(15).
Choline/Creatine (Cho/Cr) ratio in the peritumoral area was significantly lower in primary low grade tumors and metastasis than in primary high grade tumors, no significant difference was seen between primary low grade tumors and metastasis. These findings agreed with those of Chiang et al.
(17), Matteo Bendini et al.(18)and Faria et al.(19). The find-ings were explained on the bases that primary high grade tumors have been reported to have peritumoral infiltrating neoplastic cells. So perilesional edema areas show
spectro-scopic malignant changes in the form of higher CHO/Cr ratio in primary tumors than metastatic.
Choline/N-acetyl aspartate (Cho/NAA) ratio in the tumoral area were significantly lower in primary low grade tumors than primary high grade tumors and metastasis and no significant difference was seen between primary high grade and metastatic tumors. These results matched those reported by LIU et al.(20)and Server et al.(21).
Choline/N-acetyl aspartate (Cho/NAA) ratio in the peritu-moral area was significantly lower in primary low grade tumors and metastatic than primary high grade tumors with
Fig. 6 Thirty-seven year old female with known history of breast cancer. (A) Axial post contrast T1WI showed a well defined irregular focal lesion in the left parietal region showing strong heterogeneous enhancement, mild peritumoral edema was seen. (B) ADC map of the lesion, the intratumoral ADC value was 1.05·10 3mm2/s, peritumoral ADC value was 1.76·10 3mm2/s. (C) Multivoxel Long TE (144 ms) spectroscopy in the tumor showed Cho/Cr = 3.87, Cho/NAA = 3.44. (D) Multivoxel Short TE (35 ms) in the tumor showed a lipid peak. (E) Multivoxel Long TE (144 ms) spectroscopy in the peritumoral region showed Cho/Cr = 1.18 and Cho/NAA = 0.09. Stereotactic biopsy revealed metastatic lesion.
Table 3 Showing MRS ratios in tumoral and peritumoral regions of the cases on long TE (144 ms).
Primary low grade (WHO I–II) Primary high grade (WHO III–IV) Metastatic Cho/Cr tumoral 2.23 ± 0.512 4.487 ± 2.09 4.232 ± 2.02 Cho/Cr peritumoral 1.255 ± 0.334 2.071 ± 0.95 1.279 ± 0.323 Cho/NAA tumoral 1.99 ± 0.86 7.81 ± 1.72 7.49 ± 2.03 Cho/NAA peritumoral 1.1 ± 0.2 2.806 ± 1.07 1.149 ± 0.207
no significant difference seen between primary high grade and metastatic tumors. These results matched those of Server et al.
(3)and Server et al.(21).
Lipid peaks were seen in High grade tumors and metastasis on both long TE (144 ms) and short TE (35 ms) sequences however the peaks were higher on short TE sequences. A sta-tistically significant difference between the presence of a Lipid peak was seen between high grade tumors and metastasis on both short and Long TE sequences. This agreed with Shokry
(16), Opstad et al.(22)and van der Graaf(23)who gave a pos-sible explanation for the elevated lipids in metastatic lesions as the cancer cells of different origin, contain mobile spectroscop-ically detectable lipids in their cell membrane, while cell cul-tures of tumors which do not lead to metastases do not exhibit these mobile lipids.
Lactate peak was seen on long TE sequences (TE 144) in 5 cases of GBM, 4 cases of AA and 2 cases of metastasis. Law et al.(24)reported presence of lipids and lactate peaks in high grade primary tumors. Lipid and lactate presence do correlate with necrosis in high-grade glioma and may also be used as an adjunct tool for differentiating glioma grades(24).
In conclusion, the diagnosis and grading of primary and secondary brain tumors and differentiating them from other focal intra-cranial lesions based on imaging procedures alone are still a challenging problem, based on the findings in this study it can be concluded that the combination of MRS and ADC calculation provides additive valuable information, rather than using each parameter on its own, helping in grad-ing of intra-cranial tumors leadgrad-ing to improved diagnosis and hence management and prognosis.
Conflict of interest
None declared.
References
(1)Inoue T, Ogasawara K, Beppu T, Ogawa A, Kabasawa H. Diffusion tensor imaging for preoperative evaluation of tumor grade in gliomas. Clin Neurol Neurosurg 2005;107(3):174–80. (2)Lee EJ, Lee SK, Agid R, Bae JM, Keller A, Terbrugge K.
Preoperative grading of presumptive low-grade astrocytomas on
MR imaging: diagnostic value of minimum apparent diffusion coefficient. AJNR Am J Neuroradiol 2008;29(10):1872–7. (3)Server A, Kulle B, Gadmar OB, Josefsen R, Kumar T, Nakstad
PH. Measurements of diagnostic examination performance using quantitative apparent diffusion coefficient and proton MR spectroscopic imaging in the preoperative evaluation of tumor grade in cerebral gliomas. Eur J Radiol 2011;80(2):462–70. (4)Tilgner J, Herr M, Ostertag C, Volk B. Validation of
intraoper-ative diagnoses using smear preparations from stereotactic brain biopsies: intraoperative versus final diagnosis-influence of clinical factors. Neurosurgery 2005;56(2):257–65 [discussion 65]. (5)Bulakbasi N, Kocaoglu M, Ors F, Tayfun C, Ucoz T.
Combi-nation of single-voxel proton MR spectroscopy and apparent diffusion coefficient calculation in the evaluation of common brain tumors. AJNR Am J Neuroradiol 2003;24(2):225–33. (6)Yamasaki F, Kurisu K, Satoh K, Arita K, Sugiyama K, Ohtaki
M, et al. Apparent diffusion coefficient of human brain tumors at MR imaging. Radiology 2005;235(3):985–91.
(7)Karatag˘ O, Karatag˘ GY, Uysal E, Can SM, Ertu¨rk M, Basßak M. Can magnetic resonance spectroscopy adequately differentiate neoplastic from non-neoplastic and low-grade from high-grade lesions in brain masses? Marmara Med J 2010;23(3):326–38. (8)Fayed N, Modrego PJ. The contribution of magnetic resonance
spectroscopy and echoplanar perfusion-weighted MRI in the initial assessment of brain tumours. J Neurooncol 2005;72(3): 261–5.
(9)Murakami R, Hirai T, Sugahara T, Fukuoka H, Toya R, Nishimura S, et al. Grading astrocytic tumors by using apparent diffusion coefficient parameters: superiority of a one-versus two-parameter pilot method. Radiology 2009;251(3):838–45. (10)Lee EJ, terBrugge K, Mikulis D, Choi DS, Bae JM, Lee SK, et al.
Diagnostic value of peritumoral minimum apparent diffusion coefficient for differentiation of glioblastoma multiforme from solitary metastatic lesions. AJR Am J Roentgenol 2011;196(1): 71–6.
(11)Pavlisa G, Rados M, Pavic L, Potocki K, Mayer D. The differences of water diffusion between brain tissue infiltrated by tumor and peritumoral vasogenic edema. Clin Imaging 2009; 33(2):96–101.
[12]Rollin N, Guyotat J, Streichenberger N, Honnorat J, Tran Minh VA, Cotton F. Clinical relevance of diffusion and perfusion magnetic resonance imaging in assessing intra-axial brain tumors. Neuroradiology 2006;48(3):150–9.
(13)Guzman R, Altrichter S, El-Koussy M, Gralla J, Weis J, Barth A, et al. Contribution of the apparent diffusion coefficient in perilesional edema for the assessment of brain tumors. J Neuro-radiol 2008;35(4):224–9.
(14)Martinez-Bisbal MC, Celda B. Proton magnetic resonance spectroscopy imaging in the study of human brain cancer. Q J Nucl Med Mol Imaging 2009;53(6):618–30.
(15)Chen J, Huang SL, Li T, Chen XL. In vivo research in astrocytoma cell proliferation with 1H-magnetic resonance spec-troscopy: correlation with histopathology and immunohistochem-istry. Neuroradiology 2006;48(5):312–8.
(16)Shokry A. MRS of brain tumors: diagrammatic representations and diagnostic approach. Egypt J Radiol Nucl Med 2012;43(4): 603–12.
(17)Chiang IC, Kuo YT, Lu CY, Yeung KW, Lin WC, Sheu FO, et al. Distinction between high-grade gliomas and solitary metastases using peritumoral 3-T magnetic resonance spectros-copy, diffusion, and perfusion imagings. Neuroradiology 2004; 46(8):619–27.
(18)Matteo Bendini EM, Feletti Alberto, Rossi Sabrina, Curtolo Stefano, Inches Ingrid, Ronzon Monica, et al. Primary and metastatic intraaxial brain tumors: prospective comparison of multivoxel 2D chemical-shift imaging (CSI) proton MR spectros-copy, perfusion MRI, and histopathological findings in a group of 159 patients. Acta Neurochir 2011;153(2):403–12.
Table 4 Showing lipid and lactate peaks on long TE 144 ms.
Lipid Lipid/lactate Lactate None Low grade (n= 11) – – – 11 High grade (n= 17)
GBM (n= 12) 4 2 5 1 AA (N= 5) – – 4 1 Mets. (n= 12) 8 1 2 1
Table 5 Showing lipid and lactate peaks on short TE 35 ms.
Lipid Lipid/lactate Lactate None Low grade (n= 11) – – – 11 High grade (n= 17)
GBM (n= 12) 8 4 – – AA (N= 5) – – 4 1 Mets. (n= 12) 10 2 – –
(19)Faria AV, Macedo Jr FC, Marsaioli AJ, Ferreira MMC, Cendes F. Classification of brain tumor extracts by high resolution 1H MRS using partial least squares discriminant analysis. Braz J Med Biol Res 2011;44:149–64.
(20)Liu ZL, Zhou Q, Zeng QS, Li CF, Zhang K. Noninvasive evaluation of cerebral glioma grade by using diffusion-weighted imaging-guided single-voxel proton magnetic resonance spectros-copy. J Int Med Res 2012;40(1):76–84.
(21)Server A, Josefsen R, Kulle B, Mæhlen J, Schellhorn T, Gadmar Ø, et al. Proton magnetic resonance spectroscopy in the distinc-tion of high-grade cerebral gliomas from single metastatic brain tumors. Acta Radiol 2010;51(3):316–25 [article].
(22)Opstad KS, Murphy MM, Wilkins PR, Bell BA, Griffiths JR, Howe FA. Differentiation of metastases from high-grade gliomas using short echo time 1H spectroscopy. J Magn Reson Imaging 2004;20(2):187–92.
(23)van der Graaf M. In vivo magnetic resonance spectroscopy: basic methodology and clinical applications. Eur Biophys J 2010;39(4): 527–40.
(24)Law M, Yang S, Wang H, Babb JS, Johnson G, Cha S, et al. Glioma grading: sensitivity, specificity, and predictive values of perfusion MR imaging and proton MR spectroscopic imaging compared with conventional MR imaging. AJNR Am J Neuro-radiol 2003;24(10):1989–98.