UNIVERSITY OF TAMPERE
Association of breast cancer symptoms
findings with the occurrence of breast
cancer
Deependra Singh
Master’s thesis
University of Tampere
School of Health Sciences
(Public Health)
University of Tampere
School of Health Sciences
SINGH, DEEPENDRA: ASSOCIATION OF BREAST CANCER
SYMPTOMS WITH THE OCCURRENCE OF BREAST CANCER
Master’s thesis, 63 pages
Supervisors: PhD, Adjunct Prof. Ahti Anttila and MD, PhD Nea Malila
Health Sciences (Public Health)
July 2013
Abstract
Background: In Finland, organized national mammography screening program has shown a decrease in mortality from breast cancer since its introduction in late 1980s. The incidence and mortality rate is rapidly rising in countries where regular screening program is not available. However, it is still not clear how much the presence of symptoms in screening exams increases the risk of breast cancer. We proposed a study to assess the association of earlier symptoms findings with the occurrence of breast cancer.
Method: A cross-sectional study was performed among women aged between 50 and 69 years who had breast cancer screening during the period 2006-2010. A total of 1.2 million mammography screening was performed and symptoms (lump, retraction, scar, secretion and mole) were reported by women and radiographer at the time of screening visit. Six thousand, four hundred and forty-five women were diagnosed with breast cancer. Breast cancer risk was calculated for each symptom using the odds ratios (OR) at 95% confidence intervals (CI) with or without interaction effect in logistic regression model. Moreover, tumor characteristics were linked with self-reported as well as radiographer reported symptoms.
Results: Women reporting of lump had an increased odds of breast cancer in both self-reported (OR = 7.23, 95% CI = 6.45 to 8.11) as well as in radiographer findings (OR = 6.74, 95% CI = 6.12 to 7.41). Similarly, retraction had 3-fold increased risk of breast cancer in self-reported and 2.14-fold increase in radiographer reported findings. Other symptoms
showed little increase in odds of breast cancer. The three-way interaction of symptoms (lump, retraction and scar) and the breast cancer risk was found higher in both self-reported (OR = 12.25, 95% CI = 2.93 to 51.12) as well as in radiographer reported (OR = 11.4, 95% CI = 4.63 to 28.09) symptoms. A lower sensitivity and higher specificity was found in self-reported and in radiographer self-reported symptoms.
Conclusion: Our findings reinforce the importance of fully evaluating the symptoms as a predictor of breast cancer. This study may be relevant for a large number of countries (without mammography screening program) to develop clinical breast examination as an alternative option in population-based breast cancer control, however, the impact may vary with study settings and availability of screening and diagnostic services.
Key words: Symptoms, screening, lump, scar, retraction, clinical breast examination, breast self-examination, tumor characteristics
Contents
Abstract ... 2 List of Figures ... 5 List of Tables ... 6 Abbreviations... 7 1. INTRODUCTION ... 8 2. LITERATURE REVIEW ... 11 2.1 Common breastproblems ... 11 2.2 Screeningtechniques ... 11 2.3 Symptoms of breastcancer ... 132.4 Screen detected versus symptomatic breast cancers outside screening ... 16
2.5 Mass screening versus out-patient clinics ... 19
2.6 Recall rate, screening mammography, sensitivity and PPV ... 19
3. STUDY AIMS ... 21
4. MATERIALS AND METHODS ... 22
4.1 The Finnish Cancer Registry as a source of data ... 22
4.2 Selection of the study population and study variables ... 22
4.3 Ethical considerations ... 23
4.4 Measurement of variables ... 23
4.5 Statistical analysis ... 24
4.6 Clinical decision tree... 26
5. RESULTS ... 28
6. DISCUSSION ... 49
6.1 Significance of the study ... 53
6.2 Limitations of the study ... 54
7. CONCLUSION ... 56
Acknowledgement ... 57
List of Figures
List of Tables
Table 1: Characteristics of breast cancer reported by year of screening and age of screened
women ……….……….………..………..28
Table 2: Breast cancer risk among women reported as having symptoms, self-reported (sf) and radiographer reported (ip)……….………..30
Table 3: Breast cancer risk among women with symptoms using interaction effect, calculating odds ratios (ORs) and confidence intervals (CIs) ... 32
Table 4: Symptoms of breast cancer among women reported year of screening, calculating odds ratios (OR) and confidence intervals (CI)……….………... 33
Table 5: Symptoms of breast cancer among women reported by age at screening visit, calculating odds ratios (OR) and confidence intervals (CI) ... 35
Table 6: Two-way and three-way interaction of self-reported (sf) and radiographer reported (ip) symptoms on breast cancer risk ... 37
Table 7: Recall rate among screened women reported as having symptoms, self-reported (sf) and radiographer reported (ip) ... 40
Table 8: Referral rate among screened women reported as having symptoms, self-reported (sf) and radiographer reported (ip) ... 42
Table 9: Clinical validity of symptoms; sensitivity, specificity and PPV ... 44
Table 10: Tumor characteristics of varying size and grades ... 46
Table 11: Association of tumor size and breast cancer symptoms with breast cancer,
Abbreviations
BSE
Breast Self -Examination
BSW
Breast Test Wales
CBE
Clinical Breast Examination
CI
Confidence Interval
ERT
Estrogen Replacement Therapy
IARC
International Agency for Research on Cancer
IP
Inspection Palpation/Radiographer Reported
OR
Odds Ratio
PPV
Positive Predictive Value
pT
Primary tumor
pN
Regional lymph nodes
pM
Distant metastases
RR
Rate Ratio
SF
Self-reported
TNM
TNM Classification of Malignant Tumors
USA
United States of America
UICC
International Union Against Cancer
UK
United Kingdom
8
1.
INTRODUCTION
Globally, breast cancer comprises 23% of the 1.1 million newly diagnosed cancers every year (Parkin 2002). Breast cancer is the most common cause of death in women across the world, both in developed and developing countries (Ferlay 2010). In 2008, approximately 1.4 million women were diagnosed with breast cancer worldwide with corresponding 460000 deaths. In the same year, approximately 450,000 women were diagnosed with the disease in Europe with a corresponding 140,000 deaths. (GLOBOCAN 2008) The upward trend in incidence is seen in many European countries especially among women ≥50 years of age indicating mammography as a primary contributor of the trend (Ferlay 2010). Developed countries accounts for 55% of the global burden; whereas the incidence rate is rapidly rising in developing countries due to increase in the background risk and increasing life expectancy. Early detection of breast cancer through organized screening in unselected women with an average risk in target populations has been impressive in reducing the mortality from the disease. Moreover, awareness regarding the diagnosis of early signs and symptoms in symptomatic population with access to high-quality treatment service is another way of preventing the fatal outcome (WHO 2012).
Organized screening services for breast cancer have shown a decrease in mortality in many European countries and few other developed nations. In 1980s and early 1990s, several randomized control trials especially in northern European countries showed the effectiveness of screening for breast cancer, especially in reducing mortality and early detection of disease. In Finland, organized screening program reduced the mortality from breast cancer by approximately 20-28% among invited (Sarkeala et al. 2008). The mortality study after introduction of mammography screening in Denmark found a statistically significant 25% reduction associated with screening invitations (Olsen et al. 2005). Mortality study during past 3 decades in Sweden found a highly significant reduction (p-value <0.001) in breast cancer mortality among those women invited for screening (Yen et al. 2011). Breast cancer screening has also been challenged leading to diagnosis or unnecessary treatment (Olsen & Gøtzsche 2006).
9
Despite the age-standardized incidence for breast cancer is four times lower in low and middle income countries compared to high income countries (Igene 2002), the mortality to incidence ratio is markedly high reflecting the low survival of the cancer cases (Harford 2011). Prospective trials and observational studies on Clinical Breast Examination (CBE) have shown effectives in detecting cancer among asymptomatic women (Yip et al. 2008). Though the evidence is not sufficient, existing data shows that careful and competent CBE showed promising result in averting the deaths and detecting the lesions at an early stage for effective use of interventions (Weiss 2003). Breast Health Global Initiative has focused on breast cancer awareness and strengthening communication tools as an alternative for reducing the burden of disease in LMICs (Yip et al. 2008). In Finland, breast cancer has been continuously diagnosed as the most frequent cancer among women since 1960s, an age-standardized incidence of 94.6 per 100000 women (Finnish Cancer Registry, 2012), and accounted for 16.1 % of all cancer deaths in women from 2006-2010 (Nordcan 2012).
However, screening by mammography with appropriate management services for the women with the positive test has been a costly method of diagnosis and therefore, in spite of the lack of sufficient evidence in reducing mortality by CBE and BSE (Breast Self-Examination), improved breast cancer outcome and survival though early detection of tumors remains a corner stone of breast cancer control. We assumed that there should be some kind of linkage between symptomatic findings at the time of screening with the occurrence of breast cancer. No study till date, has measured the association of earlier symptomatic findings and the occurrence of breast cancer among women screened through the organized screening program in Finland, and there are very few earlier reports from other programs. Radiographer performs clinical examination during the screening visit and also records symptoms reported by the screened. Some of the symptoms traits in this clinical examination may also be needed for the interpretation of images. In addition, the radiologist palpates findings at the recall visit. Describing symptoms in screen-detected breast tumors can provide clues to understand better the natural history of disease. Findings from the study could convey an important message for the clinicians (radiologists) about
10
symptoms of breast cancer and might help in making rational decision regarding the further investigation (recall or referral, if needed), which indeed improves the unnecessary diagnosis or reduce false positive cases. Moreover, for developing countries, where the facility for detecting cancer at an early stage is not possible, symptomatic findings can be used as an indication for early diagnosis of disease which could prevent the women from late stage presentation of disease. We proposed a study to measure the association between breast cancer symptoms, self-reported and/or radiographer reported and the occurrence of breast cancer. We also examined the clinical validity of the symptoms as well as the association between symptoms and tumor characteristics.
11
2.
LITERATURE REVIEW
2.1. Common breast problems
Though the exact causes of breast cancer are unknown, the disease occurs when the malignant cells form a tissue in the breast and passes through various stages to cause the disease. Most commonly, when women feel symptoms of breast pain, secretion or breast lump she consults a physician. The possibility of having breast cancer varies with the age of women and the presenting breast complaints. Breast lump is the growth of tissue in the breast and described as a mass, swelling or thickness of breast. Most of the times breast lump results from noncancerous (benign) conditions however sometimes it is seen as a sign for breast cancer (MedlinePlus 2013). Breast pain more frequently occurs in pre-menopausal women and hormonal factor is suggested as its etiology however in post-menopausal women the etiology is unknown. Nipple discharge, usually occurs due to benign process, has been reported in 10 to 15 percent of women with benign breast disease and 2.5 to 3 percent of women with breast cancer. Patients with spontaneous or unilateral nipple discharge are usually referred for surgical evaluation. (Morrow 2000)In vast majority of the cases, retraction usually occurs as a result of nipple ducts malformation and sometimes due to the inflammation in the breast and breast diseases such as breast hypertrophy. Retraction may present in one or both sides of the breast in 2 to 10 percent of the women (BreastAugmentation 2013). A scar is a star-shaped breast mass most often benign or may be precancerous or contain a mixture of tissue, including hyperplasia, atypia or cancer or sometimes it causes breast pain. If the scar is rather large it may appear on the screening mammogram (Breastcancer 2011).
2.2. Screening techniques
Mammography is a clinical tool to detect breast cancer either through screening asymptomatic women or by examining symptomatic patients. High quality mammograms, a
12
primary screening tool in developed countries, are proven to detect cancer at an early stage with minimal exposure of the women to radiation (IARC 2002). However, because of the high cost it is rather a cost-ineffective choice for developing countries. Women with cancerous tumors detected by mammography screening have better distant disease-free survival and have histological and biological features with relatively low malignant potential compared with tumors detected between mammography screening rounds or
tumors found outside of screening (Joensuu et al. 2004). Therefore, screening enables the
detection of breast cancers at an earlier stage of disease. It is now well documented that screen-detected cancers are generally smaller, of lower grade and less likely to have axillary lymph node involvement (Weaver et al. 2006).
Clinical Breast Examination by health care provider includes a visual examination and carefully feeling the entire breast. CBE is an important tool of screening for women who do not get access to mammography screening. Though the effectiveness in reducing mortality is not known (Sankaranarayanan et al. 2011), CBE can serve as an opportunity for the health care providers to raise awareness about various aspect of breast cancer (Smith et al. 2003)improve access to care. Evidence on the additional benefit of clinical breast examination to the mammography screening rather than mammography alone is insufficient (U.S. Preventive Services Task Force 2009). Screening by CBE in community based study showed however that cancer cases are frequently missed by CBE which ultimately prove to be lethal (Fenton et al. 2005). More importantly, lower sensitivity of CBE was found by several community-based studies in United States (Fenton et al. 2005; Bobo et al. 1999; Oestreicher et al. 2002).
Breast Self-Examination (BSE) is a technique that women can monitor changes in her breast which may contribute to early detection of the cancer followed by further investigation (Erskine & Crowe 1998). BSE necessitates regular inspection, with a diary. Breast Self-Examination study in a cohort of 28,785 women in Finland found lower breast cancer mortality (RR of 0.75) (Gastrin et al. 1994). Though there is only little evidence on
13
mortality reduction by BSE, there is always a chance or option of detecting the palpable mass at an early stage of the disease (Sauter & Daly 2010; Foster et al. 1978).
2.3. Symptoms of breast cancer
Clinical breast examination was done in a population based study of 2,879 self-selected women with breast complaints. The aim was to identify the risk of breast cancer among women in all ages. Breast lump was most common in patients who were above 40 years of age and pain was most common among patients below 40 years of age (p-value less than 0.01). Eleven percent of the women had histological confirmed breast cancer whereas 16% of the patients who had breast lump found to have breast cancer. Similarly, breast cancer was found in 12% of the patients with nipple discharge and 3.2% of the patient with breast pain. Cancer detection rate was significantly higher in older age group (31.2% in above 55 years of age) and less than 1% in women below 40 years of age (p-value less than 0.01). Patient above 55 years with complaints of lump were three times higher risk of breast cancer (95% CI= 1.5-6.3). No increased relative risk was found in patients below 40 years of age (Lumachi et al. 2002).
A cross-sectional survey was performed in a stratified sample of general population in Denmark. A total of 13,777 women aged 20 years and above were randomly selected to investigate the possible association between socio-economic and demographic determinants and reporting of cancer alarm symptoms within the preceding 12 months. One or more cancer alarm symptoms were reported in 2098 (15.7%) participants with the mean age of 49.7 years. Four hundred and eleven participants (3.3%) reported lump in the breast, 940 participants (6.5%) reported cough for more than 6 weeks, 307 participants reported blood seen in the urine, and 713 participants (5.8%) reported blood seen in the stool. Socioeconomic and demographic determinants were found to be associated with cancer alarming symptoms (Svendsen et al. 2012).
14
An observation study conducted among post-menopausal women between 1996 and 2001 who had either diagnostic (13524 women) or screening examination (110,323 women) and examined the association between self-reported symptoms and the risk of breast cancer. Symptoms were reported by 32% of the women who had a diagnostic examination, compared to 5% of women who had the screening examination. Women who reported symptoms were at higher risk of developing breast cancer compared to asymptomatic women, 13 versus 6 women per 1000 population per year, respectively. A reported lump, after adjusting for confounders, was significantly associated with increased risk of breast cancer in both diagnostic (OR= 2.8, 95% CI= 2.3-3.4) and screening examination (OR= 3.6, 95% CI= 2.6-5.0). Nipple discharge showed a small increase in the risk of breast cancer in the diagnostic and screening examination (OR= 1.5 and 1.8 respectively) whereas pain and other symptoms showed no increased risk of breast cancer. Lump was the most predictive symptom of breast cancer (136 per 1000 women per year in diagnostic exam and 36 per 1000 women per year in screening exam) among women with prior examination compared to asymptomatic women (15 per 1000 women per year in diagnostic exam and 2 per 1000 women in screening examination) who had prior examination (Aiello et al. 2004).
A study in USA used mammography registries as the data source to evaluate the performance of diagnostic mammography among women with or without symptoms of breast cancer. Of the 41,427 women analyzed 1,598 were diagnosed with breast cancer and carcinoma in-situ. Lump was diagnosed in 72.2% women with a diagnosed breast cancer while only 47.4% of the women reported that lump was not diagnosed with breast cancer. Similarly, the reporting percentage as having any symptoms were higher in women with breast cancer than in women without breast cancer, 83.6% versus 75.6% respectively. Women with breast lump and lower breast density showed higher sensitivity (p-value=0.039 and 0.016 respectively) but not significant with age (p-value=0.099) however specificity was lower in women with increasing breast density and self-reported lump (Barlow et al. 2002). A case-control study in Italy was performed to evaluate the risk of breast cancer in symptomatic women compared to healthy and symptomatic non-screened women without breast cancer. Multivariate analysis using logistic regression model
15
adjusted for age showed covariates; no pregnancy, first birth greater than 30 years of age, use of estrogen replacement therapy (ERT) were significantly correlated (p-value <0.01) with breast cancer onset with relative risk of 5.25, 2.47 and 5.56 respectively (Lumachi et al. 2002).
A cross-sectional study in Australia was conducted among women age 40 years and above between 1st January 1994 and 31st December 1994. The study included 106826 women who first visited for breast examination by mammography through organized screening program. 9.7% of the women were symptomatic where 2.6% reported a lump or blood stained or watery nipple discharge (referred as significant symptoms) and 7.1% reported breast pain or tenderness (referred as other symptoms). The sensitivity was 80.8% in women with significant symptoms and 60% in women who had other symptoms. The specificity was comparatively higher in women with other symptoms than with significant symptoms, 95.4% versus 73.7% respectively (Kavanagh et al. 2000). A study in USA analyzed the mammogram data of 59321 women aged 25 years and above in 2 years’ time, from January 1996 to December 1997. Seventy-two percent of the women reported some kind of symptoms in the breast. The most frequent symptom reported by women was breast lump (52.3%) however the percentage decreased with age from 63.5% in women aged 25-44 years to 36.5% in women aged 65 years or greater. Nipple discharge was reported by 7.6% of the women (Geller et al. 2002). A retrospective cohort study on breast symptoms in UK was conducted among 2,400 women aged 40 to 69 years, who come for health maintenance organization in 10-year period. Sixteen percent of the women were presented with breast symptoms during 10 years period. The screening rate was lower in women before they were presented with symptoms but increased afterwards. Twenty-seven of the population was referred for the further investigation and cancer was detected in 6.2% of the patients (Barton & Elmore 1999). A retrospective analysis of 2,561 symptomatic women was done to see the correlation between breast complaints and risk of developing breast cancer in Italy. Breast pain was most common in women aged 40 years or below whereas breast lump was common in women greater than 55 years of age. Cancer was developed in
16
10.6% of the women. There was no correlation between breast lumps or nipple discharge and breast cancer (Lumachi et al. 2002).
A correlation analysis of breast complaints with age and breast cancer was done in 2,000 patients who made complaints of breast symptoms for the first time. Initially, 50% of the patients complained about breast lump, 6% complained breast pain, 4% complained nipple discharge and 8% complained of other symptoms. One-hundred and forty-seven cancer cases were identified among 1,889 women from whom follow-up information was available. Breast cancer was diagnosed in 16.1% of the patients aged 50 years or older while only 4% of the patients’ age between 30 years and below 50 years had cancer. Most of the patients (92%) referred to breast surgery did not have malignancy (Seltzer 1992). A study conducted to assess the relevance of reported symptoms in breast cancer screening program in UK identified 1,394 women as having significant symptoms between 1991 and 1996. Majority of the women complained of a lump (54%), 18% complained pain and 6% complained nipple discharge. Two hundred and sixty-two women were recalled because of the mammographic abnormality whereas 498 women who had symptoms and benign mammograms were recalled. Of these, 7 were diagnosed with breast cancer who previously complained of breast lump (Williams et al. 2002).
2.4. Screen detected versus symptomatic breast cancers outside screening
A comparative study among 767 patients (103 cases of screening detected and 664 symptomatic cases detected outside screening) on screen detected and symptomatic breast cancer patient was done in two affiliated high volume institution in Singapore. Eighty-nine percentage of the symptomatic group was presented with palpable lump compared to 40% in the screening group. In-situ carcinoma was found higher in the screening group compared to symptomatic, 31% and 14.3% respectively. The median size of invasive cancer was significantly lower (p-value ≤0.001) in screening group (18mm) than that in the symptomatic group (23mm). Invasive cancer was detected in 23.9% of the screen detected
17
women with tumor size of 10 mm or less compared to 14.4% in the symptomatic group (p-value=0.06). Similarly, screening detected cancer had less frequent lymph node involvement (35.2 versus 45%), lower stage(95 versus 83.2 for stage 0-2, p=0.005), histological grade 1 and 2 (70.9 versus 60%) and lower incidence of lympho-vascular invasion (14.1 versus 36.9%) compared to symptomatic cancers. Fourteen patients had disease recurrence, of whom 28.6% had loco-regional recurrence while 71.4% had distance sites (Chuwa et al. 2009).
A nested case control study was performed in Spain among 291 women diagnosed with breast cancer and who had undergone surgical resection in a hospital between 1996 and 2007. The mean size of tumor was significantly smaller (1.62±0.14 versus 2.68±0.15, p-value <0.001) in screen detected women than in symptomatic women. Similarly, screened women had a lower rate of axillary lymph node metastases (22.3 versus 48.9%, p-value <0.001) and a higher percentage of in-situ carcinoma (11.4 versus 1.5%, p-value <0.001) (Redondo et al. 2012).Another comparative study in UK by Gibbs (1985) found 31% of the screened patients with in-situ carcinoma compared to 7% in the unscreened population. Likewise, 26% of the screened patients had cancer less than 2 cm compared with 52% in the unscreened group.
Similar study in West Midlands, UK compared invasive breast cancer characteristics in 19411 screen-detected and symptomatic women between 1988 and 2004. The mean size of the tumor was 16.5 mm in screened women compared to 26.1 mm in symptomatic women (P< 0.0001). Screened women had a lower rate of lymph node metastases (27% versus 48.1%, P< 0.001) and lower percentage of grade-3 carcinoma (20.7% versus 44.7%, P<0.001) compared to symptomatic women (Allgood et al. 2011). Similar findings were found by Bucchi et al. (2005) while studying symptomatic and clinical breast cancer during the period between 1988 and 1999. Screening cases were more favorable to smaller tumor size (73% versus 48% in tumor ≤ 17mm, p-value= 0.000) and lower lymph node involvement (23% versus 40%) than clinical breast cancers. The proportion of node
18
positive cases was positively associated with tumor size (p-value= 0.000) in both screen-detected and clinical breast cancer.
Rajakariar and Walker (1995) studied 107 invasive carcinomas detected by Leicestershire Breast Screening Service (UK) during the period 1990-92. Mammographic screening group were in higher proportion in lower grade class (grade 1- 30% versus 15%, grade 3- 9% versus 37%) and lower frequency of lymph node metastases (6.5% compared with 55%) compared to symptomatic group. Thirty-six percent of the screened detected carcinomas were 10 mm or less in diameter compared to 1.4% in symptomatic group. Another study in UK studied 1379 women diagnosed with invasive breast cancer found that screening group had smaller breast cancer size compared to the symptomatic group (85% and 59% respectively for tumor size ≤ 2 cm, p-value <0.0001). Tumors detected though screening were of lower histological grade (34 versus 23% for grade 1, p-value <0.0001) and less likely to have lymph node involvement (25 versus 40%, p-value <0.0001) compared to the tumors detected in symptomatic group (Dawson et al. 2009).A comparative study in Korea showed that screen-detected cancers were associated with smaller tumor size, less lymph node involvement, earlier stage, and reduced mortality compared with symptomatic breast cancer (p-value < 0.001) (Kim et al. 2012).
In 2004, a study by Joensuu and colleagues found that tumors of 10 mm or smaller in diameter were higher among those detected by screening compared to the tumors detected outside of screening (38% versus 14%), and were less commonly associated with axillary lymph nodes metastases (21 versus 35%, p-value <0.01). Similarly, higher grade (Grade 3) tumors were less common in screening detected breast cancers compared to outside of screening (13 versus 22%). A comparative study among symptomatic and asymptomatic breast cancers in Verona, Italy (with no organized public screening program) found that symptomatic breast cancer cases were detected more in higher grading class and with larger tumor size than asymptomatic cancers (grade 1- 9.6 versus 21.2%, grade 3- 33.7 versus 9.6; T1- 57.4 versus 82.6%, T2-39.4 versus 16.6%, T3- 3.2 versus 0.8%) (Molino et al. 2000).
19
2.5. Mass screening versus out-patient clinics
A research group in Tokyo, Japan studied 2,170 breast cancer patients (728 patients detected by mass screening and 1450 patients found in out-patient clinics) from clinical and pathologic records of Japan Mammary Cancer Society found that earlier stage were significantly more common in patient detected by mass screening (stage I- 40.9% versus 28.7% and stage III- 9.3% versus 14.6%) as well as tumor size was significantly smaller among mass screening group than in out-patient clinics group (Tis, T0 plus T1- 38.7% versus 29.7% and T4- 3.6% versus 7.7%). Subjective symptoms (mainly breast lumps, nipple discharge and pain etc.) was present in 66.5% of the patient detected by mass screening compared to 98.2% of the patients in outpatient clinics (p-value <0.01). Breast Self-Examination (BSE) and fortuitous discovery of tumor masses was more common in patient detected by mass screening (p-value <0.01) (Ota et al. 1989).
2.6. Recall rate, screening mammography, sensitivity and PPV
A study conducted in Finland assessed the quality of mammography screening program using data of 10 screening centers from 1991-2000 among 100,000 women aged 50-64 years. The cancer detection rate for first time screening and subsequent screening women was 0.44% and 0.36% respectively whereas PPV of mammography was 9.6% and 15.8% respectively. Breast cancer by surgical biopsy was detected in 50% of the women who had first time screening and 70% in subsequent screening. Among the centers the recall rate in the subsequent screening varied 1% to 3.6% and cancer detection rate varied from 0.30% to 0.43%. The benign to malignant ratio in first and subsequent screening was 1:1 (range 0.5-1.8:1) and 0.4:1 (range 0.3-0.8:1) (Sarkeala et al. 2004).
Another study on cancer detection and recall rate by Harvey and colleagues (2003) 25,369 women in USA found overall recall rate of 14.2%. The cancer detection rate in double interpretation mammography was 5.6 per 1000 and 5.3 per 1000 in screening mammograms without double interpretation, a relative increase detection of 6.3% as a result of second
20
reviewer, while sensitivity increased from 74.4% to 79.4.Higher sensitivity was found in a cross-sectional study in northern California by Kerlikewoske and colleagues (1996). Sensitivity was 98.4% in women aged 50 years and older with primarily fatty breast whereas 81.4% sensitivity was found in younger women aged below 50 years. Similarly, for dense breast sensitivity was 83.7% for older women and 85.4% for younger women.
Community based studies in United States found rather low sensitivity of CBE. Fenton et al. (2005) studied asymptomatic women diagnosed or died of breast cancers in five states of USA found sensitivity of 21.6% (CI 18.1% to 25.6%). Another national level study using CBEs data between 1995 and 1998 found overall sensitivity, specificity and PPV of 58.8%, 93.4% and 4.3% respectively. However, sensitivity fell down when analyzing the data among asymptomatic women (sensitivity 36.1% and specificity 96.2%) (Bobo et al. 1999).
A sensitivity study of CBE conducted between 1988 and 1994 in USA found a increase in sensitivity with increase in tumor size (17% for tumors size ≤5 mm and 58% for tumors size ≥21 mm, adjusted p for trend < 0.001) (Oestreicher et al. 2002). A preliminary findings of cluster randomized control trail on breast cancer screening by CBE in India showed moderate sensitivity of 51.7% (CI= 38.2% to 65.0%) and high specificity of 94.3% (CI= 94.1% to 94.5%) but low PPV (1%) and high false positive value (5.7%) (Sankaranarayanan et al. 2011).
21
3.
STUDY AIMS
The main aim of the study was to assess the association of symptoms findings with the occurrence of breast cancer among screen detected women under the organized national breast cancer screening program of Finland.
The specific aims were:
o To compare symptoms of breast cancer among women by age and year of screening.
o To find out the test positivity and referral rate among women with and without symptoms.
o To analyze the clinical validity of the symptoms among women with and without symptoms.
o To identify the difference in tumors characteristics among women, with and without symptoms, detected as having breast cancer.
22
4.
MATERIALS AND METHODS
This study is based on the breast cancer screening data provided by Finnish Cancer Registry collected between the year 2006 and 2010.
4.1. The Finnish Cancer Registry as a source of data
Finnish cancer registry receives the information on breast cancer screening program from the screening centers involved in the program. Registration is based on the law and decree on personal data in the health-care system, 1989; and the respective recommendations published by the National Research and Development Centre for Welfare and Health (Finnish Cancer Registry 2013).The mass screening registry, a section of Finnish Cancer Registry, maintains the national database of the screening and evaluates the impact of screening on mortality as well as the quality of the program. The unique personal identification number of each individuals helps to eliminate duplicate records.
4.2. Selection of the study population and study variables
National breast cancer screening age group (50-69) comprises 26.76% of total female population of Finland. The municipality organizes the screening program biannually and free of charge to all women aged between 50 and 69 years at especially organized breast cancer screening units. Women are recalled for further assessment by additional mammography, ultrasound or other screening techniques if the first mammogram is inconclusive. If the results after the further assessment are still positive, women are referred to surgery and, biopsy with open surgery is performed as the first step. Information about screening episode up to primary surgical treatment is gathered from the screening centers based on the information provided in the screening process. For the current study, information about the women aged 50-69 years who had breast cancer screening between
23
the year 2006 and 2010 were chosen. The study is totally based on the information recorded
in the mammography screening form filled
(http://www.cancer.fi/syoparekisteri/joukkotarkastusrekisteri/) for every woman who was screened during that period of time. Altogether 1,454,143 invitations were made during the period between 2006 and 2010, out of which 1,241,486 screening visits were made with a total attendants of 85.4%. 4,429 visits were excluded from our study because of the age limitations. Furthermore, 38,647 visits were excluded because of the incomplete information on either clinical examination of breast or self-reported symptoms. The final data set contains 1,198,410 screening visits which includes 331,589 women from all over Finland.
Considering the purpose of the study, five variables were selected to see the association of the symptoms with the breast cancer outcome. Information about the symptoms was reported by the women as well as by the radiographer. Symptoms (lump, retraction, scar, secretion and mole) as well as age of the screened women and year of screening were selected as covariates whereas breast cancer is considered as the outcome (dependent) variable. Moreover, the tumor characteristics (tumors size and grades) were linked to the covariates, especially the symptoms variables.
4.3. Ethical considerations
Information on the breast cancer symptoms and cancer outcome, as well as population number and demographic variables were based on tabular statistical data only. Hence, no approval from the ethical committee was required.
4.4. Measurement of variables
Information on breast cancer symptoms and cancer outcomes were assessed by using the mammography screening form used by breast cancer screening clinics in Finland. At the
24
time women attends for screening, they complete a questionnaire or provide information by request from the radiographer giving details of the symptoms history in the past two months as well as the demographic information. The breast cancer symptoms were further assessed by doing inspection and palpation of the breasts by the radiographer. Information of symptoms was then recorded in the same mammography screening form previously filled by the women. Women who had symptoms in either or both sides of the breast were considered as symptoms, may be the self-reported or radiographer reported symptom.
Breast symptoms were dichotomized as the value 1 indicates ‘symptom’ and 0 indicates ‘no symptom’. The outcome of breast cancer were categorized as; in-situ and invasive as ‘malignant’, and benign as ‘no malignant’. Age of the screened women were categorized into 4 groups as ’50-54years’, ’55-59 years’, ’60-64 years’ and ’65-69’ years respectively. To do the trend analysis of symptoms with age, age-groups were made as continuous variables as age-group 50-54 years indicate ‘0’, 55-59 years indicate ‘1’, 60-64 years indicate ‘2’ and 65-69 years indicate ‘3’. Similarly, to do trend analysis of symptoms with year, year categories were made as continuous variables as year 2006 indicate ‘0’, 2007 indicate ‘1’, 2007 indicate ‘2’, 2008 indicate ‘3’, 2009 indicate ‘4’ and 2010 indicate ‘5’. In classifying histological confirmed tumors four categories of tumor size were made; ‘less than 10mm’, ‘10-19mm’, ‘20-49mm’ and ‘50-150mm’. Moreover, tumors were classified following the PTNM classification of tumors published by International Union Against Cancer (UICC) in 2002.
4.5. Statistical analysis
Statistical analysis was carried out using Stata version11.0. Two-sided p<0.05 was considered as to be statistically significant. A logistic regression model was used to calculate crude and adjusted odds ratios (OR) with 95% confidence interval (CI) using Wald statistics for individual terms. The univariate logistic regression model was used to estimate the odds ratios with 95% CI for association of symptoms findings with the
25
occurrence of breast cancer. For calculating the interaction effects and trend analysis likelihood ratio statistics was used. Symptoms were further stratified by age of the screened women and year of screening, and estimated the odds ratios with 95% CI on the occurrence of breast cancer. The association of symptoms with the recall of women who had mammography was estimated using univariate logistic regression model calculating the odds ratios with 95% CI. Similarly, women with symptoms status and referral cases for further assessment were put into a logistic regression model to estimate the odds ratios with 95% CI.
A two-way interaction effect (individual and combined effect) between the self-reported and radiographer reported symptoms, and the breast cancer risk was estimated using the odds ratios with 95% CI. Moreover, a three-way interaction effect (individual and combined effect) with all possible combination of the symptoms, however separately for self-reported and radiographer symptoms, were used to estimate the breast cancer risk calculating the odds ratios and 95% CI. Association of breast cancer symptoms and tumor characteristics were assessed by calculating odds ratios with 95% CI.
Sensitivity is the number of women with screen detected malignant (invasive) cancers and who had symptoms (true positives) divided by the total number of malignant (invasive) cancer cases (true positive and false negative). Specificity is the number of women without symptoms and no malignant cancer cases (true negatives) divided by the total number of no cancer cases (true negative and false positive). These measures of sensitivity and specificity are the direct measures of the clinical validity of symptoms and are expressed in percentage (%). Confidence interval for sensitivity and specificity was produced with the Wilson score method (Newcombe 1998). Positive predictive value is the likelihood of being detected as malignant cancer among those who had symptoms, when referred for histological confirmation (true positive cases divided by the sum of true positive and false positive cases). Confidence interval for positive predictive value was calculated using the method described by Simel and colleagues (1991). Correlation coefficient was calculated to see the
26
extent to which self-reported and radiographer reported symptoms were related. The correlation coefficient of lump, retraction and scar was 0.632, 0.382 and 0.788 respectively.
4.6. Clinical decision tree
The figure below shows the breast cancer screening process of the national breast cancer screening program in Finland. The result of the study is based on the information collected in the process of breast cancer screening and diagnosis.
27 Breast symptoms 1. Symptoms 2. Mammography (Home) (Home) 3. Recall 4. Referral 5. PAD behavior
Figure 1: Flow chart of Breast cancer screening and diagnosis process. Inspection palpation Self-reported
Yes No Yes No
Yes No Yes No
Yes No Yes No
Retraction Scar Secretion Mole
Lump
Presence Absence
28
5.
RESULTS
Table 1: Characteristics of breast cancer reported, by year of screening and age of screened women
Breast cancer
Cases (%) No cases (%) Total (%)
Screeningvisits 6545(0.55) 1191865(99.5) 1198410(100) Year of screening 2006 936(0.49) 191956(99.5) 192892(16.1) 2007 1195(0.51) 234109(99.5) 235304(19.6) 2008 1378(0.58) 236011(99.4) 237389(19.8) 2009 1511(0.56) 266636(99.4) 268147(22.4) 2010 1525(0.58) 263153(99.4) 264678(22.1) Age of women 50 - 54 1982(0.42) 467612(99.6) 469594(39.2) 55 - 59 1713(0.50) 337922(99.5) 339635(28.3) 60 - 64 2044(0.67) 304183(99.3) 306227(25.6) 65 - 69 806(0.97) 82148(99.0) 82954(6.9) Recall yes 6545(21.5) 23847(78.5) 30392(2.5) no 0(0.00) 1167688(100) 1167688(100) Referral yes 6540(80.8) 1553(19.2) 8093(0.75) no 4(≈0.00) 1073458(≈100) 1073462(100)
Table 1 shows the Breast Cancer incidence by screening year and age of screened women. The final data set contains 1,198,410 screening visits. Breast cancer was diagnosed in 6,545 (0.55%) women. In 2006, 192,892 screening visits were carried, out of which 936 (0.49%) were found to have cancer. In 2007, cancer cases went to 1,195 among those 235,304 women who were screened. In 2010, of the 264,678 women screened 1,525 women were detected with breast cancer. Similarly, breast cancer cases were high (2,044 cases) in
29
women age between 60 and 64 years and low (806 cases) in women age between 65 and 69 years whereas more screening visits (469,594 visits) were made by women of aged 50-54 years and less screening visits were made by older women (82,954 visits in age group 65-69 years). Of the 30,392 (2.54%) women recalled 6,545 had cancer and among the 8,093 women who were referred 6,540 were found to have cancer.
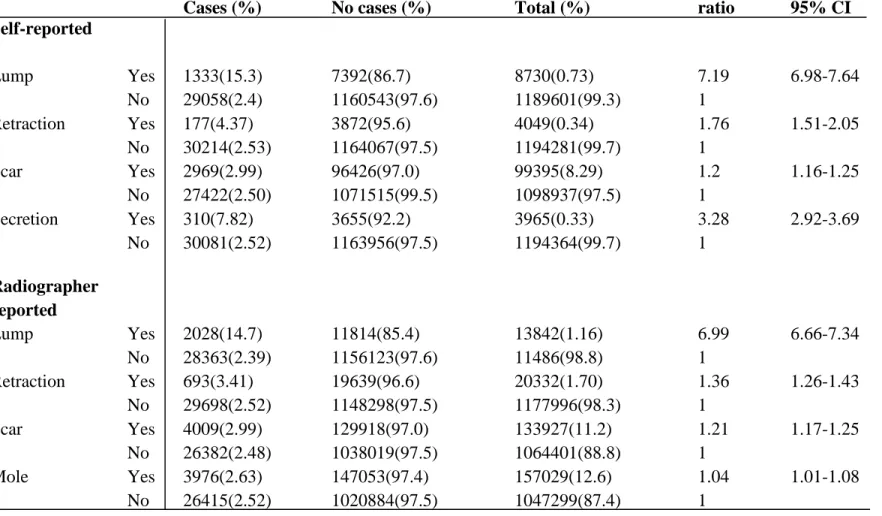
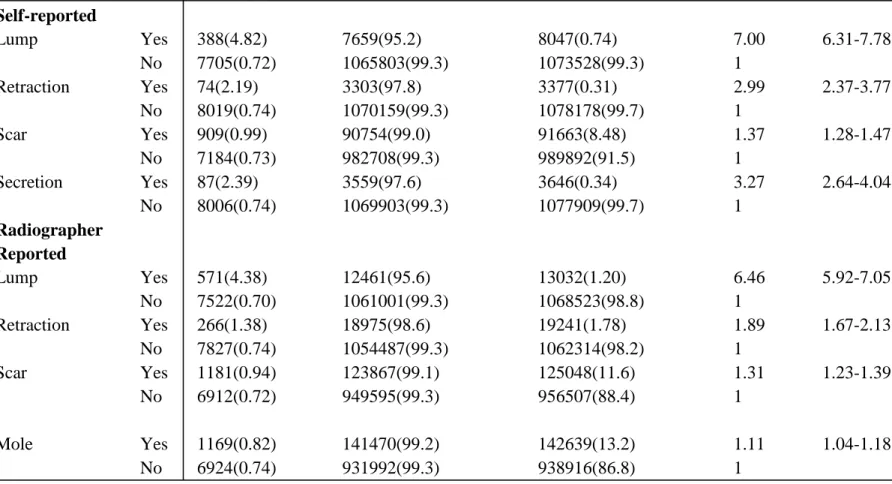
30
Table 2: Breast cancer risk among women reported as having either self-reported (sf) or radiographer reported (ip) symptoms
Breastcancer
Cases (%) No cases (%) Total (%)
Odds ratio 95% CI Self-reported Lump Yes 320(3.67) 8410(96.3) 8730(0.73) 7.23 6.45-8.11 No 6225(0.52) 1183376(99.5) 1189601(99.3) 1 Retraction Yes 67(1.65) 3982(99.35) 4049(0.34) 3.08 2.42-3.93 No 6478(0.54) 1187803(99.5) 1194281(99.7) 1 Scar Yes 697(0.7) 98698(99.30) 99395(8.29) 1.32 1.22-1.43 No 5848(0.53) 1093089(99.5) 1098937(91.7) 1 Secretion Yes 43(1.08) 3922(98.3) 3965(0.33) 2.00 1.48-2.71 No 6502(0.54) 1187862(93.5) 1194364(99.7) 1 Radiographer Reported Lump Yes 465(3.36) 13377(96.6) 13842(1.16) 6.74 6.12-7.41 No 6080(0.51) 1178406(99.5) 1184486(98.8) 1 Retraction Yes 232(1.14) 20100(98.9) 20332(1.70) 2.14 1.88-2.44 No 6313(0.54) 1171683(99.5) 1177996(98.3) 1 Scar Yes 920(0.69) 133007(99.3) 133927(11.2) 1.30 1.21-1.39 No 5625(0.53) 1058776(99.5) 1064401(88.8) 1 Mole Yes 963(0.64) 150066(99.4) 151029(12.6) 1.19 1.11-1.28 No 5582(0.53) 1041717(99.5) 1047299(87.4) 1
31
Women who reported as having symptoms, lump was reported in 8,730 screening visits. Of which, cancer was found in 320 women (3.67%). Whereas, 67 (1.65%) of 4,049 screening visits were retraction was reported, found to have cancer. Similarly, scar was reported in 99,395 screening visits. Out of which, cancer was found in 697 (0.7%) women. Secretion was reported in 3,965screening visits. Out of which 43 (1.08%) were found to have cancer. Women who reported lump were 7.23 times higher risk of developing breast cancer compared to women who did not report as having lump. Women reported retraction were 3.08 times higher risk of developing breast cancer compared to those who reported as having secretion and scar, higher risk of 2 times and 1.3 times respectively.
In inspection and palpation, lump was reported in 13,842 screening visits in which 465 (3.36%) women were found to have breast cancer. Retraction was reported in 20,332 women, out of which 232 (1.14%) were detected with cancer. Similarly, scar was reported in 133,927 screening visits and mole in 151,029, out of which cancer was detected in 920 and 963 women respectively. The risk of developing breast cancer was significantly higher (odds ratio= 6.54) in women reported as having lump. Women detected as having retractions were 2.14 times at higher risk of developing breast cancer compared to those who had scar or mole, 1.3 and 1.9 times.
32
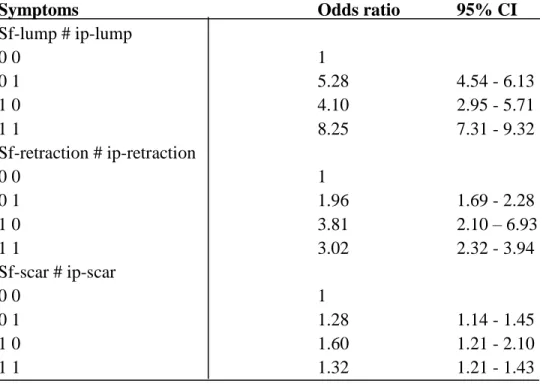
Table3: Odds ratios (ORs) and confidence intervals (CIs) for joint exposure to self-reported or radiographer self-reported symptoms
Symptoms Odds ratio 95% CI
Sf-lump # ip-lump 0 0 1 0 1 5.28 4.54 - 6.13 1 0 4.10 2.95 - 5.71 1 1 8.25 7.31 - 9.32 Sf-retraction # ip-retraction 0 0 1 0 1 1.96 1.69 - 2.28 1 0 3.81 2.10 – 6.93 1 1 3.02 2.32 - 3.94 Sf-scar # ip-scar 0 0 1 0 1 1.28 1.14 - 1.45 1 0 1.60 1.21 - 2.10 1 1 1.32 1.21 - 1.43
*sf= self-reported; ip= inspection palpation (radiographer reported); CI= confidence interval;
0= absence of symptom; 1= presence of symptom
Table 3 shows the breast cancer risk among women calculated using the interaction effect on self-reported and radiographer reported symptoms. The combined risk of developing breast cancer was 8.25 times higher in women where lump was reported by both women and radiographer compared to those who had no lump. The risk of self-reported lump was 5.28 times higher and for radiographer reported lump the risk was 4.10 times higher. Women with self-reported retraction were 3.81 times higher risk of developing cancer compared to the radiographer reported retraction where the risk was 1.96 times higher. Women who had self-reported and radiographer reported retraction the risk was 3.02 times higher whereas in case of scar, the combined risk of developing breast cancer was little higher (1.32 times) than those who had no scar.
33
Table 4: Odds ratios (OR) with confidence intervals (CI) for exposure to self-reported or radiographer reported symptoms reported by year of screening
Breast cancer risk Symptoms/Year Self-reported Radiographer reported Odds ratio 95% CI P-value for homogeneity Lump|total 8730 13842 lump|2006 1319 2304 8.54 6.19-11.8 lump|2007 1705 2680 6.70 4.90-9.12 lump|2008 1715 2626 9.00 6.94-11.7 lump|2009 1920 3007 8.94 7.00-11.4 lump|2010 2070 3225 7.93 6.19-10.1 0.10 Retraction|total 4049 20332 retraction|2006 516 3364 2.33 0.96-5.64 retraction|2007 705 3757 3.37 1.80-6.32 retraction|2008 947 4144 1.99 1.03-3.86 retraction|2009 959 4425 3.26 1.95-5.45 retraction|2010 921 4642 3.80 2.35-6.17 0.84 Scar|total 99395 133927 scar|2006 15516 20950 1.40 1.13-1.74 scar|2007 18845 26281 1.03 0.83-1.29 sacr|2008 19509 26432 1.41 1.19-1.69 scar|2009 23554 30366 1.34 1.14-1.58 scar|2010 21964 29894 1.35 1.44-1.59 0.81
34 Secretion|total 3965 secretion|2006 726 2.29 1.14-4.62 secretion|2007 879 1.35 0.60-3.01 secretion|2008 797 1.74 0.87-3.50 secretion|2009 722 2.49 1.33-4.65 secretion|2010 841 2.29 1.26-4.17 0.74 Mole|total 151029 mole|2006 27411 1.27 1.08-1.50 mole|2007 31239 1.25 1.07-1.46 mole|2008 30937 1.09 0.93-1.27 mole|2009 30327 1.18 1.01-1.44 mole|2010 31115 1.25 1.09-1.45 0.59
*CI= confidence interval; *no data on radiographer reported secretion; *no data on self-reported mole
Table 4 shows the number of self-reported and radiographer reported symptoms between 2006 and 2010, and the risk of breast cancer among screened women. Lump was reported in higher numbers in 2010 by women and the radiographer, 2,070 and 3,225 cases respectively. The risk of breast cancer in women having lump was 9 fold higher in 2010 and lower in 2007 (6.7 fold). Retraction was reported in higher numbers by women in 2009 (959 cases) and by radiographer in 2010 (4,642 cases) whereas the risk of breast cancer was higher in 2010 (3.8 fold) and lower in 2008 (1.99 ≈ 2fold). Women having scar was higher in 2009, 23,554 cases and 30,366 cases by women and radiographer respectively whereas the risk was higher in 2008 (1.41 fold) and was almost null in 2007 (1.03). Higher numbers (879 cases) of secretion cases were reported in 2007 but the risk was just 1.35 fold. Mole was reported in higher numbers in 2007, 31,239 cases with a risk of 1.25 fold.
35
Table 5: Odds ratios (OR) with confidence intervals (CI) for exposure to self-reported or radiographer reported symptoms reported by age at screening visit
Symptoms/Agegroup Self-reported Radiographer reported Odds ratio 95% CI P-value for homogeneity Lump|agegroup lump|50-54 4058 6142 8.93 7.34-10.8 lump|55-59 2228 3687 8.99 7.08-11.4 lump|60-64 1962 3202 7.80 6.14-9.91 lump|65-69 481 811 8.86 5.94-13.2 0.22 Retraction|agegroup retraction|50-54 1357 6611 2.92 1.72-4.95 retraction|55-59 1282 6223 2.68 1.61-4.47 retraction|60-64 1164 5855 3.06 1.96-4.78 retraction|65-69 245 1643 4.17 1.95-8.90 0.07 Scar|agegroup scar|50-54 31009 42871 1.08 0.91-1.29 scar|55-59 29507 39224 1.36 1.16-1.59 scar|60-64 30621 40639 1.24 1.08-1.42 sacr|65-69 8251 11193 1.48 1.19-1.83 0.01 Secretion|agegrp secretion|50-54 2081 1.49 0.86-2.57
36 secretion|55-59 943 1.91 0.99-3.68 secretion|60-64 721 2.96 1.74-5.03 secretion|65-69 220 3.37 1.58-7.18 0.21 Mole|agegroup mole|50-54 52734 1.19 1.05-1.36 mole|55-59 42885 1.05 0.91-1.21 mole|60-64 42343 1.15 1.02-1.30 mole|65-69 13067 1.30 1.09-1.56 0.28
*CI= confidence interval
Table 5 shows the number of self-reported and radiographer reported symptoms in age-group between 50-54 years and 60-69 years, and the risk of breast cancer among screened women. Lump was reported in higher numbers in age-group 50-54 years by women and the radiographer, 4,058 and 6,142 cases respectively and with a risk of 8.93 fold. The risk of breast cancer in women having lump was 8.99 (≈9 fold) times higher in age-group 55-59 years and lower in age-group 60-64 years (7.8 fold). Likewise, retraction was reported in higher numbers by women and radiographer in age-group 50-54 years, 1,357 cases and 6,611 cases respectively whereas the risk of breast cancer was higher in age-group 65-69 years (4.17 fold) and lower in age-group 55-59 years (2.68 fold). Similarly, scar was reported higher in age-group 50-54 years, 31,009 cases and 42,871 cases by women and radiographer respectively. The risk was higher in age-group 65-69 years (1.48 fold) and almost no additional risk in age-group 50-54 years (OR=1.08). Secretion cases were reported in higher numbers in age-group 50-54 years, 2,081 cases and a small risk of 1.49 fold. Mole was reported in higher numbers in younger age-group (50-54 years), 52734 cases and a small risk of 1.19 fold.
37
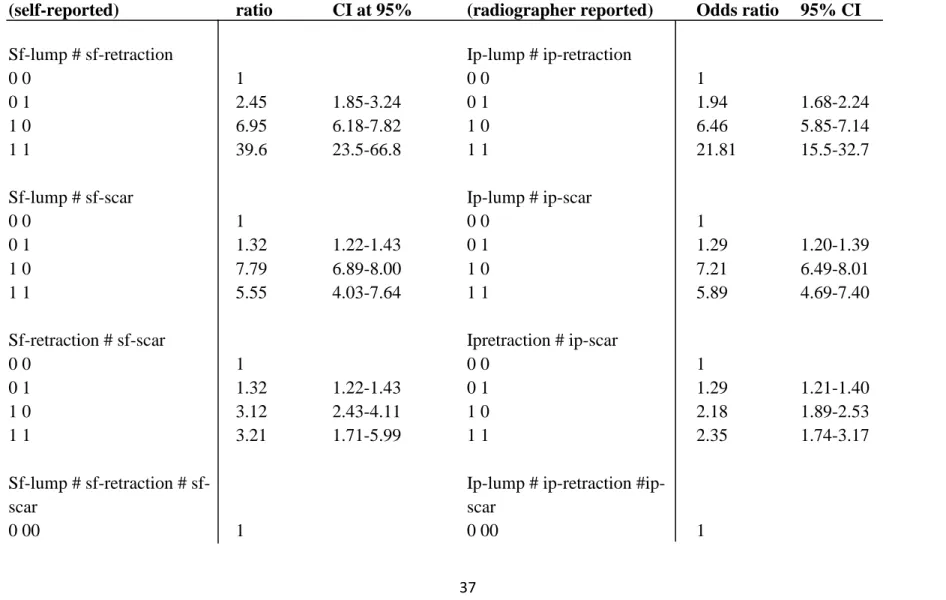
Table 6: Odds ratios (OR) with 95% confidence intervals (CI) for joint exposure to self-reported or radiographer reported symptoms Symptoms characteristics (self-reported) Odds ratio CI at 95% Symptoms characteristics
(radiographer reported) Odds ratio 95% CI
Sf-lump # sf-retraction Ip-lump # ip-retraction
0 0 1 0 0 1
0 1 2.45 1.85-3.24 0 1 1.94 1.68-2.24
1 0 6.95 6.18-7.82 1 0 6.46 5.85-7.14
1 1 39.6 23.5-66.8 1 1 21.81 15.5-32.7
Sf-lump # sf-scar Ip-lump # ip-scar
0 0 1 0 0 1
0 1 1.32 1.22-1.43 0 1 1.29 1.20-1.39
1 0 7.79 6.89-8.00 1 0 7.21 6.49-8.01
1 1 5.55 4.03-7.64 1 1 5.89 4.69-7.40
Sf-retraction # sf-scar Ipretraction # ip-scar
0 0 1 0 0 1 0 1 1.32 1.22-1.43 0 1 1.29 1.21-1.40 1 0 3.12 2.43-4.11 1 0 2.18 1.89-2.53 1 1 3.21 1.71-5.99 1 1 2.35 1.74-3.17 Sf-lump # retraction # sf-scar
Ip-lump # ip-retraction #ip- scar
38 0 0 1 1.32 1.21-1.43 0 0 1 1.29 1.19-1.39 0 1 0 2.46 1.81-3.34 0 1 0 1.95 1.66-2.29 0 1 1 2.82 1.40-5.68 0 1 1 2.26 1.65-3.10 1 0 0 7.46 6.58-8.45 1 0 0 6.87 6.16-7.67 1 0 1 5.42 3.90-7.51 1 0 1 5.79 4.57-7.33 1 1 0 58.79 33.0-104 1 1 0 26.52 18.3-38.3 1 11 12.25 2.93-51.1 1 11 11.4 4.63-28.1
*sf= self-reported; ip= inspection palpation (radiographer reported); CI= confidence interval *0= absence of symptom; 1= presence of symptom
39
Table 6 shows the breast cancer risk for joint exposure to self-reported or radiographer reported symptoms. The combined effect of self-reported lump and retraction showed a significant effect in the risk (39.6 fold) of breast cancer compared to those who do not have any of the symptoms. The risk of breast cancer among women who reported lump and scar was 5.55 times higher compared to those who reported none of the symptoms however lump alone had 7.79 fold risks. Women reported retraction and scar were 3.21 times higher risk of breast cancer. In three-way interaction women who reported all of the three symptoms were 12.25 fold higher risks however those women who reported lump and retraction but no scar were 58.79 fold higher risk of breast cancer.
The combined effect of radiographer reported lump and retraction showed a significant 21.8 fold increase in the risk of breast cancer compared to those who do not have any of the those symptoms. The risk of breast cancer among women who had lump and scar and reported by radiographer was 5.89 times higher compared to those who reported none of the symptoms however lump alone had 6.46 folds risk. Those women who were reported by radiographer as having retraction and scar were 2.35 times higher risk of breast cancer. In three-way interaction women who were reported by radiographer as having all of the three symptoms were 11.4 fold increased risks however those women reported as having lump and retraction but no scar were 26.52 fold increased risk of breast cancer.
40
Table 7: Recall rate among screened women reported as having symptoms, self-reported (sf) and radiographer reported (ip)
Recall
Cases (%) No cases (%) Total (%)
Odds ratio 95% CI Self-reported Lump Yes 1333(15.3) 7392(86.7) 8730(0.73) 7.19 6.98-7.64 No 29058(2.4) 1160543(97.6) 1189601(99.3) 1 Retraction Yes 177(4.37) 3872(95.6) 4049(0.34) 1.76 1.51-2.05 No 30214(2.53) 1164067(97.5) 1194281(99.7) 1 Scar Yes 2969(2.99) 96426(97.0) 99395(8.29) 1.2 1.16-1.25 No 27422(2.50) 1071515(99.5) 1098937(97.5) 1 Secretion Yes 310(7.82) 3655(92.2) 3965(0.33) 3.28 2.92-3.69 No 30081(2.52) 1163956(97.5) 1194364(99.7) 1 Radiographer reported Lump Yes 2028(14.7) 11814(85.4) 13842(1.16) 6.99 6.66-7.34 No 28363(2.39) 1156123(97.6) 11486(98.8) 1 Retraction Yes 693(3.41) 19639(96.6) 20332(1.70) 1.36 1.26-1.43 No 29698(2.52) 1148298(97.5) 1177996(98.3) 1 Scar Yes 4009(2.99) 129918(97.0) 133927(11.2) 1.21 1.17-1.25 No 26382(2.48) 1038019(97.5) 1064401(88.8) 1 Mole Yes 3976(2.63) 147053(97.4) 157029(12.6) 1.04 1.01-1.08 No 26415(2.52) 1020884(97.5) 1047299(87.4) 1
41
The above table shows the recall rate in women having symptoms either self-reported or radiographer reported. Out of the 8,730 screening visits by women who reported lump 1,333 (15.3%) cases were recalled whereas only 177 (4.37%) cases who reported retraction were recalled. 2,969 (2.99%) scar cases reported by women were recalled whereas 310 (7.82%) screening cases having secretion were recalled. Women who reported lump had 7.19 times higher chances of being recalled compared to those who did not report lump while retraction had only 1.76 times higher chances of being recalled. Women who reported scar had 1.2 times higher chances of being recalled however secretion had 3.28 times higher chances of being recalled compared to those who did not report symptoms. In radiographer reported symptoms, out of the 13,842 screening visits lump 2,028 (14.6%) cases were recalled whereas only 693 (3.41%) cases of retraction were recalled. Altogether 133,927 scar cases were reported by the radiographer out of which 4,009 scar cases (2.99%) were reported by women were recalled whereas 3,976 (2.63%) screening cases having mole were recalled. Radiographer reported lump had 6.99 (≈7) times higher chances of being recalled compared to those without lump while retraction had only 1.36 times higher chances of being recalled. Women who reported scar had 1.21 times higher chances of being recalled however there was very small difference (OR=1.04) in the chances of being recalled for those women who were reported as having mole.
42
Table 8: Referral rate among screened women reported as having symptoms, self-reported (sf) and radiographer reported (ip)
Referral
Cases (%) No cases (%) Total (%)
Odds ratio 95% CI Self-reported Lump Yes 388(4.82) 7659(95.2) 8047(0.74) 7.00 6.31-7.78 No 7705(0.72) 1065803(99.3) 1073528(99.3) 1 Retraction Yes 74(2.19) 3303(97.8) 3377(0.31) 2.99 2.37-3.77 No 8019(0.74) 1070159(99.3) 1078178(99.7) 1 Scar Yes 909(0.99) 90754(99.0) 91663(8.48) 1.37 1.28-1.47 No 7184(0.73) 982708(99.3) 989892(91.5) 1 Secretion Yes 87(2.39) 3559(97.6) 3646(0.34) 3.27 2.64-4.04 No 8006(0.74) 1069903(99.3) 1077909(99.7) 1 Radiographer Reported Lump Yes 571(4.38) 12461(95.6) 13032(1.20) 6.46 5.92-7.05 No 7522(0.70) 1061001(99.3) 1068523(98.8) 1 Retraction Yes 266(1.38) 18975(98.6) 19241(1.78) 1.89 1.67-2.13 No 7827(0.74) 1054487(99.3) 1062314(98.2) 1 Scar Yes 1181(0.94) 123867(99.1) 125048(11.6) 1.31 1.23-1.39 No 6912(0.72) 949595(99.3) 956507(88.4) 1 Mole Yes 1169(0.82) 141470(99.2) 142639(13.2) 1.11 1.04-1.18 No 6924(0.74) 931992(99.3) 938916(86.8) 1
43
Table 8 shows the referral rate in women either self-reported or radiographer reported symptoms. Out of the 8,047 screening visits by women who reported lump 388 (4.82%) cases were referred whereas only 74 (2.19%) cases who reported retraction were referred. 909 (0.99%) scar cases reported by women were referred likewise 87 (2.39%) screening cases having secretion were referred. Women who reported lump had 7 times higher chances of being referred compared to those who did not report lump while retraction had only 2.99 (≈3) times higher chances of being referred. Women who reported scar had 1.37 times higher chances of being referred however secretion had 3.27 times higher chances of being referred compared to those who did not report symptoms.
In radiographer reported symptoms, 571 (4.38%) lump cases out of the 13,032 were referred whereas only 266 (1.38%) cases of retraction were referred. 1,181 (0.94%) of the total scar cases reported by the radiographer were referred whereas 1,169 (0.82%) screening cases having mole were referred. Radiographer reported lump had 6.46 times higher chances of being referred compared to those without lump while retraction had only 1.89 times higher chances of being referred. Women who reported scar had 1.31 times higher chances of being recalled however women who were reported as having mole had 1.11 times higher chances of being referred.
44
Table 9: Clinical validity of symptoms; sensitivity, specificity and PPV
Lump Retraction Scar Secretion Mole
True positives 501 243 972 43 963 True negatives 1176698 1171147 1052622 1187862 1041717 False positives 15085 20636 139158 3922 150066 False negatives 6044 6302 5873 6502 5582 Sensitivity % 7.65 (7.04-8.32) 3.71 (3.28- 4.20) 14.8 (14.0-15.7) 0.66 (0.49-0.88) 14.7 (13.8-15.6) Specificity % 98.7 (98.7-98.8) 98.3 (98.2-98.4) 88.3 (88.3-88.4) 99.7 (99.6-99.7) 87.4 (87.3-87.5) Positive predictive value 6.05 (5.55- 6.59) 2.14 (1.89-2.43) 1.27 (1.20-1.36) 1.99 (1.48-2.69) 1.17 (1.10-1.24)
45
The above table shows the clinical validity of the symptoms in terms of sensitivity, specificity and positive predictive value. The sensitivity for women who had lump was 7.65% whereas in case of retraction the sensitivity was 3.71% sensitivity. The sensitivity for the women who had scar, secretion and mole was 14.8%, 0.66% and 14.71% respectively. Similarly, specificity was 98.7% for women who had lump and 98.3% for those with retraction. The specificity for women who had scar, secretion and mole was 88.3%, 99.7% and 87.41% respectively. The positive predictive value for women who had lump was 6.05% and for retraction the value was 2.14%. Those women who had scar, secretion and mole the positive predictive value was 1.2%, 1.99% and 1.17% respectively.
46
Table 10: Tumor characteristics of varying size and grades
Tumor characteristics Numbers (%) Invasive Size in histology
Less than 10 mm 1269(24.6) 10 - 19 mm 2566(49.7) 20 - 49 mm 1201(23.2) 50 - 150 mm 129 (2.50) Total 5165(100) Grade Well differentiated 1570(30.0) Moderately differentiated 2525(48.2) Poorly differentiated 1143(21.8) Total 5238(100) TNM classification pT pT0 1(0.1) pTx 3(0.3) pT1 944(98.0) pT3 15(1.56) Total 963(100) pN pN0 3535(68.2) pN1 1607(31.0) pN2 40(0.8) Total 5182(100) pM pM0 4218(83.9) pM1 33(0.7) pMX 773(15.4) Total 5024(100)
In-situ Size in histology
lessthan 10 mm 227(30.4)
10 - 19 mm 218(29.1)
47
50 - 150 mm 71 (9.49)
Total 748(100)
Benign Size in histology
Less than 10 mm 36(38.3)
10 - 19 mm 34(36.2)
20 - 49 mm 21(22.3)
50 - 150 mm 3 (3.19)
Total 94(100)
*TNM= TNM Classification of Malignant Tumors; pT= primary tumor; pT0= no evidence of primary tumor; pTX= primary tumor cannot be assessed; pT1= tumor 2 cm or less in dimension; pT3= tumor more than 5 cm; pN= regional lymph nodes; pN0= no regional lymph node metastasis; pN1= metastasis with 1-3 ipsilateral lymph nodes; pN2= metastasis with 4-9 ipsilateral lymph nodes; pM= distant metastases; pM0= no distant metastases; pMX= distant metastases cannot be assessed; pM1= distant metastases
Table 10 shows the size and grade of tumors in women who had either malignant or non-malignant outcome. In women with histological confirmed breast cancer, 2,566 (49.7%) women were found with the tumor size of 10-19mm whereas 129 (2.5%) of the women had tumor size of 50-150mm. 1,570 (30%) women with invasive cancer had well differentiated grades whereas 1143 (21.8%) women had poorly differentiated grades. According to pTNM classification, 944 (98%) women with invasive cancer had primary tumor size of less than 2 cm whereas 15 (1.56%) women had tumor size of more than 5cm. Similarly, 1,607 (31%) of the invasive cancer tumors had metastasis with 1-3 axillary lymph nodes involvement and 40 (0.8%) tumors had metastasis with 4-9 axillary lymph nodes involvement. 33 (0.7%) of the invasive cancer tumors had distant metastasis whereas 4,218 (83.9%) tumors had no distant metastasis. Out of the 748 histological confirmed in-situ carcinomas 445 (59.5%) tumors were less than 20 mm whereas 71 (9.49%) of the tumors were 50-150mm. Histological confirmed benign tumors were 91 altogether, out of which 70 (74.5%) were less than 20mm and 3 (3.19) were 50-150mm in size.
48
Table 11: Association of tumor size and breast cancer symptoms with breast cancer, calculating odds ratios (OR) and confidence intervals (CI)
Breast cancer Tumorsize in histology Cases No cases Odds ratio 95% CI Symptom|Tumor size in histology Odds ratio 95% CI <10 mm 1496 36 0.56 0.37-0.86 <10 mm 3.69 3.29-4.16 10-19 mm 2784 35 1.55 1.02-2.36 10-19 mm 4.14 3.70-4.63 20-150 mm 1633 25 1.08 0.68-1.72 20-150 mm 3.58 3.18-4.03
*CI= confidence interval *Symptom= breast lump
The above table shows the breast cancer risk among women with varying tumor size and who had breast lump. Breast cancer risk was significantly lower (OR= 0.56) in women who had tumor size of <10 mm compared to bigger tumor size. However, the risk increased significantly (OR= 3.69) among women who had lump and had tumor size of <10 mm. Similarly, breast cancer risk was 1.55 times higher in women with tumor size of 10-19mm compared to other tumor size. The risk increased even higher (OR= 4.14) when calculated among women having breast lump and tumor size of 10-19 mm. Breast cancer risk was 3.58 times higher in women who had tumor of 20-150 mm size and who were detected as having lump in the breast.