UNIVERSIDAD COMPLUTENSE DE MADRID
FACULTAD DE INFORMÁTICA
DEPARTAMENTO DE ARQUITECTURA DE COMPUTADORES Y
AUTOMÁTICA
© Daniel Tapiador de Pedro, 2017
TESIS DOCTORAL
Architecture, Techniques and Models for enabling
Data Science in the Gaia Mission Archive
Arquitectura, Técnicas y Modelos para posibilitar la Ciencia de
Datos en el Archivo de la Misión Gaia
MEMORIA PARA OPTAR AL GRADO DE DOCTOR PRESENTADA POR
Daniel Tapiador de Pedro
DIRECTORES
Eduardo Huedo Cuesta
Luis Manuel Sarro Baro
FACULTAD
DE
INFORMÁTICA
TESIS
DOCTORAL
Architecture,
Techniques
and
Models
for
Enabling
Data
Science
in
the
Gaia
Mission
Archive
(Arquitectura,
Técnicas
y
Modelos
para
Posibilitar
la
Ciencia
de
Datos
en
el
Archivo
de
la
Misión
Gaia)
Daniel Tapiador de Pedro
Directores:
Eduardo Huedo Cuesta
Luis Manuel Sarro Baro
Architecture,
Techniques
and
Models
for
Enabling
Data
Science
in
the
Gaia
Mission
Archive
(Arquitectura,
Técnicas
y
Modelos
para
Posibilitar
la
Ciencia
de
Datos
en
el
Archivo
de
la
Misión
Gaia)
TESIS DOCTORAL
Daniel Tapiador de Pedro
Departamento de Arquitectura de Computadores y Automática Facultad de Informática
Universidad Complutense de Madrid
Architecture,
Techniques
and
Models
for
Enabling
Data
Science
in
the
Gaia
Mission
Archive
Author:
Daniel Tapiador de Pedro
Thesis submitted to the Complutense University of Madrid in partial fulfillment of the requirements for the degree of
Ph.D. in Computer Science
Supervisors:
Eduardo Huedo Cuesta
Luis Manuel Sarro Baro
Departamento de Arquitectura de Computadores y Automática Facultad de Informática
Universidad Complutense de Madrid
A Nuria e Iván, por su apoyo incondicional, y por dar sentido a este esfuerzo.
I would like to express my gratitude to the countless people that have directly or indirectly supported this thesis throughout the last ten years, helping me research in this passionate field of distributed systems applied to astronomy and astrophysics.
In the first place, I would like to thank my supervisors, Eduardo Huedo Cuesta and Luis Manuel Sarro Baro for their guidance and contributions in making the thesis and all related publications a thorough and impactful work within the discipline. I also want to thank William O’Mullane for the opportunity to work in one of the most exciting European Space Agency (ESA) scientific missions, i.e. Gaia, and for his support and ambition to make its goals a success. In the same way, members of the Data Processing and Analysis Consortium (DPAC) like Xavier Luri, Anthony Brown, Cesc Julbe and Francesca Figueras deserve my thankfulness.
Special recognition should be allocated to the European Space Astronomy Centre (ESAC), as a world-class reference for space and planetary astronomy. I have had the pleasure to work there for eight years and to develop and validate part of the research comprised in this thesis. There are many brilliant professionals who I have learned a lot from, and who have become great friends along the way. It would be endless to name them all, but I would like to at least mention Christophe Arviset, Fernando Félix, Rubén Álvarez and Aitor Ibarra.
Furthermore, I would like to thank Ángel Berihuete for the leadership he has shown in the last (and toughest) part of this journey. He deserves a special mention as an unofficial supervisor of this thesis, and for spending the necessary time (often his personal one) on the topics that I needed to learn and work on for the research being put forward today. This commitment and perseverance is crucial for the success of any research, and for the growth of PhD candidates working on their theses.
In addition, I have the pleasure to have worked in this thesis within one of the leading research and innovation groups for distributed systems, Cloud computing and other cutting-edge technological advances, i.e. DSA-Research. Ignacio Martín Llorente and Rubén Santiago Montero have certainly helped me spark my curiosity and enthusiasm for applied research and innovation in distributed systems.
Moreover, the many knowledgeable colleagues that I have had the opportunity to work with, in leading companies like Telefonica, Etisalat and the Emirates Integrated Telecommunications Company (du), as well as the cross-fertilization of some of the ideas learned there, have proved to be very useful both for this research and for my professional VII
VIII Acknowledgements
endeavours.
Last but not least, the support and push that I have received from my family and friends have been paramount for the accomplishment of this research. They have given me the inspiration and strength from the beginning, all the way down to these words of acknowledgement.
Acknowledgements VII Table of Contents IX List of Figures XI List of Tables XV Acronyms XVII Abstract XXIII Resumen XXV 1 Introduction 1 1.1 Overview . . . 1
1.2 Evolution of Distributed Systems . . . 4
1.3 Big Data and Data Science . . . 7
1.4 Scientific Archives . . . 11
1.5 Motivation and Main Objectives . . . 13
1.6 Main Contributions and Roadmap of the Thesis . . . 16
2 Evolution of Scientific Archives 23 2.1 Scientific Archives in Astronomy and Astrophysics . . . 24
2.2 The Virtual Observatory . . . 28
2.3 Evolution of Implementation Approaches . . . 30
2.3.1 Query Metadata and Download Data . . . 30
2.3.2 Bring the Software to the Data . . . 32
2.3.3 Cloud Computing as an Enabler . . . 35
2.4 Collaborative Archives . . . 37
2.4.1 Consolidating Operations, Archiving and Data Exploitation . . . . 39 IX
X Tableof Contents
3 Enabling Large Scale Data Science and Data Products 41
3.1 Massively Parallel Processing Databases . . . 42
3.2 The Big Data Landscape . . . 44
3.2.1 MapReduce and the Lambda Architecture . . . 44
3.2.2 The Data Lake . . . 47
3.3 Column Orientation . . . 50
3.4 General Purpose Large Scale Data Processing Engines . . . 53
3.4.1 Apache Spark . . . 55
3.5 Data as a Service . . . 59
4 Architecture and Techniques for the Gaia Mission Archive 61 4.1 The Gaia Mission Archive . . . 62
4.2 Partitioning Astronomical Catalogues . . . 64
4.2.1 Ingestion of the Catalogue . . . 68
4.2.2 Partitioning and Clustering . . . 69
4.2.3 Experiments . . . 70
4.3 Higher Level Frameworks for Scientists . . . 74
4.3.1 Data Analysis in the Gaia Mission . . . 75
4.3.2 Framework Description . . . 78
4.3.3 Cloud Deployment . . . 81
4.3.4 Data Storage Model Considerations . . . 82
4.3.5 Benchmarking . . . 86
4.3.6 User Experience . . . 91
4.4 Towards Scalable and Unified Architectures . . . 92
4.5 The Science Enabling Applications Work Package . . . 93
5 The Grand Challenge 97 5.1 Motivation . . . 98
5.2 Markov Chain Monte Carlo Techniques . . . 100
5.3 The Present-Day Mass Function . . . 103
5.4 The Present-Day Age Distribution . . . 112
5.4.1 Gaussian Processes . . . 112
5.4.2 Problem Description . . . 113
5.4.3 The Hierarchical Model . . . 117
5.5 Experiments . . . 122
6 Conclusions and Future Work 131
1.1 Virtual Organizations in Grid computing. . . . 5
1.2 The three Vs in Big Data. . . 8
1.3 Skill sets for a Data Scientist. . . 9
2.1 Illustration of the scientific data exponential growth. The volume for as tronomical data does not include missions like Gaia or Euclid or telescopes like the Large Synoptic Survey Telescope (LSST) or the Square Kilometer Array (SKA), which would make the curve much steeper. . . . 24
2.2 ESA’s fleet across the spectrum. . . 25
2.3 ESA’s fleet in the Solar System. . . 26
2.4 Open Archival Information System (OAIS) Functional model. . . . 27
2.5 Virtual Observatory (VO) architecture. . . 29
2.6 ESAC Science Data Centre (ESDC) scientific archives architecture. . . 31
2.7 Experiment architecture for XMM-Newton EPIC-pn instrument on-the-fly data reduction. . . . 33
2.8 Experiment workflow for XMM-Newton EPIC-pn instrument on-the-fly data reduction. . . . 34
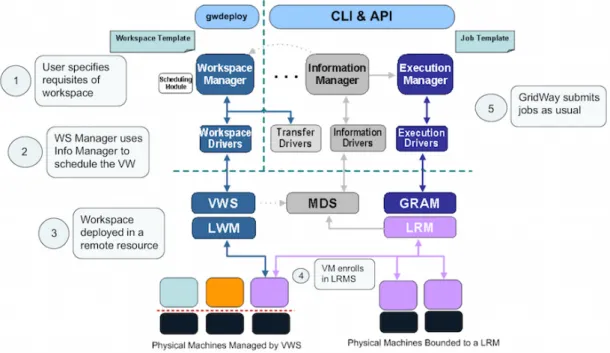
2.9 Process flow and interactions among GridWay components, Grid middle ware and Grid resources for dynamically adapting the infrastructure to the workload. . . 36
2.10 Herschel data processing architecture and workflow. . . 39
2.11 Correlation of the Herschel Science Operations Centre (SOC) data pro cessing and the archive Extract, Transform and Load (ETL) pipeline. . . . 40
3.1 The Lambda architecture. . . 47
3.2 Hadoop Distributed File System (HDFS) architecture. . . . 48
3.3 Optimized Row Columnar (ORC) file layout. Each stripe is independent of each other and contains only entire rows so that rows never straddle stripe boundaries. The data for each column is stored separately and there are statistics about each column both at file and stripe level. The stripe footer contains the encoding of each column among other things. . . . 52
XII List of Figures
3.4 Disk size of the Gaia Universe Model Snapshot (GUMS) version 10 data set for different storage models selected in Greenplum Database Management System (DBMS). . . . 53 3.5 Lines of code comparison for major Big Data frameworks. . . . 56 3.6 Generality of Apache Spark combining Structured Query Language (SQL),
streaming, machine learning and graph processing over the same dis
tributed processing engine. . . 59 4.1 Schematic overview of the Gaia DPAC. . . 63 4.2 CU9 Work Packages. . . 65 4.3 Histogram of the number of sources per Hierarchical Equal Area Iso Lat
itude Pixelation of a sphere (HEALPix) pixel subdivisions (area on the sky). See Figure 4.8 for a spatially projected view of this histogram. . . . 67 4.4 Q3C (indexed) with and without table partitioning and clustering, and
PgSphere (sequential) geometry benchmark (GUMS version 10). . . 73 4.5 Geometry benchmark for Quad Tree Cube (Q3C) and PgSphere (no index
usage) for GUMS version 10 data set. . . 73 4.6 Heap and column compressed storage model comparison for different num
ber of columns with Q3C GUMS version 10. . . 74 4.7 Heap and column compressed storage model comparison for different num
ber of columns with PgSphere (GUMS version 10). Heap storage is row
oriented (one row after the other on disk) . . . 75 4.8 Star density map using HEALPix. . . . 76 4.9 Theoretical Hertzsprung-Russell diagram. The horizontal axis shows the
temperature of the stars on a logarithmic scale and the vertical axis shows a measure of the luminosity (intrinsic brightness) of the stars (also loga
rithmic, brighter stars are at more negative values). . . 77 4.10 Data workflow through the framework and main interfaces to implement
for each hypercube. The sample in the figure shows a hypercube with two dimensions (discrete for the x axis and continuous with intervals for the y
axis) that counts the number of elements falling into each combination of the categories. . . 79 4.11 Performance for different HDFS block and file sizes (files in GBIN format
are binary and compressed with Deflate). . . . 83 4.12 Data storage model approaches performance comparison. . . 84 4.13 Data set size for different compression and format approaches. . . 85 4.14 Comparison among the framework presented and other popular data anal
ysis tools currently available. All tests have been run using the Hadoop standard Merge-Sort algorithm for data aggregation. . . . 88
4.15 Scalability benchmark for (a) star density map, (b) theoretical Hertzsprung-Russell diagram and (c) star density map at eight different resolutions. The approaches shown encompass different alternatives from the Hadoop ecosystem and the two main algorithms used for aggregating data, i.e. Merge Sort (the default for Hadoop) and Hash Aggregation (whose im plementation is known in the Hadoop ecosystem as In-Mapper combiner). The results for Hash aggregation are only shown for Hive, which is the only one that showed some improvements in the tests run. The dataset is enlarged one, two and four times with the same data (1xGUMS10, 2xGUMS10 and 4xGUMS10 respectively) and therefore the cardinality of the key space for each hypercube being computed remains unchanged. . . 89
5.1 Walker chains for parameter θ1. . . 104 5.2 Walker chains for parameter θ2. . . 105 5.3 Walker chains for parameter θ3. . . 106 5.4 Hierarchical model using plate notation. The circles represent random
variables and the squares refer to fixed quantities. Arrows denote the existence of a statistical dependence. Grey nodes represent measured ran dom variables. For instance, mˆi is the observed mass of the i-th star. The
big rectangle (plate) represents the repetition of the variables inside. The value N in the corner is the number of these repetitions and match the number of sources/stars with true (mi) and observed (mˆi) masses. η is
the hyperparameter that governs the distribution of the prior probability distribution of the slopes p(θ|η). Finally the number inside the brackets represents the dimension of the variables. . . . 107 5.5 Samples drawn from the posterior distribution in Equation 5.6 by emcee
algorithm (Foreman-Mackey et al., 2013). Blue lines represent true values of θ =(1.3,2.3,2.3). Dashed lines represent quantiles 0.16, 0.5, 0.84, for each θi. The title above each 1-D histogram shows the 0.5 quantile with
the upper and lower errors supplied by the quantiles. The 2-D plots show the contour lines for levels 0.11, 0.39, 0.67 and 0.86. See Foreman-Mackey
(2016) for more information. . . 110 5.6 True and estimated Present-Day Mass Function (PDMF) Probability Den
sity Function (PDF) function are shown in green and red respectively. The red ribbon represents the 3σ confindence band for estimated PDMF PDF. The graph was done by using the log transformation in x-axis to improve the visualization. Ticks on masses doing the intervals for the PDMF PDF support are shown. Note that the figure shows PDMF PDF with a change of variable to log(m) instead of m, in order to improve the visualization. . 111
XIV List of Figures
5.7 The Present-Day Age Distribution (PDAD) PDF Hierarchical Bayesian Model in plate notation. The circles represent random variables and the squares refer to fixed quantities. Arrows denote the existence of a statis tical dependence. Grey nodes represent measured random variables. For instance, tˆis the observed age for each star. The outer rectangle (plate) represents the repetition of the variables inside, and N at the bottom right corner is the number of these repetitions (i.e. number of sources). The in ner rectangle represents a sample of ages with size M(i) for each star i. Finally the number inside the brackets represents the dimension of the variables. . . . 118 5.8 Posterior samples obtained by emcee for the hyperparameters η and ρ.
Dashed lines represent the 0.16, 0.5 and 0.84 quantiles. The title above each 1-D histogram shows the 0.5 quantile together with the spread given by the 0.16 and 0.84 quantiles. . . . 120 5.9 Histogram of the simulated ages. True and estimated PDAD PDF func
tions are shown in green and red respectively. The red ribbon represents the confindence band derived by using the diagonal of the matrix Σpost in Equation 5.16. . . . 121 5.10 Average time per walker and iteration when increasing the number of cores
per executor. The most cost effective configuration is when the number of partitions correspond to the number of executors times the number of cores per executor. Furthermore, the more cores per executor the smaller the total amount of memory allocated for this mainly computationally intensive workload. . . 125 5.11 PDMF speedup with a four million masses data set. Adding resources
decreases the average time taken per walker/iteration as the workload per partition/core is reduced. At some point (around 12 or 14 executors), the improvements are less abrupt, mainly due to the time taken to aggregate the likelihoods for the masses and any other latencies produced by the increase in the number of workers involved. . . . 127 5.12 PDMF scaleup (reported with execution time per iteration instead of num
ber of iterations per unit of time). The plot shows a scaleup very close to the linear (theoretical) one as we increase the data set and the resources proportionally. . . . 128 5.13 PDAD speedup with a four million ages data set. . . . 129 5.14 PDAD scaleup (reported with execution time per iteration instead of num
3.1 Comparison between the Data Lake and other Massively Parallel Pro cessing (MPP) databases or traditional Relational Database Management System (RDBMS) . . . 49 4.1 Test battery for geometrical queries benchmark. . . 71
2MASS Two Micron All Sky Survey. 94, 95
ADQL Astronomical Data Query Language. 28, 93 AGIS Astrometric Global Iterative Solution. 62 AIO Archive Inter-Operability. 30, 32
AO Announcement of Opportunity. 62
API Application Programming Interface. 4, 45, 46, 57, 58, 122, 124 AWS Amazon Web Services. 6, 67, 81, 82, 132
CANFAR Canadian Advanced Network for Astronomical Research. 37 CAPEX Capital Expenditure. 6
CAS Catalog Archive Server. 35 CCD Charge Coupled Device. 61
CD-ROM Compact Disc-Read Only Memory. 23
CDS Centre de Données astronomiques de Strasbourg. 96 CPU Central Processing Unit. 6, 43, 45, 50, 54, 60, 133 CRM Customer Relationship Management. 10
CSV Comma Separated Values. 69 CU Coordination Unit. 20, 62, 64, 68, 98 DaaS Data as a Service. 58, 60
DAG Directed Acyclic Graph. 54, 88 DAO Data Access Object. 31
XVIII Acronyms
DAS Direct-Attached Storage. 42, 67 DBA Database Administrator. 45
DBMS Database Management System. XI, 43, 45, 46, 50, 52, 67, 68, 72, 76, 88, 133 DPAC Data Processing and Analysis Consortium. VII, XII, 62, 98
DPC Data Processing Centre. 62 DSL Domain Specific Language. 59 DSS Digitized Sky Survey. 94
EBS Amazon Elastic Block Store. 67
EC2 Amazon Elastic Compute Cloud. 67, 81 EMR Amazon Elastic MapReduce. 81, 82, 85
ESA European Space Agency. VII, 16, 23, 25, 39, 61, 62, 131 ESAC European Space Astronomy Centre. VII, 19
ESDC ESAC Science Data Centre. XI, 15, 30, 31 ETL Extract, Transform and Load. XI, 25, 39, 46, 86
FLAME Final Luminosity, Age and Mass Estimation. 98, 99, 108, 109, 114, 117, 119, 134
FTP File Transfer Protocol. 31
GALEX Galaxy Evolution Explorer. 94 GAP Gaia Archive Preparation. 62 GB Gigabyte. 54, 67, 75, 124 GFS Google File System. 33 GP Gaussian Process. 116, 117
GPL GNU General Public License. 39 GPU Graphics Processing Unit. 134 GUI Graphical User Interface. 30
GUMS Gaia Universe Model Snapshot. XI, XII, 17, 51, 52, 70, 72, 74, 75, 82, 84, 87, 91
HBM Hierarchical Bayesian Modeling. XXIV, 3, 14, 98, 99, 100, 108, 117, 119
HDFS Hadoop Distributed File System. XI, XII, 17, 20, 42, 45, 48, 50, 69, 82, 83, 84, 85, 95, 124
HEALPix Hierarchical Equal Area Iso Latitude Pixelation of a sphere. XII, 18, 66, 68, 69, 76, 82, 86
HPC High Performance Computing. 4, 5, 33 HQL Hive Query Language. 57
HRPS Hybrid Range Partitioning Strategy. 67 HSO Herschel Space Observatory. 12
HST Hubble Space Telescope. 61
HTTP HyperText Transfer Protocol. 28, 30, 31
I/O Input/Output. 6, 17, 43, 45, 48, 50, 54, 87, 88, 124 IaaS Infrastructure as a Service. 6
ICD Interface Control Document. 27
ICT Information and Communications Technology. 10, 30 IMF Initial Mass Function. XXIV, 3, 98, 100, 103
IOPS Input/Output Operations Per Second. 6 IoT Internet of Things. 44
IVOA International Virtual Observatory Alliance. 12, 13, 27 JAR Java Archive. 91
JVM Java Virtual Machine. 87 KDE Kernel Density Estimation. 119 LAN Local Area Network. 4
LHC Large Hadron Collider. 6, 41
LRMS Local Resource Management System. 5, 37
XX Acronyms
MAGIC Multiattribute Grid Declustering. 67 MB Megabyte. 33, 54, 124
MCMC Markov chain Monte Carlo. 3, 18, 58, 95, 98, 99, 100, 101, 102, 108, 117, 122, 123, 133
MDS Monitoring and Discovery System. 37 MOC Mission Operations Centre. 39
MPI Message Passing Interface. 5, 6, 76, 134
MPP Massively Parallel Processing. XV, 14, 18, 42, 43, 44, 47, 48, 51, 55, 62, 64, 67, 68, 69, 70
NoSQL Not Only SQL. 44 NUTS No-U-Turn Sampler. 134
OAIS Open Archival Information System. XI, 12, 25, 27, 28, 61 OLAP On Line Analytical Processing. 43
OLTP On Line Transaction Processing. 43, 51, 70, 133 OPEX Operational Expenditure. 6
ORC Optimized Row Columnar. XI, 50, 51, 54, 57, 86, 94 PaaS Platform as a Service. 6, 38, 58, 133
PB Petabyte. 46, 61, 62
PDAD Present-Day Age Distribution. XIII, XIV, XXIV, 3, 14, 20, 98, 99, 100, 102, 112, 113, 114, 115, 117, 119, 122, 123, 124, 126, 128, 131, 134
PDF Probability Density Function. XIII, XIV, 98, 100, 103, 108, 109, 112, 113, 114, 117, 119, 134
PDMF Present-Day Mass Function. XIII, XIV, XXIV, 3, 14, 20, 98, 99, 100, 102, 103, 108, 109, 112, 109, 122, 123, 124, 126, 128, 131, 134
PDS Planetary Data System. 12 PVM Parallel Virtual Machine. 5
RAID Redundant Array of Independent Disks. 67
RDBMS Relational Database Management System. XV, 41, 42, 44, 48, 64, 71, 94, 95 RDD Resilient Distributed Dataset. 56, 57, 58, 122, 123, 133
REST Representational State Transfer. 28 RPC Remote Procedure Call. 30
RVS Radial Velocity Spectrometer. 68 S3 Amazon Simple Storage Service. 50, 81 SaaS Software as a Service. 6
SAMP Simple Application Messaging Protocol. 29 SDSS Sloan Digital Sky Survey. 35, 76, 94
SFH Star Formation History. 98, 113
SFR Star Formation Rate. XXIV, 3, 98, 100, 113 SGE Sun Grid Engine. 5, 37
SKA Square Kilometer Array. XI, 13, 24, 37, 44 SLA Service-Level Agreement. 6
SMP Shared-memory MultiProcessing. 4, 41, 42 SOA Service-Oriented Architecture. 28
SOAP Simple Object Access Protocol. 28
SOC Science Operations Centre. XI, 16, 17, 23, 25, 39, 57, 58, 62, 82, 92, 131 SPASE Space Physics Archive Search and Extract. 12
SPMD Single-Program Multiple-Data. 32
SQL Structured Query Language. XII, 14, 28, 35, 43, 44, 46, 48, 55, 57, 58, 64, 70, 76, 86, 88, 92, 95
SSAP Simple Spectral Access Protocol. 93 TAP Table Access Protocol. 28, 57, 92, 93 TB Terabyte. 35, 43, 54, 67, 124
XXII Acronyms
UDF User Defined Function. 14, 31, 44, 45, 76, 90 URL Uniform Resource Locator. 31
VO Virtual Observatory. XI, 13, 19, 27, 28, 29, 30, 38, 57, 58, 61, 93 VWS Virtual Workspace Service. 37
WSDL Web Service Definition Language. 28 XML Extensible Markup Language. 28, 31 XSA XMM-Newton Science Archive. 32 YARN Yet Another Resource Negotiator. 95
The massive amounts of data that the world produces every day pose new challenges to modern societies in terms of how to leverage their inherent value. Social networks, instant messaging, video, smart devices and scientific missions are just mere examples of the vast number of sources generating data every second. As the world becomes more and more digitalized, new needs arise for organizing, archiving, sharing, analyzing, visualizing and protecting the ever-increasing data sets, so that we can truly develop into a data-driven economy that reduces inefficiencies and increases sustainability, creating new business opportunities on the way.
Traditional approaches for harnessing data are not suitable any more as they lack the means for scaling to the larger volumes in a timely and cost efficient manner. This has somehow changed with the advent of Internet companies like Google and Facebook, which have devised new ways of tackling this issue. However, the variety and complexity of the value chains in the private sector as well as the increasing demands and constraints in which the public one operates, needs an ongoing research that can yield newer strategies for dealing with data, facilitate the integration of providers and consumers of informa tion, and guarantee a smooth and prompt transition when adopting these cutting-edge technological advances.
This thesis aims at providing novel architectures and techniques that will help perform this transition towards Big Data in massive scientific archives. It highlights the common pitfalls that must be faced when embracing it and how to overcome them, especially when the data sets, their transformation pipelines and the tools used for the analysis are already present in the organizations. Furthermore, a new perspective for facilitating a smoother transition is laid out. It involves the usage of higher-level and use case specific frameworks and models, which will naturally bridge the gap between the technological and scientific domains. This alternative will effectively widen the possibilities of scientific archives and therefore will contribute to the reduction of the time to science.
The research will be applied to the European Space Agency cornerstone mission Gaia, whose final data archive will represent a tremendous discovery potential. It will create the largest and most precise three dimensional chart of our galaxy (the Milky Way), providing unprecedented position, parallax and proper motion measurements for about one billion stars. The successful exploitation of this data archive will depend to a large degree on the ability to offer the proper architecture, i.e. infrastructure and middleware, upon which scientists will be able to do exploration and modeling with this huge data XXIII
XXIV Abstract
set. In consequence, the approach taken needs to enable data fusion with other scientific archives, as this will produce the synergies leading to an increment in scientific outcome, both in volume and in quality. The set of novel techniques and frameworks presented in this work addresses these issues by contextualizing them with the data products that will be generated in the Gaia mission. All these considerations have led to the foundations of the architecture that will be leveraged by the Science Enabling Applications Work Package.
Last but not least, the effectiveness of the proposed solution will be demonstrated through the implementation of some ambitious statistical problems that will require sig nificant computational capabilities, and which will use Gaia-like simulated data (the first Gaia data release has recently taken place on September 14th, 2016). These ambitious problems will be referred to as the Grand Challenge, a somewhat grandiloquent name that consists in inferring a set of parameters from a probabilistic point of view for the Initial Mass Function (IMF) and Star Formation Rate (SFR) of a given set of stars (with a huge sample size), from noisy estimates of their masses and ages respectively. This will be achieved by using Hierarchical Bayesian Modeling (HBM). In principle, the HBM can incorporate stellar evolution models to infer the IMF and SFR directly, but in this first step presented in this thesis, we will start with a somewhat less ambitious goal: inferring the PDMF and PDAD. Moreover, the performance and scalability analyses carried out will also prove the suitability of the models for the large amounts of data that will be available in the Gaia data archive.
Las grandes cantidades de datos que se producen en el mundo diariamente plantean nuevos retos a la sociedad en términos de cómo extraer su valor inherente. Las redes sociales, mensajería instantánea, los dispositivos inteligentes y las misiones científicas son meros ejemplos del gran número de fuentes generando datos en cada momento. Al mismo tiempo que el mundo se digitaliza cada vez más, aparecen nuevas necesidades para organizar, archivar, compartir, analizar, visualizar y proteger la creciente cantidad de datos, para que podamos desarrollar economías basadas en datos e información que sean capaces de reducir las ineficiencias e incrementar la sostenibilidad, creando nuevas oportunidades de negocio por el camino.
La forma en la que se han manejado los datos tradicionalmente no es la adecuada hoy en día, ya que carece de los medios para escalar a los volúmenes más grandes de datos de una forma oportuna y eficiente. Esto ha cambiado de alguna manera con la llegada de compañías que operan en Internet como Google o Facebook, ya que han concebido nuevas aproximaciones para abordar el problema. Sin embargo, la variedad y complejidad de las cadenas de valor en el sector privado y las crecientes demandas y limitaciones en las que el sector público opera, necesitan una investigación continua en la materia que pueda proporcionar nuevas estrategias para procesar las enormes cantidades de datos, facilitar la integración de productores y consumidores de información, y garantizar una transición rápida y fluida a la hora de adoptar estos avances tecnológicos innovadores.
Esta tesis tiene como objetivo proporcionar nuevas arquitecturas y técnicas que ayu darán a realizar esta transición hacia Big Data en archivos científicos masivos. La in vestigación destaca los escollos principales a encarar cuando se adoptan estas nuevas tecnologías y cómo afrontarlos, principalmente cuando los datos y las herramientas de transformación utilizadas en el análisis existen en la organización. Además, se exponen nuevas medidas para facilitar una transición más fluida. Éstas incluyen la utilización de software de alto nivel y específico al caso de uso en cuestión, que haga de puente entre el dominio científico y tecnológico. Esta alternativa ampliará de una forma efectiva las posibilidades de los archivos científicos y por tanto contribuirá a la reducción del tiempo necesario para generar resultados científicos a partir de los datos recogidos en las misiones de astronomía espacial y planetaria.
La investigación se aplicará a la misión de la Agencia Espacial Europea (ESA) Gaia, cuyo archivo final de datos presentará un gran potencial para el descubrimiento y hal lazgo desde el punto de vista científico. La misión creará el catálogo en tres dimensiones
XXVI Resumen
más grande y preciso de nuestra galaxia (la Vía Láctea), proporcionando medidas sin precedente acerca del posicionamiento, paralaje y movimiento propio de alrededor de mil millones de estrellas. Las oportunidades para la explotación exitosa de este archivo de datos dependerán en gran medida de la capacidad de ofrecer la arquitectura adecuada, es decir infraestructura y servicios, sobre la cual los científicos puedan realizar la ex ploración y modelado con esta inmensa cantidad de datos. Por tanto, la estrategia a realizar debe ser capaz de combinar los datos con otros archivos científicos, ya que esto producirá sinergias que contribuirán a un incremento en la ciencia producida, tanto en volumen como en calidad de la misma. El conjunto de técnicas e infraestructuras inno vadoras presentadas en este trabajo aborda estos problemas, contextualizándolos con los productos de datos que se generarán en la misión Gaia. Todas estas consideraciones han conducido a los fundamentos de la arquitectura que se utilizará en el paquete de tra bajo de aplicaciones que posibilitarán la ciencia en el archivo de la misión Gaia (Science Enabling Applications).
Por último, la eficacia de la solución propuesta se demostrará a través de la im plementación de dos problemas estadísticos que requerirán cantidades significativas de cómputo, y que usarán datos simulados en el mismo formato en el que se producirán en el archivo de la misión Gaia (la primera versión de datos recogidos por la misión está disponible desde el día 14 de Septiembre de 2016). Estos ambiciosos problemas representan el Gran Reto (Grand Challenge), un nombre grandilocuente que consiste en inferir una serie de parámetros desde un punto de vista probabilístico para la función de masa inicial (Initial Mass Function) y la tasa de formación estelar (Star Forma tion Rate) dado un conjunto de estrellas (con una muestra grande), desde estimaciones con ruido de sus masas y edades respectivamente. Esto se abordará utilizando modelos jerárquicos bayesianos (Hierarchical Bayesian Modeling). En principio, los modelos prop uestos pueden incorporar otros modelos de evolución estelar para inferir directamente la función de masa inicial y la tasa de formación estelar, pero en este primer paso pre sentado en esta tesis, empezaremos con un objetivo algo menos ambicioso: la inferencia de la función de masa y distribución de edades actual (Present-Day Mass Function y
Present-Day Age Distribution respectivamente). Además, se llevará a cabo el análisis de rendimiento y escalabilidad para probar la idoneidad de la implementación de dichos modelos dadas las enormes cantidades de datos que estarán disponibles en el archivo de la misión Gaia.
Introduction
In summary, all great work is the fruit of patience and perseverance, combined with tenacious concentration on a subject over a period of months or years. Reglas y Consejos sobre Investigación Científica: Los tónicos de la voluntad. Santiago Ramón y Cajal.
1.1 Overview
The idea of data creating value is not new, however, the effective use of data is becoming the basis of competition in the private sector, and the enabler of wider and deeper knowledge in the scientific one. Internet companies like Google, Facebook or Amazon
are good examples of how data can be the key to innovation, and how its successful processing and exploitation can disrupt entire industries and become a new source of growth. These companies leading the change are now including Big Data from both within and outside the enterprise, including structured and unstructured data, machine data, as well as online and mobile data, which supplement their organizational data and provide the basis for historical and forward-looking views (descriptive, predictive and prescriptive). Big Data is thus fundamentally changing the way businesses compete and operate. Data is the new currency. It holds the secrets to maintaining customer loyalty, shaping profitable initiatives, minimizing risks and boosting innovation and knowledge.
All this has led to a significant growth of Big Data platforms, tools and techniques that are making their way towards a variety of industries and scientific fields. These recent advances in large scale computing paradigms and environments enable new opportunities to extract the inherent value out of the vast amounts of data being currently generated. Nevertheless, their successful adoption is not straightforward in certain complex areas like science, as there are still some barriers that need to be overcome. Those comprise:
• The existence of models and legacy code that need to be adapted to the new distributed environments.
2 Chapter 1. Introduction
• The lack of high-level and use case specific frameworks, tools and models that facilitate a smoother transition.
• The scarcity of profiles with the balanced skill sets that can bridge the gap between the technological and scientific domains.
The European Space Agency’s Gaia mission (Gaia Collaboration et al.,2016b;Mignard,
2005) is a good example of a scientific venture whose results will likely be the astronom ical data resource for decades thereafter, representing a tremendous discovery potential. It will create the largest and most precise three dimensional chart of our galaxy (the Milky Way), by surveying more than one billion stars. Furthermore, it will also provide unprecedented position, parallax and proper motion measurements as per the mission science performance constraints (de Bruijne, 2012).
The resulting catalog, along with the raw data collected by the mission’s instruments, will be made available to the scientific community, and will be analyzed in many different ways for many different purposes. In this scenario, the identification and availability of the proper analytical tools and frameworks will become crucial to ease the process taken by scientists when building models or conducting any other research.
To this extent, the Gaia Science Enabling Applications work package in general, and the Data Mining sub-work package in particular, have been established. They aim at a wide variety of requirements and functionality that will be provided to the community. These include:
• The provision of enriched and high level data access tools.
• Capabilities for cross-matching the final catalogue with other scientific surveys.
• A framework to perform complex queries (normally with some analytical workload).
• A set of models that can be utilized in a straightforward and seamless way, al lowing composability for more complex use cases and configurability for different approaches.
• The means for managing the variety of workloads coming through (and their secu rity constraints).
• Visualization of complex relations and high dimensional data sets.
Other concrete challenges (Brown, 2012) that are being tackled comprise the ability to re-analyze the raw data and do hypothesis testing against the raw image pixels (as well as model comparisons), the capacity to shift scientific workloads towards the data centre (bring the software and models to the data and not the other way around), the means to publish a living data archive (that can get updated with new results), the exposure of a window to science, and the seamless combination with other surveys or data sets (multi-mission archive).
Many of these topics, at least those not too bound to the scientific domain, are being addressed within the novel disciplines of Big Data and Data Science. The former suggests (among other things) a cost-efficient, highly scalable and multi-tenant frame architecture that gravitates around the so-called data lake (O’Leary, 2014), which is roughly no more than a scalable data repository that can securely hold and govern different types of data, sometimes in their native format, allowing its exploitation in different domains or use cases. The latter basically involves the skill set, mindset, techniques, etc. required to perform the analyses and tasks that transform the data into value for the specific area of expertise.
The application of these new disciplines to science is often cumbersome because of the complexity of any scientific research in the first place, and more concretely due to the non-negligible gap between the scientific and technological domains (as both usually demand a high level of specialization on their own). Some concrete examples in the Gaia mission scientific realm involve answers to questions like, how can we validate and compare already existing models of the Galaxy with the data that will be generated by the mission? Or, how can we effectively and efficiently build new models that help us explain what the observations are showing? Or, given the huge amount of data that will be produced, how can we learn and build non-parametric models that have no previous assumptions or restrictions of what the outcome might look like? In that case, would these non-parametric or strictly empirical approaches be good enough to model complex systems like our Galaxy (Bar-Yam, 2013)?
In this thesis, we aim at providing a qualitative and quantitative overview to these challenges from the Gaia mission perspective, even though much of the reasoning and the proposed approaches are directly applicable to other fields and industries. Furthermore, we will show how the evolution of technology in general and distributed systems in particular have driven the way scientific archives are designed and implemented. We will also address some of the key technological trends and advances that have lately appeared, i.e. Big Data and Data Science, and how they will help unleash the huge potential of the Gaia mission’s archive.
Last but not least, we will lay out two ambitious statistical problems that require significant computational capabilities, and which will use Gaia-like data in the same format as the mission will produce (only simulations available so far). We will refer to this ambitious problem as the Grand Challenge, a somewhat grandiloquent name that will serve as a demonstration of the effectiveness of the approach taken. The Grand Challenge consists in inferring a set of parameters from a probabilistic point of view for the Initial Mass Function (IMF) (Chabrier, 2005) and Star Formation Rate (SFR)
(Elmegreen and Scalo, 2006) of a given set of stars with a huge sample size, from noisy
estimates of their masses and ages respectively. This will be achieved by leveraging the proposed architecture and techniques, and by using Markov chain Monte Carlo (MCMC), Gaussian processes and Hierarchical Bayesian Modeling (HBM). In principle, the HBM can incorporate stellar evolution models to infer the IMF and SFR directly, but in this first step presented in this work, we will start with a somewhat less ambitious goal: inferring the Present-Day Mass Function (PDMF) and Present-Day Age Distribution
4 Chapter 1. Introduction
(PDAD). The main difference stems from the fact that we will not be including in our analysis the mass that would now be encountered in the latest stages of stellar evolution (white dwarfs, neutron stars or black holes).
1.2 Evolution of Distributed Systems
Computing capabilities have evolved dramatically over the past decades, especially since the arrival of the Web. Moore’s law (Moore,2000;Brock and Moore,2007) predicted that the number of transistors per chip would double every two years and, in a broader sense, the possibilities of integrated circuits would enable new fields of opportunity for personal computing, automatic controls and communications equipment. Similarly, Gordon Bell formulated his law of computer classes (Bell, 2008; Bell et al., 1972), which describes how types of computing systems form, evolve and may eventually die out. The classification ranges from mainframes in the 1960s (shared time systems with centralized resources), minicomputers in the 1970s, personal computers and workstations in the 1980s for ap plications executed locally and Local Area Network (LAN) networks, all the way down to client/server architectures (web-based applications) in the 1990s and new computing paradigms in the 2000s, like Grid computing, peer-to-peer and ubiquitous computing (network-based applications and mobile devices).
As technology matured and microprocessors caught up with supercomputers, par allel processing and the architectures and networks supporting them have also evolved considerably. Specifically, High Performance Computing (HPC) has undergone major architectural changes over the last decades, like moving from vector to parallel (towards multi-core and many-core architectures), from customized to standardized processors, and from single systems to clusters of commodity hardware (Resch and Küster, 2008). This last part has given rise to novel approaches like shared-nothing architectures (Stone
braker, 1986), whose main goal is to increase the scalability of the system by adding
pieces of inexpensive hardware (usually without any interruption of the service), as well as shared-something (typically disk) architectures (Taniar et al., 2008), which have also been in the limelight when a compromise is sought in the extensibility limitation of the shared-memory approach and the load balancing problem of the shared-nothing one.
The most popular standard Application Programming Interface (API) for Shared memory MultiProcessing (SMP) is OpenMP (Dagum and Menon, 1998). This API ba sically consists of a set of compiler directives and callable runtime library routines that influence run-time behaviour. Program execution begins as a single process, and executes serially until encountering a parallel construct, where the runtime forms a team of one or more processes and creates the data environment for each team member. Each of these processes are then executed in a different core. The programming model is sim ple yet powerful, and there are many compilers of OpenMP available in Fortran, C and C++ programming languages. However, scalability is obviously restricted to the num ber of cores that can be allocated in a shared-memory architecture, which, in a sense, is alleviated due to the latest trends in microprocessor design (Sutter, 2005), that are capping the clock speed and significantly increasing the number of cores per chip. One
could also argue that this trend was indeed the originator of such an API for concurrent programming.
Parallelism in HPC environments is achieved through message passing. Many dif ferent implementations like Parallel Virtual Machine (PVM) were developed before it was clear that the efforts were being duplicated and a standard would be more effective. That is how a broadly based committee of vendors, implementers and users proposed Message Passing Interface (MPI), a library specification for message passing that gives full control to the developer for implementing the best parallel algorithm (e.g. when to send what information to whom and how to synchronize the different nodes collaborat ing in the work). This approach proved to be very suitable for the scientific domain as shown in Foster (1995), and was a step forward towards the universal access to parallel and distributed computation. Once there was a standard which different institutions and private companies could rely on for parallel processing, new challenges for resource sharing arose, which in turn made way for the emergence of the Grid.
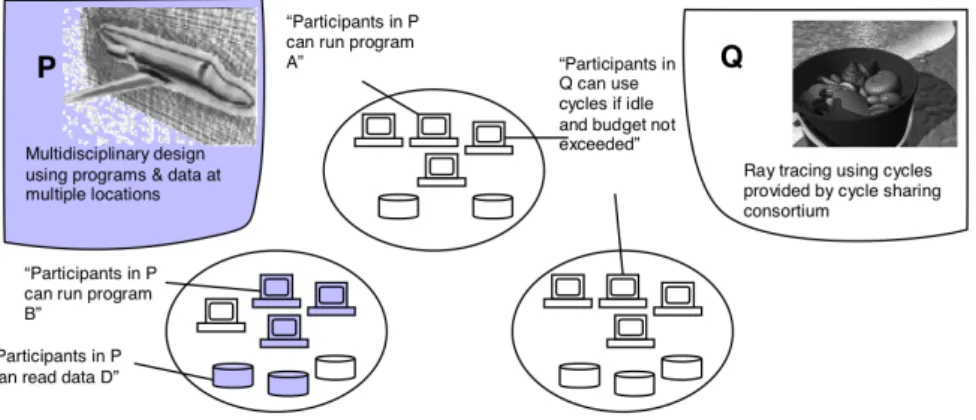
Grid computing enables the coordinated resource sharing and problem solving in dynamic, multi-institutional virtual organizations (Foster et al., 2001, 2002; Foster and
Kesselman, 1999). One of its goals is to provide the necessary tools and services for
efficiently managing the inherent complexity of multidisciplinary ventures (usually in the research field) by enabling the so-called Virtual Organizations (see Figure 1.1 for an example).
Figure 1.1: Virtual Organizations in Grid computing.
The de facto implementation for Grid computing is the Globus Toolkit (Foster, 2005). It consists of services for:
• Resource allocation, that can submit jobs to a cluster managed by a Local Resource Management System (LRMS), e.g. Sun Grid Engine (SGE) (Gentzsch, 2001).
• Information discovery and monitoring of status.
6 Chapter 1. Introduction
• Meta-scheduling capabilities on top of the middleware for harnessing the federated infrastructure (Huedo et al., 2004).
Even if there are quite remarkable deployments of Grid computing technology for well renowned projects like the Large Hadron Collider (LHC) (Geddes, 2012), it did not fully engage the private sector due to its limitations in the definition of Service-Level Agreement (SLA) and usage metering, the lack of a sensible approach for load balancing, as well as concerns for resource sharing without strong enforcements. Furthermore, it did not generate a prosperous business landscape and did not offer new alternatives for parallel processing, leaving just the option of MPI, where the developer has to take care of the intrinsic problems of the distributed system.
Cloud computing is seen by many as the successor of Grid computing due to its suitability for resource sharing (with proper SLA enforcements), its capabilities for load balancing, and its on-demand configuration alternatives. There have been attempts such
as Rodríguez et al. (2008) to integrate both technologies, where the Grid infrastructure
is enlarged or shrinked by adding or removing virtual nodes, with the goal of adapting the available resources depending on the workload (computational needs). However, even if the Grid helped create a certain technology reality, which made Clouds possible, it is likely that Grids will be re-branded or merged into Cloud computing (
Joszczuk-Januszewska, 2010).
The definition of Cloud computing presented in Mell and Grance (2011), states that it is a model for enabling ubiquitous, convenient, on-demand network access to a shared pool of configurable computing resources (like networks, servers, storage, applications and services) that can be rapidly provisioned and released with minimal management effort or service provider interaction. This Cloud model is composed of five essential characteristics: on-demand self-service, broad network access, resource pooling, rapid elasticity and measured service; three service models: Software as a Service (SaaS), Platform as a Service (PaaS) and Infrastructure as a Service (IaaS); and four deployment models: private cloud, community cloud, public cloud and hybrid cloud.
Cloud computing has been possible due to advances in virtualization technology, i.e. reducing more and more the overhead of running a virtualized guest on a hosting server. Once the overhead of Central Processing Unit (CPU) bound workflows was decreased to negligible levels, Input/Output (I/O) became the main bottleneck as shown in Ghoshal
et al. (2011) and Shafer (2010). Nowadays, it is rare to find a microprocessor that does
not provide extensions for virtualization, thus making any overhead negligible. Further more, commercial Cloud services like Amazon Web Services (AWS)1 offer the possibility of guaranteed Input/Output Operations Per Second (IOPS), ensuring all potential work loads can be met.
Even though server consolidation (and the implied reductions in capital expenditures and power consumption) is a use case worth remarking, the main driver for the adoption of the Cloud seems to be more related to the changes and the impact it produces in how businesses and institutions look at computing power. Companies can now move away
from a traditional Capital Expenditure (CAPEX) model, where they buy a dedicated hardware and depreciate it over time (normally overdimensioned for covering peaks in demand), towards an Operational Expenditure (OPEX) model where they pay as they go, typically more than what a similar capacity would cost when operated in-premise, but avoiding the fixed costs of an underutilized infrastructure, and with full tightness to the company’s business volumes at all times. This elasticity (Herbst et al., 2013), now possible in the Cloud, was one of the main goals when the Grid originated (the idea of computing becoming a utility, like the power grid), which turned out to be its greatest failure, even though, as stated above, it largely contributed to create momentum for such a disruption. All in all, we can observe an explosion of the number of Internet based start-ups, thanks to the new reality in computing power supply. It has now become possible for an entrepreneur to fully operate a company with just a laptop in a coffee house, provisioning the rest of the company’s computing (IaaS), platform (PaaS) and service (SaaS) needs from the Cloud.
Nevertheless, Cloud computing does not truly offer new paradigms for tackling and harnessing the amount of data being generated in the digital economy. It is more of a complementary technology which new parallel processing paradigms and disciplines (i.e.
Big Data and Data Science) have mutually favoured from.
1.3 Big Data and Data Science
It is difficult to find a definition for Big Data, as the term has quickly spreaded across multiple industries and domains due to its generality and applicability to all fields and disciplines, including business, science, social, health, etc. One broadly accepted ap proximation for this buzzword might be the so-called three Vs, i.e. data that is too large in Volume, moves too fast and needs a prompt response (Velocity), and varies a lot in format, not fitting into any existing processing tool or data management system (Variety).
However, as sharply pointed out in Sicular (2013), these three Vs (originating from Gartner) just represent one of the parts of their definition. Quoting this article, “Big Data
is high-volume, -velocity and -variety information assets that demand cost-effective, in novative forms of information processing for enhanced insight and decision making”. It is then clear that the value of Big Data in the general sense is not intrinsic to the char acteristics of the data, but to the (cost-effective) innovations for information processing, and especially to the insights and decision making that will be enabled, being this last part one of the goals of this research.
The three Vs (see Figure 1.2) are a priori easier to understand though, not only because the idea of extracting value out of data is not new and somehow is widely accepted, but also because stressing too much the value of the innovations for information processing might seem biased towards technological companies (and their proprietary solutions), in an effort to force their customers to move to Big Data and capitalize on the latest trend. Furthermore, because of the probably badly chosen adjective (i.e. Big), many still think that volume is the most important dimension. This perception does
8 Chapter 1. Introduction
Figure 1.2: The three Vs in Big Data.
not logically fit in the current connected world, where the real value resides in tapping into the relevant sources of data (variety) and mashing them up for producing a real and lasting competitive advantage. In addition, velocity is often equated with near-real time analytics (as remarked again in Sicular (2013)), but it also deals with linking data sets coming at different speeds or adapting for changes in the temporal relationships between them.
One way or another, the availability of an heterogeneous but well-integrated ecosys tem for Big Data is now a reality. There are open source and commercial distributions available for institutions to roll out, and the only pitfall for its successful adoption seems to be the lack of both strategy and knowledge about what to do with these humongous amounts of data. This gets accentuated by the hype around Big Data, as well as the fact that the data revolution is happening alongside business as usual, which can be extremely overwhelming (Marr, 2015).
The lack of expertise in the field originates in the complexity of the tasks involved when extracting value from data, i.e. how to consolidate and govern, how to efficiently process and transform into insights, and how to report it in a way that all stakeholders get what they need (nothing less but nothing more). The diversity of the roles needed for such an endeavor makes it even more frustrating, often because those roles are not used to collaborating with each other in many (typical) traditional institutions. Examples for this might be business people and executives being unable and/or unwilling to understand what technology may do for them and what it is all about (even at a high level), or developers just focusing on their daily work, without the courage or strength to look beyond into the larger picture.
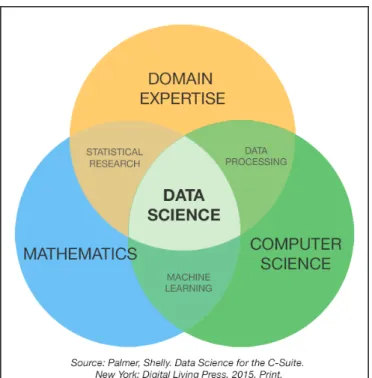
Data Science has emerged to specifically designate a new profession that is expected to fill this gap, and therefore make sense of the vast amounts of data that we find in every discipline and industry. Its definition is again a bit fuzzy, but everybody seems to agree on the fact that (i) it is something that has appeared for a reason (even before the term Big Data), (ii) needs to somehow evolve and further define its attributions, and (iii) should be taught to the next generations because the data amounts they will face will keep on soaring (Cleveland, 2001; Graham, 2012; Borne et al., 2009). Figure 1.3 shows the three fields which any Data Scientist should have enough expertise in. A deep mastery is not required in all those three pillars as it is obviously impractical in the least, but all those three skills must be present to some extent in any Data Scientist
role. These are in more detail:
Figure 1.3: Skill sets for a Data Scientist.
• Mathematics in general and descriptive/predictive statistics in particular. Data Scientists can explore data sets and identify patterns in data. They are acquainted in statistical modeling, probability models, pattern recognition, predictive analyt ics, sampling techniques, graph theory, etc. They can apply unsupervised learning methods and techniques (e.g. clustering, principal components analysis, graphical models and so on), supervised learning ones (e.g. classification, regression, decision trees, feature selection, cross-validation, etc), and most importantly, they should actually know each technique strengths and shortcomings and thus when to use each of them, when to combine several and so forth.
10 Chapter 1. Introduction
• Computer Science. Data Science happens inside computers and the data sets in-volved are normally high-volume, -velocity and -variety (Big Data). Therefore, models must be ready to be scaled to the sizes/volumes/variety of data sets found in real deployments. The ability to scale an algorithm requires expertise in Big Data techniques and distributed processing. Very much like statistical methods, one size will not fit all problems (Stonebraker and Cetintemel, 2005). Then, there is always a trade-off in the data processing techniques and frameworks to use in each situation. Coding skills are also mandatory and some authors even talk about hacking skills, deepening into the fact that this discipline is about creativity and perseverance, i.e. keep on trying until a reasonable solution to the problem is found.
• Domain expertise. A Data Scientist represents an evolution from the business or data analyst role. The formal training is similar as remarked in the other two skill sets, but what draws the Data Scientist apart is strong business acumen or field knowledge, coupled with the ability to communicate findings (or tell stories) to both technical and non-technical audiences in a way that can influence how an organization approaches a business challenge. Good Data Scientists will not just address business problems, they will pick the right problems that have the most value to the organization. Whereas a traditional data analyst may look only at data from a single source. e.g. a Customer Relationship Management (CRM) system, a
Data Scientist will most likely explore and examine data from multiple disparate sources. They will sift through all incoming data with the goal of discovering a previously hidden insight, which in turn can provide a competitive advantage or address a pressing business problem.
Therefore, Data Science is not simply about collecting and reporting on data, but also on looking at it from many angles, determining what it means and then recommending ways to apply the data. It is a discipline that requires an inquisitive mindset: exploring, asking questions, doing “what if" analysis and questioning existing assumptions and pro cesses. It also includes the communication of informed conclusions and recommendations across an organization’s leadership structure.
The need for multidisciplinary profiles is not something new. If we look at astron omy and astrophysics, we can identify two new interdisciplinary areas that have lately appeared. Those are astrostatistics (Sarro et al., 2014) and astroinformatics (Accomazzi
et al., 2013). Astrostatistics is a discipline that spans astrophysics, statistical analy
sis and data mining. It could be framed into the statistical research area of Figure 1.3. Furthermore, astroinformatics, which involves the combination of astronomy and Information and Communications Technology (ICT), might be represented in the data processing overlap in Figure 1.3.
By defining Data Science as being the intersection of such three complex subjects, i.e. computer science (Big Data), mathematics and the particular scientific or business domain, the expectations of finding talent with a suitable mix of these skill sets decrease substantially. One way of mitigating this scarcity is by setting up teams whose members span all three disciplines (when combined in a group), and use appropriate methodologies
and techniques to reduce the frictions that may arise in such diverse configurations. In addition, the exchange of ideas and knowledge sharing should be fostered so that a learning-by-doing culture can be established. Team members must be responsible and accountable for the overall team goals, as otherwise this recipe might not succeed.
1.4 Scientific Archives
The archival of scientific data and supporting documentation is crucial to research and innovation. The scientific reasons for preserving data derive from the fact that obser vations, knowledge and understanding are cumulative. We then believe that the more complete the record, the more we can extract from it. Observed data provide a base line for determining rates of change and for computing the frequency of occurrence of unusual events. The longer the record, the greater our confidence in the conclusions we draw from it. Our traditional observational records have portrayed frozen instants of reality. If preserved, they will continue to provide insights, but if neglected, they will melt away (Council, 1995).
There are thus strong motivations for preserving these scientific data sets:
• Many observations about the natural world are a record of events that will never be repeated exactly. Examples comprise observations of an atmospheric storm, a deep ocean current, a volcanic eruption, and the energy emitted by a supernova. Once lost, such records can never be replaced.
• Observed data provide a baseline for determining rates of change and for computing the frequency of occurrence of unusual events. They specify the observed envelop of variability. The longer the record, the greater our confidence in the conclusions we draw from it.
• A data record may have more than one life. As scientific ideas advance, new concepts may emerge (in the same or entirely different disciplines) from study of observations that led earlier to different kinds of insights. New computing technolo gies for storing and analyzing data enhance the possibilities for finding or verifying new perspectives through reanalysis of existing data records.
• The substantial investments made to acquire data records justify their preservation. The cost of preservation will almost always be smaller than the cost of observation. Because we cannot predict which data will yield the most scientific benefit in years ahead, the data that is discarded today may be the data that would have been invaluable tomorrow. This includes the raw data before any treatment is applied to it, because new ways of processing, calibrating and analysing will certainly produce different outcomes, usually with more quality and accuracy.
Scientific archives in the fields of astronomy and astrophysics follow these patterns and reasoning. Any astronomical and astrophysical research is nowadays likely to include data coming from a variety of archives, typically collected by sky surveys operating at
12 Chapter 1. Introduction
different wavelengths. This reinforces the idea that the knowledge acquired by each and every experiment is cumulative, effectively leading to more robust results. Furthermore, the cost of storing, preserving and making this data available to the scientific community is way lower than the cost of its acquisition. This is mainly due to:
• High assembly and operational costs of ground based telescopes. These telescopes are normally installed at high altitude places, avoiding a significant portion of the Earth’s atmosphere, to diminish the effects of the weather conditions, turbulences, absortion of infrared and submilimiter wavelenths by water vapor, etc.
• Very expensive costs to assemble, launch and operate a space satellite. Astronom ical space missions are commonly required when we need to perform high accurate measurements or observe far distant objects. The Gaia mission (Gaia Collaboration
et al., 2016b; Mignard, 2005) or the Herschel Space Observatory (HSO) (Pilbratt,
2008) are good examples of such space missions.
• There has been a significant boost of open source software initiatives (Laurent,
2004). This holds true for many of the engines and tools in the Big Data and Data Science fields, reducing entry barriers for adoption and lowering operational costs.
• The commoditization of storage and data processing hardware together with the fact that these new open source tools and engines are designed to run on this cheaper hardware, leads to much lower costs.
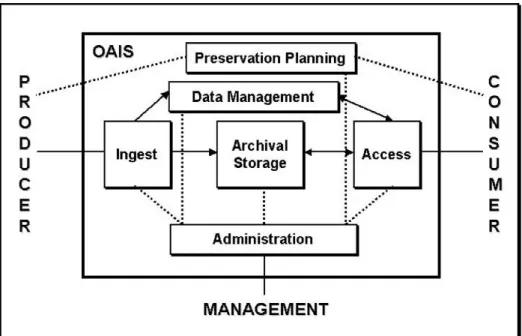
However, the complexity of the different data archives pose a lot of issues on its own for effectively and efficiently squeezing out their inherent value. The architecture of a scientific archive is thus something difficult to generalize. The Open Archival Informa tion System (OAIS), in its reference model (Lavoie, 2004), identifies and describes six services or functional components that any scientific archive should implement. Those refer to Ingest, Archival Storage, Data Management, Preservation Planning, Access and
Administration. These six building blocks ensure respectively that the data can be taken to the archive, digitally stored, its metadata is made available, there is a preservation strategy in place, data can be accessed by relevant parties and its day-to-day operations and activites are defined.
Furthermore, the availability of more and more observed data, with different degrees of overlap, raises the need to combine it in a meaningful way, producing synergies along the way. We refer to this concept as data fusion, which is no more than the integration of multiple data sets and knowledge about the same real-world object or phenomena into a consistent, accurate, and useful representation. This is crucial for scientific research as it provides different observations and perspectives about the same reality. As an example in the field of astronomy, data fusion facilitates (among other things) the task of cross matching objects from different catalogues surveyed at different wavelengths, enabling both a richer exploration of the galaxy and ways of cross-validating hypotheses.
To address this challenge, virtual observatories are being established in a wide range a disciplines, supported by a variety of agencies. Groups such as the International Virtual
Observatory Alliance (IVOA), Planetary Data System (PDS) and the Space Physics Archive Search and Extract (SPASE) consortium are defining metadata standards to aid in archiving and sharing of information resources. The role of the virtual observatories is to locate available resources and help users find what they need and then gain access to it. There are many different existing resource providers from which virtual observatories must collect descriptions for. These resource providers may have associations with other providers so the topology of information exchange can often become complicated (King
et al., 2008).
In Astronomy, the Virtual Observatory (VO) was born to address interoperability and integration of both tools and data sets, utilizing the Internet to form a scientific research environment in which scientific research programs can be conducted. Its main goal is to allow transparent and distributed access to data available worldwide. This naturally enables scientists to discover, access, analyze, and combine heterogeneous data collections in a user-friendly manner. VO standards are being driven and agreed within the IVOA. These standards focus on information registries, query languages, data models, semantics, data access, protocols and visualization.
1.5 Motivation and Main Objectives
Scientific data output is currently increasing at 30% every year (Pryor, 2012). Some studies (Vines et al., 2014) conclude that the usage of existing scientific data sets decline 17% per year, with 80% of them being simply unavailable after 20 years. Given that a lot of research endeavours are nowadays publicly funded, more and more presure is being allocated to them in order to get an optimum return on investment, not only from the specific project outcome perspective, but also from the potential synergies produced when leveraging the results of other existing undertakings (and those to come).
This is particularly the case in astronomy and astrophysics, where the data being (or to be) collected by both ground and space based instruments and satellites is growing exponentially. Some examples of experiments and missions producing more and more data include the Gaia mission itself (Gaia Collaboration et al., 2016b; Mignard, 2005), Euclid (Laureijs et al., 2011), the Large Synoptic Survey Telescope (LSST) (Ivezic and
Tyson, 2008) or the Square Kilometer Array (SKA) (Dewdney et al., 2009). They will
produce data sets ranging from a petabyte for the entire mission in the case of Gaia to 10 petabytes of reduced data (output data after initial processing) per day in the SKA. This data deluge in astronomy has fostered the appearance of two new interdisci plinary areas, the aforementioned astrostatistics (Sarro et al., 2014) and astroinformatics
(Accomazzi et al., 2013), as a way of seamlessly integrating the different skillsets found
in disciplines like astronomy/astrophysics, computer science and statistics. These new disciplines will efficiently combine the ever-increasing sources of data in the field. The succesful integration of the architecture, data sets and skills will be the key to increase research output both in volume and in quality. This will certainly allow scientists to do exploration and modeling in a smooth, integrated and effective way.