Solid phase extraction and gas chromatographic – mass
spectrometric analysis of phthalates in surface water:
method development and validation
1
Ilona Kerienė
1,
Audrius Maruška
1*,
Jūratė Sitonytė
21 Department of Biochemistry and Biotechnologies, Vytautas Magnus University, Vileikos 8, LT-44404 Kaunas, Lithuania 2 Department of Physics, Šiauliai University, P. Višinskio 19, LT-77156 Šiauliai, Lithuania
* corresponding author. e-mail: [email protected]
The aim of the research was to apply and optimize the solid phase extraction (SPE) and gas chromatographic – mass spectrometric (GC–MS) method for the analysis of phthalates in surface water and carry out the necessary method validation steps.
Two standard mixtures of phthalates were used: the self-composed diethyl phthalate (DEP) and di(n-butyl) phthalate (DnBP) standard mixture (EBS), and EPA506 standard mixture consisting of seven phthalates. Detection limits for EPA506 varied in the range 45– 500 ng/L, depending on the compound. The linear dependence of the EPA506 standard mix-ture components was in the range 0.1–54 μg/L. SPE was performed using a column filled with C-18 silicagel adsorbent in a system isolated from atmospheric contamination. The recovery values of EBS components when using a 1 : 1 mixture of ethyl acetate and dichlormethane as an eluent were 79 ± 5% for DEP and 97 ± 11% for DnBP. The background signals of DnBP and di(2-ethylhexyl) phthalate were determined. The method was applied for the analysis of samples from the Venta river (Lithuania) in 2010 and 2011. The variation of pollutant con-centrations was determined. DnBP in December 2010, January, March, and April 2011 were 0.14 µg/L, 2.7 µg/L, 1.45 µg/L, and 2.2 µg/L, respectively; DEHP concentration in January 2011 was 2.1 µg/L, in April 0.23 µg/L, and DEP concentration in March 2011 was 0.61 µg/L. Key words: surface water, phthalates, solid phase extraction, gas chromatography – mass spectrometry
INTRODUCTION
In the last two decades, it has been revealed that certain compounds, referred to as environmental estrogens or en-docrine disrupting compounds, can interfere with the endo-crine system of hormone production and transmission. They are comprised of different classes of organic compounds. Recently, phthalates, which are widely applied as plasti-cizers in the production of floor coverings, rubber items, and paints [1], have been undergoing intensive research. In plastics, phthalates do not have chemical bonds; therefore, under favourable conditions, they can migrate from plastics and spread in the environment. Despite its harmful effect, the consumption of plastics has increased almost 20 times during the last 50 years. Over 9 billion kilos of phthalates,
half the amount of which are di(2-ethylhexyl) phthalates [2], are used annually in the world in polyvinylchloride pro-duction. Plasticizers enter surface water together with rain water and sewage from water treatment plants. Their con-centration in natural waters is very low; therefore, sensitive methods of modern analysis, such as solid phase extraction (SPE) and gas chromatography – mass spectrometry,are usually used. For SPE columns or extraction discs, the em-bedded silicagel with hydrophobic octadecyl group (C18) matrices are applied [3].
Effective analyte desorption from adsorbent is one of the most important steps in the process of sample preparation. Fatoki and co-authors optimised the conditions of SPE by ap-plying a mixture of methanol and dichlormethane solvents
1 This work was presented at the 5th international conference “The vital Nature Sign”, Kaunas, may 19–21, 2011.
of different ratio for phthalate desorption. The highest re-covery was obtained using solvents of equal mass fractions (1 : 1 m/m) [4]. In the standard EPA method issued in the USA, the recommended phthalate SPE extractant is a 1 : 1 mixture of ethyl acetate and dichloromethane. In the stand-ard method provided in ISO 18856 : 2004, it is recommended to use only the ethyl acetate non-chlorinated solvent [5–7].
The preconcentration of determinable phthalate com-pounds in water depends on the efficiency of the SPE method. Jara et al. carried out studies with several different concentra-tions of a standard solution of phthalate and using a polysty-rene–divynilbenzene (PS-DVB) adsorbent, and determined that the recovery of branched phthalates and phthalates with long alkyl chain, di(2-ethylhexyl) phthalate and di(n-octyl) phthalate (DEHP and DnOP) was highest when the concent-ration of such compounds in water samples did not exceed 3 µg/l [8]. With increasing the amounts of analytes 100 and more times, the recovery was only up to 36–20%. This fact is explained by the low phthalate solubility in water; therefore, it was suggested to add methanol into a sample before extrac-tion. The recovery of phthalates with a short alkyl chain and low-branched di(n-butyl) phthalate and butyl benzyl phtha-late (DnBP and BBzP) was 85–99% [8].
When preparing samples, an important factor is the back-ground contamination by phthalates. Tiepont and co-authors, while performing routine analyses of phthalate, determined that the background air was mostly polluted with diisobutyl phthalate (DIBP), DnBP and DEHP [9]. A group of USA sci-entists analysed a blank sample applying the USA EPA me-thod 525.2 [7] and for sample preparation using SPE and sol-id phase microextraction (SPME). They have found that the background contamination of the adsorbent is lower using the SPE, when the amounts of solvents used to condition the SPE cartridge do not exceed 5 ml. It is worth mentioning that in almost all samples traces of DnBP were found [10].
For separation of analytes, gas or liquid chromatography coupled to mass spectrometry or flame ionisation detection are used. The method of liquid chromatography is applied when performing the analysis of phthalate ester isomers, since, according to David [3], gas chromatography is not ef-fective in separation of these compounds. The method of se-lected ion monitoring (SIM) is applied in mass spectrometry to analyse the composition of samples.
The aim of the present research was to apply and optimize the solid phase extraction and gas chromatographic – mass spectrometric method for the analysis of phthalates in surface water and to perform the required method validation steps.
EXPERIMENTAL
Standards and reagents
The 506 Laboratory Performance Check Mix in purge-and-trap grade methanol (99.9%), (EPA506) was purchased from Restek (USA): dimethyl phthalate (DMP) 100 µg/ml, diethyl phthalate (DEP) 100 µg/ml, di(n-buthyl) phthalate (DnBP)
100 µg/ml, buthyl benzyl phthalate (DMP) 250 µg/ml, di(2-ethylhexyl) adipate (DEHA) 1200 µg/ml, di(2-di(2-ethylhexyl) phthalate (DEHA) 250 µg/ml, di(n-octyl) phthalate (DnOP) 650 µg/ml. The standards DEP and DnBP, were purchased from Sigma-Aldrich (USA). Lichrosorb RP-18 silicagel, 7 µm particles, 100Å pore size, methanol LiChrosolv (CH3OH) (99.9%, HPLC) were from Merck (Germany), ethyl acetate (CH3COOC2H5) (analytical grade) (99.5%), dichlormethane (CH2Cl2) (GC purity grade) (99.5%), sodium sulphate (Na2SO4) (analytical grade) (99.0%), sulphuric acid (analytical grade) (95–97%) were purchased from Sigma-Aldrich. Nitrogen gas, N2, (99.9%) was purchased from ELME MESSER (Lithuania).
Standard EPA506 and EBS stock solutions prepared in methanol were stored at +4 °C.
Sample collection
Samples of surface water were taken from the Venta river flowing across the Kuršėnai town (Šiauliai region, Lithua-nia), below the outlet of a biological water treatment plant. Sampling in a stream, manually, at a depth of ca. 30 cm was carried out. Samples were poured into amber glass bottles, acidified to pH 2 and placed into a mobile refrigerator. At the laboratory, the samples were filtered through 0.8 µm mem-brane filters and stored at +4 °C until extraction.
Extraction
To optimize the solid phase extraction (SPE) method, three solutions of different concentrations were tested. In the mix-ture of two standard compounds (EBS), the concentration of both phthalates was 12.5 µg/L. In one EPA506 solution, the standard concentrations of the compounds varied from 1.23 to 15 µg/L and in another solution from 0.45 to 5.4 µg/L. The extraction system isolated from the environment with a 50 ml column filled with 1000 mg of Lichrosorb C18 adsorb-ent was used.
The adsorbent was rinsed with CH3OH, then with CH 3-COOC2H5 and a 1 : 1 mixture of CH3COOC2H5 and CH2Cl2 (v/v), dried in vacuum for ca. 1 minute, and conditioned with the sample water (with methanol additive). The extraction flow speed was 1 drop/s. After extraction, the adsorbent was rinsed twice with 5 ml of 10% CH3OH and dried for ca. 3 min in vacuum. For desorption, 2.5 ml of CH3COOC2H5 and 2.5 ml of 1 : 1 mixture of CH3COOC2H5 and CH2Cl2 (v/v) was added twice. Traces of moisture were collected with water-free Na 2-SO4. The extract was rinsed twice with 0.75 ml of CH2Cl2 and concentrated with N2 gas.
GC–MS analysis
Standard solutions and extracts were analysed by GC–MS: a GC–2010 Shimadzu (Japan) apparatus with a capillary col-umn (30 m × 0.25 mm × 0.25 mm) (DB-5ms) coated with non-polar 5% phenyl methylpolysiloxane stationary phase was used for separation of the analytes. Samples were in-jected employing an AOC-20i auto-injector (Japan); 1 µl of a sample was injected in a split mode (split ratio 10 : 1). The
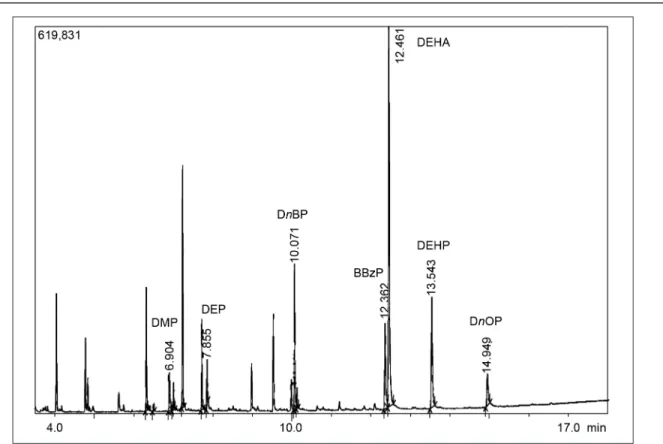
flow rate of the carrier gas (He) was 1 ml/min. The injection temperature was 270 °C. The column temperature gradient was as follows: 80 °C (5 min) to 260 °C at 18 °C/min and then to 300 °C at 6 °C/min. The total duration of the analysis was 18 minutes; the retention time of each compound is provided in Table 2.
Electron ionization was performed at 70 eV. To determine the composition of the compounds, a GC MS–QP2010 Shi-madzu mass spectrometer was used in a selected ion moni-toring (SIM) mode. Ion characteristics for the analytes are provided in Table 2.
RESULTS AND DISCUSSION
Comparison of extraction protocols and method valida-tion
To apply SPE using an EBS standard mixture, several opti-mization steps were performed: 7.5 ml of solvents was esti-mated to be sufficient for an effective desorption of the ana-lytes. Upon replacing the preconcentration of extracts by air with nitrogen gas, the duration of the process decreased from 2.5 hours to 45 minutes.
SPE is affected by the phthalates present in the bacground air of the laboratory. When analysing such compounds, their concentration in the ambient air increases even more [5]. In order to reduce the influence of the background, an extrac-tion system isolating the sample from environmental expo-sure was set. Recovery values obtained when using the EBS standard for SPE optimization were close to the recommend-ed values (Fig. 1).
The further steps of optimization were performed with an EPA506 mixture of standards by testing two different con-centrations of the analytes.
To assess the accuracy of the results, each extraction of water with a respective spike was performed at least three times. The repetitions were carried out day after day, without changing the extraction conditions and extraction setup.
Extraction of the internal standard, in which compound concentrations vary from 0.45 to 5.4 µg/L, showed that the recovery of many compounds corresponded to ISO and USA
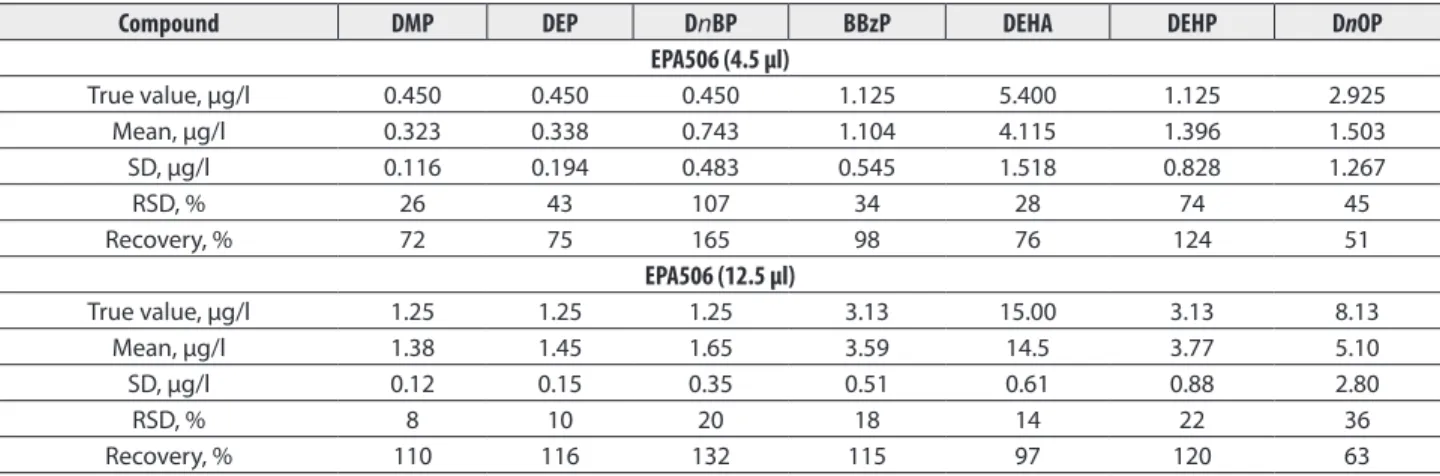
EPA standard requirements and varied from 102 ± 20% for BBzP to 110 ± 22% for DEHP; however, the obtained RSDs were high – from 26% for DMP to 34% for BBzP. The DnBP and DEHP analysis was rather complicated, i. e. the recovery of DnBP was 165 ± 64% and of DEHP 124 ± 69%. Relative standard deviations for these compounds were 107% and 74%, respectively. The latter phthalates are the main compo-nents of background contamination: therefore, the resultant dispersion affects the accuracy of the analysis (Table 1).
The average recovery of DnOP was 51% and RSD was 45%. This compound is considered in ISO 18856 : 2004 standard in which the permitted DnOP recovery is 60–75% [5].
The problems of accurate measurement of small vol-umes are regarded as one of the reasons for excessive RDS values.
When using the concentrations of standard compounds from 1.25 (DEP) to 15.0 (DEHA) µg/L (EPA506 mixture of phtalates) to optimize the SPE, the results, complying with
Table 1. SPE recovery and accuracy data (250 ml water of the analysis, pH 2, with 5 ml of CH3OH spiked with EPA 506 mixture of standards)
Compound DMP DEP DnBP BBzP DEHA DEHP DnOP
EPA506 (4.5 µl) True value, µg/l 0.450 0.450 0.450 1.125 5.400 1.125 2.925 Mean, µg/l 0.323 0.338 0.743 1.104 4.115 1.396 1.503 SD, µg/l 0.116 0.194 0.483 0.545 1.518 0.828 1.267 RSD, % 26 43 107 34 28 74 45 Recovery, % 72 75 165 98 76 124 51 EPA506 (12.5 µl) True value, µg/l 1.25 1.25 1.25 3.13 15.00 3.13 8.13 Mean, µg/l 1.38 1.45 1.65 3.59 14.5 3.77 5.10 SD, µg/l 0.12 0.15 0.35 0.51 0.61 0.88 2.80 RSD, % 8 10 20 18 14 22 36 Recovery, % 110 116 132 115 97 120 63
Fig. 1. Recovery of solid phase extraction of EBS standard mixture compounds and RSD, %, n = 3
the ISO standard for eluted compounds, were obtained before the thirteenth minute (Fig. 2).
The recovery of DEHP was 120% and of RSD 22% (Table 1). The obtained results quite well coincide with interlabora-tory analysis results claimed in the standard [5]. Casajuana in [11] reported the problem of DEHP determination.
The results for estrogen DnOP with the longest alkyl chain did not improve upon increasing the test concentration: ca. 40% RSD was obtained.
The background contamination with phthalates is una-voidable; however, it was controlled for each SPE series by analysing a blank sample. The background concentration of DnBP when using an isolated extraction system decreased from 0.9 to 0.3 µg/L and for DEHP from 0.74 to 0.27 µg/L.
All extraction solvents showed traces of DnBP concent-ration of ca. 0.15 µg/L. Tienpont and co-authors [9] have also determined the main background contamination to consist of DnBP and DEHP.
To assess the suitability of the SPE and GC–MS analy-sis methods, the limits of detection and determination as well as the linear range of determination were evaluated. The limit of detection (LOD) calculated at a signal-to-noise ratio of 3 varied from 45 ng/l (for DnBP) to 500 ng/l (for DnOP).
To produce the calibration graphs, eight EPA506 standard solutions of different concentrations were prepared. The low-er limit of the linear detlow-ermination range, depending on the compound, varied from 0.1 to 0.625 µg/l, and the maximum values were up to 4.5–54 µg/l. The calculated correlation coef-ficients R2 were within 0.986–0.995 (Table 2).
Irrespective of analyte structure, the compounds accu-rately elute according to their retention indices. The stand-ard deviation for elution time is only parts of millisecond (0.0001–0.03 min), i. e. within the requirements of the ISO 18856 : 2004 standard method (±0.03 min) [5].
Table 2. Compounds studied, retention time (Rt), ions monitored (quantification ion in bold), detection limits (LOD), linear range and correlation coefficients
Analyte Rt, min Main ions, m/z LOD, ng/l Linear range, µg/l R2
DMP 6.88 163, 77, 223 100 0.3–4.5 0.992 DEP 8.84 149, 105, 177 100 0.3–4.5 0.994 DnBP 11.06 149, 93, 205 45 0.1–4.5 0.995 BBzP 12.34 149, 91, 206 250 0.625–11.25 0.992 DEHA 12.44 129, 57, 147 300 0.54–54 0.993 DEHP 13.52 149, 57,167 60 0.1–11.25 0.991 DnOP 14.99 149, 57, 279 500 0.625–29.25 0.986
Analysis of samples from the Venta river
The method of determining phthalate esters in surface water was applied for the analysis of samples from the Venta river. At least 4 litres of surface water were taken. The analyses were carried out according to the internal standard (the concen-trations of compounds were 1.25 to15 µg/L) and without the internal standard.
Analyses carried out in December to April showed that phthalate esters presumably entered the river together with sewage (Fig. 3). The main contaminant was DnBP: the mini-mum pollution by DnBP was 0.14 µg/L in December, where-as in April its concentration wwhere-as almost 16 times higher, i. e. 2.2 µg/L (Fig. 4).
A very high pollution with phthalates was determined in January: the DnBP concentration was 154 µg/L and the DEHP concentration 2.1 µg/L. A strong signal of diisobutyl phthalate was obtained, which had not been validated in the method but was recognised according to quantitative ions and mass spec-tral library. In another sample taken in January, the concent-ration of DnBP was 2.7 µg/L. DEP was detected in this sample, but its concentration was below the detection limit.
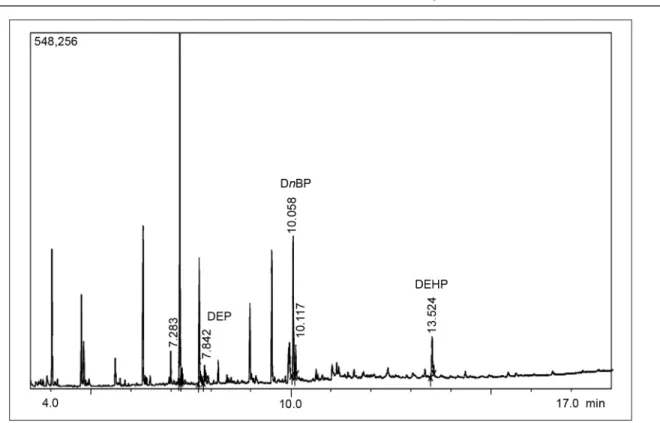
In March, the DnBP concentration was 1.45 µg/L, the DEP concentration 0.61 µg/L, and the DEHP concentration 0.23 µg/L (Fig. 3).
The determined concentrations of phthalates may be re-garded as a concentrated pollution. Further the contaminants are undoubtedly diluted with the clean water of the river, and presumably water biota is not affected by toxicity; however, of major concern is the fact that this river of the Baltic Sea basin is contaminated with environmental estrogens.
CONCLUSIONS
The maximum recovery of SPE was obtained using the sam-ple extraction setup, which is isolated from the environment, and 7.5 ml of the 1 : 1 mixture of ethyl acetate and dichlo-romethane as a desorption solvent for the analytes and nitro-gen gas for conditioning the extraction cartridge.
High SPE recoveries and accurate quantitative data while performing gas chromatographic – mass
spectromet-Fig. 3. GC–MS analysis of the Venta river water; sample prepared using SPE without internal standard, March 2011
Fig. 4. Phthalate distribution in the Venta river during December to April (2010 / 2011)
ric analysis were obtained for phthalates with the shorter alkyl chain: for DMP, DEP, BBzP the recovery varied within 72–116%.
DnBP and DEHP were determined as the main compo-nents of background contamination. Background contami-nation with DnBP of ca. 0.15 µg/L was determined for the extraction solvents.
The variation of DnBP, DEP and DEHP pollutants from December to April 2010 / 2011 in the river Venta was deter-mined. DnBP concentrations in December 2010, January, March and April 2011 were 0.14, 2.7, 1.45, 2.2 µg/L, respec-tively; DEHP concentration in January 2011 was 2.1 µg/L, in April 0.23 µg/L, and the DEP concentration in March 2011 was 0.61 µg/L.
Received 6 September 2011 accepted 15 September 2011
References
1. h.-Sh chang, K.-h. choo, B. lee, S.-j. choi, J. Hazard. Mater., 172, 1 (2009).
2. T. lovekamp-Swan, B. j. Davis, Environ. Health Perspect.
111(2), 139 (2003).
3. F. David, P. Sandra, B. Tienpont, F. vanwalleghem, m. iko-nomou, in a. c. Staples (ed.), The Handbook of Envi ronmental Chemistry, vol. 3, Part Q: Phthalate esters, Springer, New York (2003).
4. O. S. Fatoki, a. Noma, Water, Air and Soil Pollution, 140, 85 (2002).
5. iSO18856 : 2004, Water quality – Determination of select-ed phthalates using gas chromatography – mass spectro-metry.
6. USa ePa, method 506 rev. 1.0.
7. USa ePa method ml525.2 rev. 6-20-07.
8. S. jara, c. lysebo, T. Grebrokk, e. lundanes, Anal. Chim. Acta, 407, 165 (2000).
9. B. Tienpont, F. David, e. Dewull, P. Sandra, Chromatography,
61(7/8) (2005).
10. Dirty background for SPe and SPme [http://www.separa-tionsnow.com access via internet in 2011 03 17].
11. N. casajuana, S. lacorte, Chromatography, 57(9/10) (2003).
Ilona Kerienė, Audrius Maruška, Jūratė Sitonytė
FTALATŲ NUSTATYMAS PAVIRŠINIAME VANDE-NYJE KIETAFAZĖS EKSTRAKCIJOS IR DUJŲ CHROMATOGRAFIJOS–MASIŲ SPEKTROMETRI-JOS METODU: ANALIZĖS METODO DIEGIMAS IR ĮTEISINIMAS
S a n t r a u k a
Šio darbo tikslas buvo pritaikyti ir optimizuoti kietafazės ekstrak-cijos ir dujų chromatografijos – masių spektrometrijos metodą ftalatų analizei paviršiniame vandenyje ir atlikti būtinus šio meto-do įteisinimo veiksmus. Šiuo tikslu buvo naumeto-dojami du standartų mišiniai: laboratorijoje paruoštas dietilftalato (DEP) ir di(n-butil) ftalato (DnBP) standartų mišinys (EBS) ir EPA506 standartų miši-nys, sudarytas iš septynių ftalatų. Apskaičiuotos metodo aptikimo ir nustatymo ribos. EPA506 standartui, atsižvelgus į junginį, aptikimo ribos kito nuo 45 ng/l iki 500 ng/l, tiesinė priklausomybė buvo in-tervale nuo 0,1 μg/l iki 54 μg/l. Kietafazei ekstrakcijai atlikti naudo-ta C18 silikageliu pakraunaudo-ta kolona ir naudo-taikynaudo-ta izoliuonaudo-ta nuo aplinkos ekstrakcijos sistema. EBS standarto išgava, naudojant 1 : 1 etiloace-tato ir dichlormetano mišinį, buvo 79 ± 5 % DEF ir 97 ± 11% DnBF. Nustatytas DnBP ir di(2-etilheksil)ftalato foninės taršos signalas. Įteisintas metodas pritaikytas ftalatų analizei Ventos upės pavirši-niame vandenyje. Taršos kaita matuojant 2010–2011 m. DnBF buvo gruodį, sausį, kovą, balandį atitinkamai 0,14 µg/l, 2,7 µg/l, 1,45 µg/l, 2,2 µg/l; DEHF– sausį 2,1 µg/l, kovą 0,23µg/l ir DEF kovą 0,61 µg/l.