2015
Guidance on the application of cable median
barrier: tradeoffs between crash frequency, crash
severity, and agency costs
Brendan James Russo Iowa State University
Follow this and additional works at:https://lib.dr.iastate.edu/etd
Part of theCivil Engineering Commons, and theTransportation Engineering Commons
This Dissertation is brought to you for free and open access by the Iowa State University Capstones, Theses and Dissertations at Iowa State University Digital Repository. It has been accepted for inclusion in Graduate Theses and Dissertations by an authorized administrator of Iowa State University Digital Repository. For more information, please contactdigirep@iastate.edu.
Recommended Citation
Russo, Brendan James, "Guidance on the application of cable median barrier: tradeoffs between crash frequency, crash severity, and agency costs" (2015).Graduate Theses and Dissertations. 14614.
Guidance on the application of cable median barrier: Tradeoffs between crash frequency, crash severity, and agency costs
by
Brendan James Russo
A dissertation submitted to the graduate faculty in partial fulfillment of the requirements for the degree of
DOCTOR OF PHILOSOPHY
Major: Civil Engineering (Transportation Engineering) Program of Study Committee:
Peter Savolainen, Major Professor Alicia Carriquiry
Jing Dong Anuj Sharma R. Christopher Williams
Iowa State University Ames, Iowa
2015
TABLE OF CONTENTS
Page
LIST OF FIGURES ...iv
LIST OF TABLES ...vi
DISCLAIMER ... viii ACKNOWLEDGMENTS ...ix ABSTRACT ...x CHAPTER 1 INTRODUCTION ...1 1.1 Statement of Problem ...1 1.2 Research Objectives ...3 1.3 Organization of Dissertation ...5
CHAPTER 2 LITERATURE REVIEW ...6
2.1 Safety Performance of Cable Median Barriers ...6
2.2 Cable Median Barrier Installation Guidelines ...9
2.3 Economic Analyses of Cable Median Barriers ...13
2.4 Feedback from Emergency Responders ...15
2.5 Comparison with Other Median Barrier Types ...19
2.6 Literature Review Summary and Areas of Research Need ...20
CHAPTER 3 DATA COLLECTION AND DESCRIPTION ...24
3.1 Cable Median Barrier Installation Data ...24
3.2 Roadway Geometry and Traffic Volume Data ...26
3.2.1 Cable Barrier Roadway and Traffic Volume Data ...26
3.2.2 Comparison Segment Roadway and Traffic Volume Data ...32
3.3 Traffic Crash Data ...34
3.3.1 Cable Barrier Segment Crash Data ...34
3.3.2 Comparison Segment Crash Data ...41
CHAPTER 4 BEFORE AND AFTER ANALYSIS OF CABLE BARRIER PERFORMANCE ...43
4.1 Comparison of Target Crashes Before and After By Crash Severity and Crash Type ...43
4.2 Comparison of Before and After Target Crashes by Road Conditions ...49
4.3 Emergency Vehicle Crossover-Related Crashes ...51
4.4 Analysis of Cable Barrier Strike Crashes ...54
4.5 Analysis of Motorcycle Crashes ...58
4.6 Analysis of Cable Barrier Performance by Number of Cables ...60
4.7 Development of Safety Performance Functions ...62
4.7.1 Negative Binomial Regression Modeling ...62
4.7.2 Cable Median Barrier Segment SPFs ...64
4.7.3.No Barrier Segment SPFs ...67
4.8 Observational Before and After Empirical Bayes (EB) Analysis ...71
4.8.1 Empirical Bayes (EB) Statistical Methodology ...73
4.8.2 Results of the Before-After Empirical Bayes (EB) Analysis...75
4.9 Cable Barrier Economic Analysis ...77
4.9.1 Cable Barrier Installation and Maintenance Costs ...77
4.9.2 Cost of Crashes by Severity ...79
4.9.3 Benefit/Cost Analysis ...80
4.10 Cable Median Barrier Installation Guidelines ...83
4.10.1 Predictive Models for Segments Before Cable Barrier Installation ...85
4.10.2 Predictive Models for Segments After Cable Barrier Installation ...86
4.10.3 Effects of Number of Lanes ...90
4.10.4 Effects of Cable Barrier Lateral Offset ...90
4.10.5 Snowfall Impacts ...92
4.10.6 Effects of Horizontal Curvature ...93
4.10.7 Guideline Use...94
CHAPTER 5 COMPARISON WITH OTHER BARRIER TYPES ...95
5.1 Comparison of Crash Outcomes between Different Median Barrier Types ...95
5.2 Development of SPF for All Barrier Types ... 101
5.3 Median Crash Severity Analysis ... 105
5.3.1 Ordered Logit Regression Modeling ... 105
5.3.2 Results of the Median Crash Severity Analysis ... 107
5.4 Barrier Strike Outcome Analysis ... 110
5.4.1 Multinomial Logit Modeling ... 110
5.4.2 Results of the Barrier Strike Outcome Analysis ... 111
CHAPTER 6 SUMMARY AND CONCLUSIONS ... 115
6.1 Summary and Conclusions ... 115
6.2 Limitations and Directions for Future Research ... 123
LIST OF FIGURES
Page
Figure 1 AASHTO Median Barrier Guidelines ...10
Figure 2 Guideline for Installing Median Barriers on Texas Interstates and Freeways ...11
Figure 3 Emergency Responder Survey ...16
Figure 4 Map Showing Michigan Cable Barrier Installation Locations ...27
Figure 5 Map Showing MDOT Regions ...29
Figure 6 Screen Shot from Google Earth Showing Cable Median Barrier ...30
Figure 7 Target 1 Crash – Median Crash ...37
Figure 8 Target 2 Crash – Cross-Median Event ...37
Figure 9 Target 3 Crash – Cross-Median Crash ...38
Figure 10 Target 4 Crash – Contained by Cable Barrier ...38
Figure 11 Target 5 Crash – Penetrated Cable Barrier but Did Not Enter Opposing Lanes ...38
Figure 12 Target 6 Crash – Penetrated Cable Barrier and Entered Opposing Lanes, but did not Strike Opposing Vehicle ...39
Figure 13 Target 7 Crash – Penetrated Cable Barrier and Entered Opposing Lanes, and Struck Opposing Vehicle ...39
Figure 14 Target 8 Crash – Struck Cable Barrier and Re-Directed Onto Travel Lanes ...39
Figure 15 Percent of Target Crashes by Crash Severity and Analysis Period ...45
Figure 16 Before and After Cable Barrier SPF Predicted PDO/C Crashes ...66
Figure 17 Before and After Cable Barrier SPF Predicted B Crashes ...67
Figure 19 No Barrier and Cable Barrier (before) SPF Predicted PDO/C Crashes ...70
Figure 20 No Barrier and Cable Barrier (before) SPF Predicted B Crashes ...70
Figure 21 No Barrier and Cable Barrier (before) SPF Predicted K/A Crashes ...71
Figure 22 Example of Fluctuation in Crashes Before and After Countermeasure Implementation ...72
Figure 23 Predicted Number of Target Crashes by Severity Level Based upon Directional Average Daily Traffic and Median Width ...87
Figure 24 Effects of Offset Distance on Target PDO/C Crash Frequency ...91
Figure 25 Effects of Snowfall on Target PDO/C Crash Frequency ...92
Figure 26 Effects of Horizontal Curvature on Target PDO/C Crash Frequency ...93
Figure 27 Median Barrier Treatment Options Used on Michigan Freeways ...95
Figure 28 Comparison of Severity Distributions by Median Barrier Type ...99
Figure 29 Effects of Snowfall on Total Target Crash Frequency Among All Barrier Types ...104
Figure 30 Effects of Horizontal Curvature on Total Target Crash Frequency Among All Barrier Types ...104
LIST OF TABLES
Page Table 1 Summary of Cross-Median Crash Reductions in Several States After
Cable Median Barrier Installation ... 7
Table 2 Summary of Cable Barrier Effectiveness in Preventing Penetration ... 9
Table 3 Summary of Several State’s Cable Median Barrier Installation Guidelines ....12
Table 4 High-Tension Cable Barrier Survey Results ...17
Table 5 Reasons for Difficulty in Responding to Crashes on Roadways with Cable Barrier ...18
Table 6 Summary of Cable Median Barrier Installations ...28
Table 7 Summary of Cable Barrier Roadway Segments ...31
Table 8 Summary of Comparison Roadway Segments ...33
Table 9 Summary of Average Annual Target Crashes by Installation and Analysis Period ...46
Table 10 Before and After Target Crashes by Type and Severity ...48
Table 11 Summary of Before and After Crash Rates ...49
Table 12 Summary of Target Rollover Crashes by Period ...49
Table 13 Summary of Target Crashes by Road Condition and Analysis Period ...50
Table 14 Summary of Target Crashes by Road Condition, Severity, and Analysis Period ...51
Table 15 Summary of EV Crossover-Related Target Crashes by Severity and Analysis Period ...52
Table 16 Summary of Cable Barrier Strikes by Severity and Crash Outcome Scenario ...55
Table 18 Summary Cable Barrier Strike Crashes by Road Condition
and Crash Outcome Scenario ...58
Table 19 Summary of Motorcycle Involved Target Crashes ...60
Table 20 Summary of Cable Barrier Strikes by Number of Cables ...61
Table 21 Before and After Average Annual Target Crashes Per Segment by Severity ...65
Table 22 Before and After SPFs for Cable Barrier Road Segments ...66
Table 23 No Barrier Control Segments Average Annual Target Crashes Per Segment...69
Table 24 SPFs for No Barrier Control Road Segments ...69
Table 25 High-Tension Cable Barrier Cost per Mile in Several States ...78
Table 26 Average Crash Costs by Injury Severity ...80
Table 27 Summary of Benefit/Cost Analysis ...81
Table 28 PDO/C-injury SPF Results for Cable Barrier Segments Based on Site Characteristics ...90
Table 29 Summary of Thrie-Beam Strikes by Severity and Crash Outcome Scenario ...97
Table 30 Summary of Concrete Barrier Strikes by Severity and Crash Outcome Scenario ...98
Table 31 Percent of Single- vs. Multi-Vehicle Crashes by Barrier Type ...98
Table 32 Summary of Target Crash Characteristics for All Barrier Types ...100
Table 33 Results of Crash Frequency Model (SPF) for All Barrier Types ...102
Table 34 Results of the RP Ordered Logit Crash Severity Model ...108
DISCLAIMER
This document was prepared and written by the author for partial fulfillment of the requirements set forth by Iowa State University (ISU) for the degree of Doctorate of
Philosophy. Funding for portions of this research was provided by the Michigan Department of Transportation (MDOT). MDOT expressly disclaims any liability, of any kind, or for any reason, that might otherwise arise out of any use of this publication or the information or data provided in the publication. The views expressed in this dissertation are those of the author and do not reflect the views or policies of MDOT or ISU.
ACKNOWLEDGMENTS
First and foremost I would like to thank my major professor, Dr. Peter Savolainen, for his guidance throughout the course of this research and throughout my graduate studies in general. Without his support and encouragement, I would not have attained the successes I have thus far in my academic career. I would also like to thank the rest of my committee members, Dr. Alicia Carriquiry, Dr. Jing Dong, Dr. Anuj Sharma, and Dr. R. Christopher Williams for their guidance and insights. Additionally, I would like to acknowledge Dr. Timothy Gates and Dr. Tapan Datta for their support during the early stages of my graduate studies.
I would like to acknowledge the Michigan Department of Transportation for providing several datasets required for this research. I would also like to thank Jonathan Kay, Jacob Finkelman, Eric Malburg, and Emira Rista for their assistance in data acquisition, as well as Sterling Frazier and Miroslav Dimovski for their assistance in crash report
reviewing. Finally, I would like to thank my parents, brother, sister, girlfriend, friends and colleagues in both Michigan and Iowa for their support throughout the course of my graduate studies.
ABSTRACT
Median-crossover crashes present the highest risk of fatality and severe injury among collision types on freeways. These crashes can be caused by a variety of factors, including drowsiness, driver distraction, impaired driving, and loss of control. The primary
countermeasure to reduce the opportunity for such crashes is the installation of median barriers. The Michigan Department of Transportation (MDOT) began installing high- tension cable median barriers in 2008, and has installed approximately 317 miles of cable median barrier on state freeways as of January 2014. Given the capital costs required for this installation program, a comprehensive before-after evaluation was conducted in order to ascertain the efficacy of cable barrier systems installed to date, and to develop guidelines to identify candidate locations for subsequent installations.
Crash reports were reviewed to identify target median-related crashes and this manual review provided critical supplementary information not normally available from the standard fields on police crash report forms. Statistical analyses which accounted for regression-to-the-mean effects showed that fatal and incapacitating injury crashes were reduced by 33 percent after cable barrier installation. The analysis also showed the median cross-over crash rate was reduced by 86.8 percent and the rate of rollover crashes was reduced by 50.4
percent. In contrast, less severe crashes were found to increase by 155 percent after cable barrier installation. A detailed analysis of crashes involving a cable barrier strike found the barriers were 96.9 percent effective in preventing penetration through the barrier. Weather conditions, horizontal curvature, and offset of cable barrier from the roadway were also
found to play a role in the frequency and severity of crashes, as well as cable barrier performance.
In addition to cable barrier segments, comparison roadway segments with thrie-beam guardrail and concrete median barriers were also analyzed as part of this research. Statistical models were developed to analyze factors affecting crash frequency, crash severity, and barrier strike outcomes among all three median barrier types. This study provides one of the first comprehensive analyses of thrie-beam median guardrail using observed highway-crash data, as most previous studies have focused on the more common w-beam guardrail.
CHAPTER 1 INTRODUCTION
1.1 Statement of Problem
Lane departure crashes result from vehicles veering from their intended travel lane and colliding with other vehicles in an adjacent lane, striking a roadside object after running off the road, or crossing the median and striking oncoming traffic in the opposite direction. From 2009 through 2013, a total of 46,589 lane departure crashes occurred on Michigan Interstates, resulting in 257 fatalities (1). Nationally, roadway departure crashes resulted in approximately 18,850 fatalities and 795,000 injuries in 2010. Such crashes accounted for 57 percent of all traffic fatalities and resulted in $73 billion in economic costs (2). Among the most hazardous roadway departure events are median-crossover crashes, which can be caused by a variety of factors including drowsiness, driver distraction, impaired driving, and loss of control on a horizontal curve or slippery road surface. The risk of collisions in such situations is particularly high on freeways where both traffic volumes and travel speeds are higher, elevating the risk of a collision and a resultant fatality. This is clearly illustrated by the fact that 555 head-on crashes occurred on Michigan Interstates during the same five-year period (2009 to 2013), resulting in 27 fatalities and 61 incapacitating injuries; rates that are significantly higher than other crash types (1).
According to the AASHTO Roadside Design Guide (RDG), the primary countermeasure to reduce the opportunity for median crossover crashes is the installation of median barriers (3). The Highway Safety Manual (HSM) provides estimates that the installation of median barriers results in average reductions of 43 percent for fatal crashes and 30 percent for injury crashes (4). However, the HSM also indicates that median barriers increase overall crash frequency by
approximately 24 percent, primarily due to higher numbers of property damage only (PDO) crashes because of the reduced recovery area for errant vehicles (4).
Given economic considerations, the decision to install a barrier system on a particular freeway segment requires careful examination of the expected frequency of median-crossover crashes in the absence of a barrier, as well as the expected frequency of barrier-related crashes if such a system were in place. The frequency of median-crossover crashes can be influenced by numerous factors, including traffic volumes and median widths, which are the two criteria upon which the RDG bases its recommended guidelines for barrier installation (3), as well as
geometric factors including horizontal alignment, vertical alignment, and median cross-slope. In addition to determining whether a barrier system is warranted, transportation agencies are also faced with the decision among various alternatives that include concrete barriers, thrie-beam guardrail, and high-tension cable barriers. Each of these alternatives has associated costs and benefits that must be carefully considered in selecting the most cost-effective treatment for a specific road segment. For example, the RDG suggests “As a rule, the initial cost of a system increases as rigidity and strength increase, but repair and maintenance costs usually decrease with increased strength” (3).
In recent years, high-tension cable barrier has become a preferred median barrier treatment on freeways due to advantages that include reduced installation costs, lesser impact forces on vehicles that strike the barrier, reduced sight distance issues, and greater aesthetic appeal (5). A 1997 survey conducted as a part of NCHRP Synthesis 244 (6) reported that cable barriers were in use in four states and, as of 2010, at least 37 states had installed some type of cable barrier (7). While cable median barrier use has increased significantly, cable barriers do present possible disadvantages such as an increase in less severe crashes and the need for frequent maintenance.
Michigan is one of several states that have recently begun installing cable barriers as a treatment at locations exhibiting a history of cross-median crashes. The Michigan Department of Transportation (MDOT) began installing cable median barriers in 2008 and has installed
approximately 317 miles of high-tension cable median barrier on state freeways as of January 2014.
Given the capital costs required for this initial cable barrier installation program, as well as the anticipated annual maintenance and repairs costs, it is imperative that a comprehensive evaluation be conducted in order to ascertain the efficacy of cable barriers in reducing the
occurrence of median-crossover events and crashes. An assessment of the safety performance of Michigan cable barrier systems will allow for a determination of cost-effectiveness on both a localized and system-wide basis, in addition to allowing for the identification of locations in which subsequent cable median barrier installations may be warranted. Furthermore, recent research using crash tests and models of vehicle dynamics has examined the conditions under which barrier penetration is most likely to occur (7). The results of an analysis of in-service cable barrier penetration events can add further insight into such circumstances using real-world data.
1.2 Research Objectives
While various studies have reported significant benefits associated with cable barrier installations (8-21), high-tension cable barrier is not necessarily an appropriate alternative for all settings as certain factors, such as narrow median width, may reduce the effectiveness under certain conditions. Additionally, experiences with cable barrier in southern states may not translate well to northern states which experience different weather characteristics and driving populations. As such, a careful analysis is required in order to determine the effectiveness of
high-tension cable barriers that have been installed on Michigan freeways, as well as the conditions under which these systems have been most effective. Given this overview, the following objectives were identified as a part of this study:
Determine the effectiveness of high-tension cable barriers in reducing median crossover crashes in Michigan.
Explore the effects of traffic volumes, median width, lateral offset, horizontal alignment, and other factors as part of a disaggregate-level analysis of median-involved crashes.
Perform an economic analysis to gain insight into the cost-effectiveness of cable median barriers.
Develop guidelines for installing high-tension cable barriers based upon the characteristics of specific roadway segments, as well as the performance
characteristics of various cable barrier design configurations investigated as a part of this study.
Investigate other under-researched areas of concern related to cable median barriers such as the safety effects on motorcyclists and the frequency and spacing of
emergency vehicle (EV) median crossovers.
Compare the relative safety performance among cable barrier, thrie-beam guardrail, and concrete barriers. Develop safety performance function incorporating all three barrier types.
Investigate factors associated with barrier penetration or vehicle re-direction back onto the roadway in cases where a vehicle strikes a barrier.
1.3 Organization of Dissertation
This dissertation consists of six chapters. The first chapter describes the problem being investigated, provides a brief introduction of cable median barrier and presents the research objectives. The second chapter summarizes previous research related to cable median barriers as well as other median barrier types, and presents the results of a survey of emergency responders. The third chapter presents details of data collection methodologies and summaries of several types of data required for this study including crash data, roadway geometry and traffic data, and environmental data. The fourth chapter presents the results of the before and after crash analysis of cable median barriers including summaries of injury and crash type outcomes before and after cable barrier installation, development of safety performance functions, an Empirical Bayes before and after analysis, an economic analysis, and development of cable barrier guidelines based on the crash analysis. Chapter five presents a crash analysis of alternative median barrier treatments (concrete barrier and thrie-beam guardrail) and a comparison of these treatments with cable barrier. Additionally, statistical models are developed to investigate factors which may affect injury severity outcomes and barrier strike outcomes among all three median barrier types. Chapter six presents an overall summary of this research, conclusions, limitations, and directions for future research.
CHAPTER 2 LITERATURE REVIEW
Modern cable barrier systems have been used as a treatment for median crossover crashes on high-speed roadways since the 1960s (19). However, installation of cable median barriers has increased rapidly throughout the United States in recent years. National estimates show that the quantity of cable barrier installation increased from 1,048 miles in May 2006 to 2,283 miles in January 2008 (22). More recent estimates report that over 2,900 miles of cable median barrier was installed as of 2009, with numerous additional installations planned at that time (20). Given their widespread application, guidance as to the cost-effectiveness and optimal deployment of cable barrier is an important concern of transportation agencies.
A principal advantage of cable barriers, in comparison to alternative treatments, is the fact that installation costs are generally much lower than other treatments. Recently, the
Washington State Department of Transportation compared costs on a per-foot basis among three types of barrier treatments, with 4-strand high-tension cable median barriers averaging $46.00 per foot with minor grading, followed by W-beam guardrail at $53.00 per foot with minor grading, and concrete median barriers at $187.00 per foot with minor grading (16). Further cost savings can be realized due to the fact that cable barriers can generally be installed on steeper slopes (up to 4:1 in comparison to 10:1 for other barrier types) that would require re-grading and the construction of drainage structures for other barrier treatments (7).
2.1 Safety Performance of Cable Median Barriers
In addition to lower installation costs, cable barriers have also proven effective in reducing the frequency of cross-median crashes, as well as related injuries and fatalities. A
summary of evaluations of in-service cable barriers from various states was prepared in 2009, which reported reductions of between 43 percent and 100 percent in the number of fatal median crossover crashes (21) after barrier installation. Table 1 provides a summary of these
evaluations. It should be noted that many of these evaluations are based on very limited data and the percent reductions may not take into consideration changes in traffic volumes or other
relevant characteristics. Nonetheless, these data suggest that cable barriers are very effective in reducing fatal cross-median crashes, as well as cross-median crashes in general.
Table 1. Summary of Cross-Median Crash Reductions in Several States After Cable Median Barrier Installation (20)
State Average Annual Before (number) Average Annual After (number) Reduction (%) Fatal Cross-Median Crashes
AL 47.5 27.0 43 AZ 1.7 0.7 59 MO 24.0 2.0 92 NC 2.1 0.0 100 OH 9.4 0.0 100 OK 2.0 0.2 91.5 OR 0.6 0.0 100 TX 30.0 1.0 97 UT 5.9 0.0 100 Cross-Median Crashes FL N/A N/A 70 NC 25.4 1.0 96 OH 348.3 83.0 76 UT 114.0 55.0 52 WA 16.0 3.8 76
An in-service study conducted after the installation of 189 miles of cable barrier in Missouri showed fatal cross-median crashes were reduced by 92 percent (12). Similarly, an evaluation of installations in South Carolina found cable barriers reduced crossover fatalities
from 35 per year in the period immediately prior to cable barrier installation to 2.7 per year in the period afterward (8). More recently, an evaluation of 293 miles of cable median barrier in
Washington found fatal collision rates were reduced by half and an estimated 53 fatal collisions were prevented after the installation of cable median barrier (16). Additionally, a recent
evaluation of 101 miles of cable barrier in Florida found a 42.2 percent decrease in fatal median crash rates after cable installation (17) and an evaluation of 14.4 miles of cable barrier in
Tennessee found fatal crashes were reduced by 80 percent after installation (18).
It is important to note that if only cross-median crashes are considered, the potential increases in property damage only (PDO) and minor injury crashes associated with cable median barrier strikes are not captured. Such increases are expected because errant vehicles will have less distance to recover if a run-off-the-road event occurs after a cable median barrier has been installed, thereby increasing the likelihood of a barrier strike. A North Carolina study found fatal and severe injury crashes were reduced 13 percent after cable barrier installation, but PDO and moderate/minor injury crashes increased by 150 percent and 68 percent, respectively (7). Similarly, a Washington study found decreases in fatal and serious injury median crashes after cable barrier installation, but an increase of 180 percent in total median collisions (16). In general, the benefit realized by the reduction in severe crashes tends to outweigh the costs of this increase in PDO crashes. However, if these increases in PDO and minor injury crashes are not accounted for, the safety effects and potential economic benefits of cable median barrier installation may be overstated.
Much of the safety benefit attributable to cable barriers is due to the fact that such systems have proven to be effective at preventing vehicles from penetrating the barrier during a crash (8; 23). A series of previous evaluations as of 2009 have shown that cable barriers were between 88.9 percent and 100 percent effective at preventing penetration during crashes (21).
Table 2 shows a summary of these previous evaluations. It should be noted that the effectiveness reported in Table 2 refers to the percent of cable barrier strikes in which a vehicle did not
penetrate the barrier and enter opposing traffic lanes (i.e. the barrier prevented a cross-median crash).
Table 2. Summary of Cable Barrier Effectiveness in Preventing Penetration (20)
State Collisions (number) Penetrations (number) Effectiveness (%)
AR 1,829 152 91.7 IA 20 0 100 NC 71 5 93 NY 99 4 96 OH 372 4 98 OK 400 1 99.8 OR 53 2 94.3 RI 20 0 100 SC 3,000 15 99.5 UT 18 2 88.9 WA 774 41 94.7
In a recent evaluation of cable median barrier failures using data from nine states, Stolle and Sicking (23) found an overall failure rate of 14.6 percent in cable barrier median crashes for passenger vehicles, either by vehicle penetration through the cable or rollover. It should be noted that these crash evaluations and barrier penetration evaluations included a wide range of installation locations; however, the effects of other factors such as traffic volumes and roadway geometry were not always controlled for.
2.2 Cable Median Barrier Installation Guidelines
Given their potential safety benefits, high-tension cable barriers are clearly a viable solution at locations prone to cross-median events. However, effective capital investment
requires an informed approach in selecting candidate locations for cable barriers. Guidance on median barrier installation is generally dictated by traffic volumes and median width. As shown in Figure 1, AASHTO (3) recommends median barriers on roads with median widths less than 30 feet and an annual average daily traffic (AADT) volume greater than 20,000 vehicles while median barriers are optional on roads with an AADT volume below 20,000 vehicles or with medians wider than 50 feet.
Figure 1. AASHTO Median Barrier Guidelines (3)
Various states have been more progressive when installing barriers as past research has shown that barriers may be warranted in a wider range of median configurations (24). For example, a study of 631 median-crossover crashes in Wisconsin showed that 81.5 percent of these crashes occurred at ADT and median width combinations where a median barrier was not warranted (25).
In addition to ADT and median width, several states like Texas, California, Connecticut, Kentucky, and Washington also use crash history to identify freeway sections for median barrier
placement (3; 19; 21; 26). Figure 2 shows median barrier guidelines developed for Texas based on an economic analysis of median-crossover and median-related crashes (26). It should be noted that these guidelines were developed for general median barrier installation on relatively flat, traversable medians, and were not developed specifically for cable median barrier.
Figure 2. Guideline for Installing Median Barriers on Texas Interstates and Freeways (26)
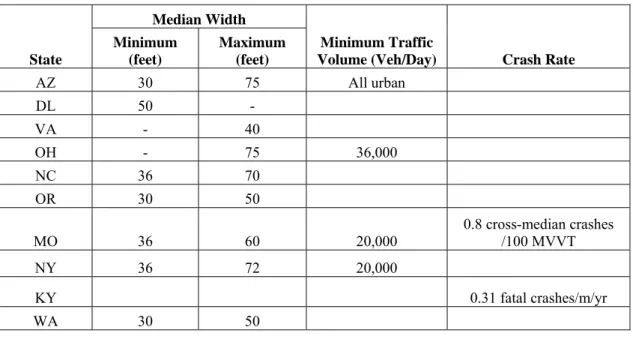
With respect to cable median barrier specifically, some states such as South Carolina and North Carolina have installed cable barriers on all medians with widths of less than 60 feet and 70 feet, respectively (8; 9). Several other states were found to have minimum median widths as high as 50 feet and maximum median widths as low as 50 feet specifically for cable median barrier installation (21). Table 3 shows a summary of several states’ cable median barrier installation guidelines with respect to median width, traffic volumes, and crash rates as of 2009. Given the substantial variability in policies among states, there is a need to develop guidelines suitable to the conditions present in the State of Michigan.
Table 3. Summary of Several States’ Cable Median Barrier Installation Guidelines (20)
State
Median Width
Minimum Traffic
Volume (Veh/Day) Crash Rate Minimum (feet) Maximum (feet) AZ 30 75 All urban DL 50 - VA - 40 OH - 75 36,000 NC 36 70 OR 30 50 MO 36 60 20,000 0.8 cross-median crashes /100 MVVT NY 36 72 20,000 KY 0.31 fatal crashes/m/yr WA 30 50
Besides these examples of general installation guidelines, there are widely varying state guidelines for minimum lateral offsets and maximum slopes on which cable median barriers can be installed. This include minimum offsets from the edge of the travel way ranging from 8 to 12 feet and maximum slopes ranging from 4:1 to 10:1 (20; 23). AASHTO (3) notes, “A cable barrier should be used only if adequate deflection distance exists to accommodate approximately 12 feet of movement; i.e., the median width should be at least 24 feet if the barrier is centered.” While placing the barrier directly in the center of the median would minimize impacts with vehicles (and potential property damage only crashes), maintenance becomes more difficult due to the accumulation of water at the bottom of the ditch. In such areas, poor soil conditions can also affect the performance of cable barrier foundations. Furthermore, median slopes may be prohibitively steep in the center of the median. Grading medians to a flatter grade to address these issues would result in significantly higher installation costs, which negates one of the main advantages of cable barriers over other median barrier treatments.
NCHRP Report 711: Guidance for the Selection, Use, and Maintenance of Cable Barrier Systems (7) examined tradeoff criteria between different cable barrier designs (e.g., cable
systems utilizing 3 cables and 4 cables, various post spacings, end anchor spacings, lateral offsets, different transition treatments, cable weaving, initial level of cable tension, etc.) under a variety of roadway conditions (e.g., median width, cross-slope, soil conditions, etc.). These guidelines were developed largely upon the basis of computer simulation modeling of vehicle dynamics. As such, their usefulness can be enhanced by integrating them with real-world experiences based on data collected from Michigan’s cable barrier installations.
2.3 Economic Analyses of Cable Median Barriers
The costs and benefits of any highway safety improvement must be carefully considered before a treatment is installed, and evaluated to analyze performance after installation. Cable median barriers are a particularly attractive treatment to reduce cross-median crashes on freeways due to their relatively low cost of installation compared with other barrier types. The economic benefit of cable median barriers is realized by the reduction in crash severity
associated with cross-median crashes. However, the potential increase in property damage only (PDO) or minor injury crashes must be considered as part of an economic analysis, as well as repair and maintenance costs incurred after cable barrier strikes. A summary of previous economic analyses from other states is presented below:
The most recent evaluation of cable median barriers in Washington (16) presented an analysis comparing cable median barrier with other barrier types (concrete median barrier and thrie-beam guardrail). While a full economic analysis of cable barrier installations
was not conducted, it was found that cable barriers could produce the most cost-effective reduction in fatalities as compared to the other barrier types.
An evaluation of freeway crash data in Texas (27) was used to develop benefit/cost (B/C) ratios for concrete barriers, as well as favorability ratios for installing high-tension cable barrier over concrete barrier. Although the analysis relied on several assumptions, it was found cable barriers were more cost-effective than concrete barriers for all roadways with medians 75 feet or greater regardless of AADT, and for narrower medians (25-70 feet) with lower ranges of AADT.
An economic analysis of cable median barrier performance in Wisconsin (28) found B/C ratios ranging from 3.62 to 12.98 depending on cable barrier type. It should be noted that this analysis was based on crash data from approximately 45 miles of cable barrier but the economic analysis was conducted under the assumption that cable barrier was installed on all interstate highways in Wisconsin (743 miles).
An older (2004) evaluation of 24 miles of cable median barrier in Washington (19) found that societal benefit of installing cable median barrier was $420,000 per mile per year. It should be noted that approximately half of the 24 miles of cable barrier only had less than 2 years of crash data available (1.54 years for one installation and 1.75 for the other).
Overall, the installation of cable median barrier has generally proven to be economically beneficial by reducing crash severity. However, there has not been a comprehensive economic analysis of a state’s complete cable barrier program involving a detailed before and after crash
review. The installation of several hundred miles of cable barrier in Michigan starting in 2008 presents an opportunity to conduct a full economic analysis using observed before and after crash data.
2.4 Feedback from Emergency Responders
One concern with the installation of cable median barriers is the ability to provide access to emergency vehicles and first responders who need to turn around and travel in the opposite direction on a freeway in order to respond to an incident or emergency. This can be
accomplished by providing crossover locations at regular intervals to allow access for emergency vehicles. Additionally, first responders must be familiar with procedures for safely removing vehicles entangled in the cables after a cable barrier strike. In order to gain feedback on these issues, a survey of emergency personnel and first responders was conducted regarding concerns related to the installation of high-tension cable median barriers in Michigan.
The survey was conducted via mail, fax, and internet (using www.surveymonkey.com) and a total of 53 responses were received. A sample of the survey that was distributed is shown in Figure 3. The majority of the responses were received from fire departments (43 responses) while there were 9 responses from police agencies and 1 response from an emergency medical technician. The summary of responses to each question can be found in Table 4.
For those respondents who indicated that cable median barriers introduced difficulty in responding to an incident, they were asked what the primary issues of concern were from among the following list:
Inability to locate a median cross-over or too much spacing between cross-overs
Difficulty removing the vehicle from the median as a result of the cable barrier
Difficulty providing medical attention to victims due to the cable barrier
Other
Figure 3. Emergency Responder Survey
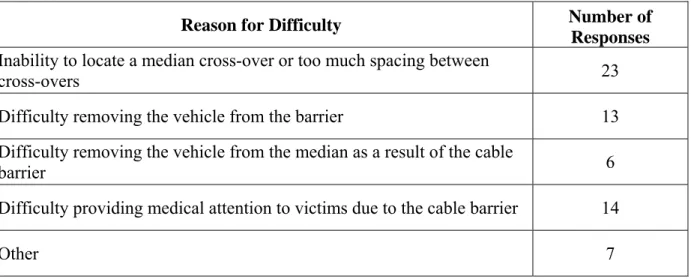
A total of 30 respondents (56.6 percent) indicated that cable barriers had
introduced issues when responding to an incident on a roadway where cable barriers were installed. Table 5 summarizes the most common issues. It should be noted that
respondents were instructed to mark all reasons that applied, so the total responses in Table 5 are greater than the number of respondents.
Table 4. High-Tension Cable Barrier Survey Results (N = 53)
Survey Question Number Percent Responding Agency
Police 9 17.0%
Fire 43 81.1%
EMS 1 1.9%
Do you feel cable barriers improve safety on Michigan freeways? Strongly Agree 12 22.6% Agree 15 28.3% Uncertain 20 37.7% Disagree 3 5.7% Strongly Disagree 3 5.7%
Have you responded to an incident that occurred on a freeway where cable barrier was installed?
Yes 32 60.4%
No 20 37.7%
No Response 1 1.9%
Have you responded to an incident that required cutting high-tension cable median barrier?
Yes 8 15.1%
No 45 84.9%
Does your agency have any guidelines or training that specifically relates to cable median barriers?
Yes 32 60.4%
No 20 37.7%
No Response 1 1.9%
Have cable median barriers added difficulty in responding to an incident on a roadway on which cable barriers were
Yes 30 56.6%
No 23 43.4%
In your opinion, what is the maximum distance that should be provided between median cross-overs on roads with cable b i ? <1 Mile 3 5.7% 1 Mile 30 56.6% 2 Miles 8 15.1% 3 Miles 5 9.4% No Response 7 13.2% TOTAL RESPONDENTS 53 100%
From the respondents who marked ‘Other’, additional issues that were cited included:
Cable barrier too close to the traffic lane which necessitates shutting down lanes of traffic to clear accident scene.
Difficulty loosening the cable when a vehicle is entangled in it.
Table 5. Reasons for Difficulty in Responding to Crashes on Roadways with Cable Barrier
Reason for Difficulty Number of
Responses Inability to locate a median cross-over or too much spacing between
cross-overs 23
Difficulty removing the vehicle from the barrier 13
Difficulty removing the vehicle from the median as a result of the cable
barrier 6
Difficulty providing medical attention to victims due to the cable barrier 14
Other 7
The respondents were asked to provide any other comments related to the use of cable median barriers. The most common remarks provided by the respondents included:
Cable barriers are located too close to the roadway.
The median cross-overs are spaced too far apart.
Several respondents indicated they would like their agencies to receive advanced training on responding to cable barrier crashes.
In summary, most emergency responders feel that installation of cable median barriers add some level of difficulty in responding to an incident, though most do agree that cable barriers improve overall safety on Michigan roadways. The main issues identified by emergency responders are:
Increased response time due to large distances between crossovers.
Difficulty removing vehicles from the barrier in the event of a crash.
Necessity to close lanes due to cable barrier’s close proximity to the edge of the roadway.
Approximately 40 percent of respondents indicated their agency does not have any guideline or training that specifically relates to cable median barriers. MDOT requires that the cable barrier manufacturer provide training to MDOT staff and local emergency first responders (EFRs) as part of every cable barrier installation. However the results of the survey indicate that some responders may not have received training. Providing additional training opportunities or increasing the publicity of such training may aid in mitigating some of the issues that were noted by survey respondents.
2.5 Comparison with Other Median Barrier Types
Before and after in-service performance evaluations of median barrier types other than cable barrier are not as commonly found in the research literature. Several studies have
examined the effects of roadway median characteristics in general (including median barriers) on median and/or cross median crashes (29-31). Median barriers are generally found to reduce cross median crashes, and other roadway characteristics such as median and shoulder widths, median cross slope, and horizontal curvature are found to affect median or cross median crash characteristics.
Studies analyzing factors affecting injury severity between median barrier types are quite limited. A recent study (32) analyzed factors affecting crash severity in single-vehicle, run off the road crashes (left or right side) occurring on roadway segments with cable barriers, w-beam guardrails, and concrete barrier walls in Indiana. Binary logistic regression with mixed effects
was utilized for the analysis and several person, roadway, and barrier type characteristics were found to affect injury severity outcomes. Among other findings, collisions with cable barriers were found to be least likely to result in injuries compared to collisions with fixed objects or other barrier types. Factors affecting crash frequency on roadways with each of the barrier types and factors associated with penetration through the barriers were not analyzed as a part of the study. Another study analyzed injury outcomes for motorcyclists in collisions with different barrier types and found that the odds of injury were greater in collisions with w-beam guardrail than with concrete barrier, but there was no significant difference in injury outcomes between w-beam guardrail and cable barrier (33).
Research has been somewhat limited on the performance of different barrier types with respect to crash outcomes in the event of a median barrier collision (e.g. vehicle containment, vehicle penetration through the barrier, or re-direction of the vehicle back onto the roadway). One recent study (34) analyzed median barrier strike crashes in Florida to compare the safety performance of G4 (1S) w-beam guardrail and cable median barriers. Odds ratios were computed and it was found that w-beam guardrails were more effective in preventing penetrations in the event of a collision, but cable barriers tended to result in fewer severe injury crashes.
2.6 Literature Review Summary and Areas of Research Need
The preliminary literature review shows that high-tension cable barrier use continues to increase rapidly throughout the United States, although there is substantial variability in its use among states in terms of installation guidelines and warrants. Previous evaluations of cable median barrier installations from other states have shown substantial reductions in fatal cross-median crashes (20), although these evaluations were not all comprehensive and some were
based on small lengths of cable median barrier installation. Additionally, some of these studies may suffer from potential selectivity bias or regression-to-the-mean effects, which can lead to over-stated safety benefits based on a before-after observational analysis. To investigate this issue, an Empirical Bayes analysis will be conducted to evaluate Michigan’s cable median barrier program while accounting for these potential biases.
Previous evaluations have also shown cable median barriers to be between 88.9 and 100 percent effective in preventing penetration in the event of a cable barrier strike (20), although some of these studies were based on very small sample sizes. The performance of cable median barrier performance in Michigan in terms of percent of crashes resulting in penetrations will be analyzed as a part of this study and compared with other states. Additionally, the performance of median thrie-beam guardrail and concrete median barrier in Michigan will be analyzed and compared with the performance of cable median barrier.
In addition to the overall safety effects of installing cable median barriers and the performance of the cable barriers themselves, there are several issues which warrant additional investigation. There has been limited research as to the effects of adverse weather conditions on the efficacy of cable barriers, which may be particularly important in northern climates. Past research has found that median related crashes and crashes with median barriers are more prevalent during adverse weather and road conditions (14; 28; 29), but severe crashes and cable barrier penetrations are less likely to occur under such conditions (23; 28). It’s important to investigate this issue in Michigan as it may have significant impacts on the decision to install a cable median barrier or the placement characteristics of the barrier in geographic regions which experience a significant amount of snowfall.
Impacts of cable median barriers on motorcyclists are a potential concern that is also in need of additional research. A few studies have investigated this issue (16; 33) and both
concluded there were no significant increases in probability of serious injuries for motorcyclists after installation of cable median barriers. Although some motorcycle advocacy groups and members of the public have expressed concern about this issue, the data have not supported these concerns thus far. Effects on motorcyclists are analyzed as a part of this study and the results will add to the literature with respect to this issue. It is important to note that Michigan repealed its Universal Helmet Law in 2012, so the results of this study may add some insight into the effects of this change in legislation.
Another issue with cable median barriers is their effect on access for emergency vehicles or maintenance vehicles which need to turn around on the freeway. As cable barriers are
continuous, sections must be designed such that gaps are available for median crossing by these groups at regular intervals (24). This can be done either by terminating guardrail sections at specific lengths or providing staggered barrier sections on each direction of roadway (e.g., a westbound section continues at a point where an eastbound section terminates). The frequency and spacing of emergency turnarounds within cable median sections are important characteristics to consider because although they provide emergency vehicles necessary access, these locations also may be susceptible to cross-median crashes at the cable median openings, as well as crashes caused by drivers illegally using the crossovers. This issue will be investigated as part of this study in terms of emergency vehicle crossover-related crashes, as the surveys of emergency responders have shown that crossover spacing is a major concern with cable median barrier installation.
In summary, past research indicates that high-tension cable median barriers generally are an effective countermeasure to reduce cross-median crashes, and generally improve safety. However, some of these studies suffer from potential selectivity bias, which can lead to inaccurate results when regression-to-the-mean effects are not accounted for. This study will
account for this effect through the use of a before-after Empirical Bayes analysis. Additionally, the effects of several under-researched variables on the safety performance of cable median barriers will be investigated such as cable barrier type (3-cable system vs. 4-cable system) lateral offset, horizontal curvature, weather and road condition characteristics, and several other
variables of interest.
Collectively, the results of this study will add to the literature by providing additional guidance on the potential effects of cable median barriers and conditions where they may be most effective. Other under-researched areas of interest will also be investigated, such as effects on motorcyclists and the potential impacts of emergency crossover frequency and spacing. Additionally, insights will be gained on the performance of other median barrier types, particularly thrie-beam guardrail, which has not been extensively studied in the literature.
CHAPTER 3
DATA COLLECTION AND DESCRIPTION
3.1 Cable Median Barrier Installation Data
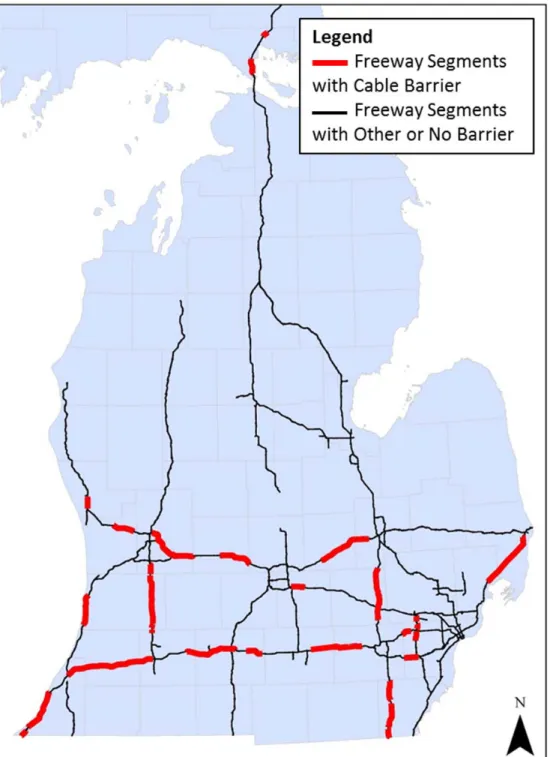
Segments of roadway in which cable median barrier have been installed (as of January 2014) were identified using MDOT physical reference (PR) numbers and beginning and ending mile points. The PR beginning mile point (BMP) and PR ending mile point (EMP) for each cable barrier installation were initially obtained from construction proposals and plans obtained from MDOT’s bid letting website. The BMP and EMP of each cable barrier installation were then confirmed (or adjusted as necessary) based on satellite images from Google Earth (35) as well as the Google Street View tool. There were four cable barrier installations which were too recently constructed to be captured by Google Earth, and as such, field visits were conducted to confirm the BMP, EMP, and other installation characteristics of these installations. The cable median barriers were first installed on controlled-access freeways in Michigan in 2008, and subsequent installations continued in subsequent years. As of January 2014, there was a total of approximately 317 miles of cable median barrier installed in Michigan, all of which were
analyzed as a part of this study. Figure 4 shows a map with all cable median barrier installations as of January 2014. The freeway segments in which cable median barrier was installed were chosen by MDOT from locations with a median narrower than 100 feet and historical cross-median crash occurrence.
As stated previously, the exact locations of the cable barrier installations were obtained from MDOT and confirmed using Google Earth imagery and/or field visits. MDOT also
date for each cable barrier installation. Additionally, the engineering and construction costs for most of the installations were obtained from MDOT’s bid letting website. Cost data were not available for 9 of the installations, so costs were estimated for these installations based on an average per-mile cost obtained from the installations in which cost data were available. All cable barrier installations in Michigan were high-tension systems and were either CASS, Gibraltar, or Brifen cable barrier systems. It should be noted that MDOT installed 3-cable versions of the CASS and Gibraltar systems and 4-cable version of the Brifen system.
All high-tension cable systems installed by MDOT met the requirements of National Cooperative Highway Research Program Report 350, Test Level 4 (NCHRP 350, TL-4) when the barrier was placed on a 1V:6H (1 vertical:6 horizontal) slope or flatter. Furthermore, high tension cable systems installed by MDOT on slopes steeper than 1V:6H, up to 1V:4H, met the requirements of NCHRP 350, TL-3. For all high tension cable systems, MDOT specified a maximum post spacing of 10.5 feet, except in areas where conflicting utilities or underground obstructions required a larger post spacing, and so long as the post spacing utilized did not exceed manufacturer’s recommendations. Table 6 shows a summary of each cable barrier installation including route, MDOT Region, install year, installation length, and total cost. It should be noted that there are a total of 7 MDOT Regions consisting of counties clustered together by geographic location, and Figure 5 shows a map of these regions. In addition to installation cost data, repair data for years 2010-2012 were provided by MDOT in the form of crash reports with the cost of cable barrier repair listed on each crash report. This repair cost data was utilized in the economic analysis of cable median barriers, with details presented in Chapter 6.
Other cable barrier characteristics for each installation were obtained from Google Earth and/or site visits. This included the side of roadway in which the cable barrier was located
nearest to and the lateral distance from the edge of the nearest travel lane in each direction to the cable barrier. Most of the installations had cable barrier installed near the edge on one direction of travel, while some had cable barrier installed on both sides of the median, and one had cable barrier installed approximately in the center of the median. The PR and mile points where the cable barrier switched from one side of the median to the other or where an installation switched from a single run of barrier along the median to dual runs of barrier along the median (i.e., two runs of barrier, with one on each side of the median, running parallel along the median) were recorded for use in the separating segments in later analyses. Figure 6 shows an example screen shot from Google Earth which was used to identify cable barrier location and lateral distance from edge of left travel lanes. The distance measured using Google Earth’s ruler tool was found to be accurate within 1 foot when compared with known measurements of lane width.
3.2 Roadway Geometry and Traffic Volume Data 3.2.1 Cable barrier roadway and traffic volume data
In order to analyze the safety performance of cable median barrier installations, several characteristics needed to be obtained for each cable barrier roadway segment, including data related to traffic crashes (which will be discussed in detail in the following section of this report), roadway geometry, traffic volumes, and characteristics of the actual cable barrier installation. The total length for each cable barrier installation was divided into segments based primarily on the MDOT sufficiency file, which divides roadways into segments based on their characteristics. Horizontal curves were also segmented such that each curve was an individual segment. An attempt was also made to divide the segments where the cable barrier switched from one side of the road to the other; however, this was not always possible as some installations alternated sides of the median within short distances. The minimum segment length used for this study was 0.25
miles, as it was determined the location indicated on crash reports may not be accurate enough to apply to segments less than this length.
Table 6. Summary of Cable Median Barrier Installations Install Number Route MDOT Region Install Year Cable System Number of Cables Installation Length (miles) Total Cost (Engineering and Construction)
1 I-94 Southwest 2008 CASS 3 3.8 $433,875
2 I-94 Metro 2008 CASS 3 6.2 $889,444
3 I-69 Bay 2008 Gibraltar 3 5.8 $568,907
4 I-94 Metro 2009 CASS 3 6.2 $1,064,375
5 I-94 Metro 2009 CASS 3 6.1 $898,122
6 I-94 Southwest 2009 CASS 3 28.3 $2,948,450
7 I-96 Grand 2009 Gibraltar 3 13.5 $2,245,053
8 US-131 Grand 2009 Gibraltar 3 4.1 $969,043
9 I-69 University 2009 Gibraltar 3 17.6 $2,583,941
10 US-23 University 2009 Brifen 4 14.1 $2,191,775
11 I-275 Metro 2009 CASS 3 7.4 $1,395,992
12 I-96 Grand 2010 Gibraltar 3 9.0 $2,910,988
13 I-96 Grand 2010 Gibraltar 3 19.2 $2,565,989
14 I-196 Southwest 2010 Brifen 4 6.9 $1,009,483
15 I-94 Metro 2010 Gibraltar 3 3.6 $523,543
16 I-94 Southwest 2010 Gibraltar 3 17.6 $3,374,999
17 I-75 Superior 2010 CASS 3 8.7 $1,563,721
18 I-94 Southwest 2010 Gibraltar 3 20.9 $2,734,397
19 I-94 Southwest 2010 Gibraltar 3 6.0 $615,565
20 US-131 Southwest 2010 Gibraltar 3 24.7 $3,391,285
21 I-94 Metro 2010 Gibraltar 3 3.3 $440,135
22 US-31 Grand 2010 Gibraltar 3 4.5 $806,166
23 I-94 Southwest 2010 Gibraltar 3 2.6 $433,515
24 I-94 Southwest 2011 Brifen 4 7.5 $972,220
25 I-94 University 2011 Gibraltar 3 7.6 $1,210,969
26 I-196 Southwest 2011 Gibraltar 3 6.5 $783,805
27 I-96 University 2012 Gibraltar 3 2.6 $977,672
28 US-23 University 2012 Gibraltar 3 22.6 $3,714,723
29 I-94 University 2012 Gibraltar 3 12.1 $2,128,058
30 M-14 Metro 2012 Gibraltar 3 4.0 $674,453
31 I-94 Metro 2013 Gibraltar 3 6.1 $967,618
32 US-23 University 2013 Brifen 4 8.1 $1,375,791
Figure 5. Map Showing MDOT Regions (Source: MDOT)
The sufficiency file is updated annually and freeway segments contain separate records for each direction of freeway (i.e. there will be one sufficiency file record for Northbound (NB) or Westbound (WB) and one for Southbound (SB) or Eastbound (EB) for each freeway
segment). The relevant variables extracted from the sufficiency file for each cable barrier roadway segment include:
Median type and median width
Shoulder type and shoulder width
Number of lanes and lane width
Annual Average Daily Traffic (AADT) for each year on each segment from 2004-2013.
Figure 6. Screen Shot from Google Earth Showing Cable Median Barrier (35) In cases where the sufficiency file segment start and end points changed slightly from year to year, a length-weighted average was used to compute the AADT for each cable barrier roadway segment. Horizontal curves and curve radii were identified and measured using GIS shapefiles. Table 7 shows a summary of the cable barrier roadway segments including average segment length, median width, horizontal curve presence, lateral offset distance, and AADT before and after cable barrier installation. It should be noted that that the segment information in Table 7 is for one-directional segments, as found in the MDOT sufficiency file
Table 7. Summary of Cable Barrier Roadway Segments
Characteristic 3-Cable
Segments
4-Cable Segments
All Cable Barrier Segments
Total Centerline Mileage 280 37 317
Directional Segment Length (mi) Mean 1.2 1.1 1.2 St.Dev. 1.0 0.8 1.0 Min 0.25 0.25 0.25 Max 6.3 3.3 6.3 Median Width of Segments (feet) Mean 62.8 64.1 63.0 St.Dev. 13.4 10.9 13.1 Min 26.0 36.0 26.0 Max 94.0 70.0 94.0
Left Shoulder Width of Segments (feet) Mean 8.2 7.9 8.1 St.Dev. 0.9 0.5 0.7 Min 5 6 5 Max 12 8 12 Number of Horizontal Curve Segments No Curve* 437 (95.2%) 69 (100%) 506 (95.8%) Radius 2,500-3,500 ft 15 (3.3%) 0 (0.0%) 15 (2.8%) Radius<2,500ft 7 (1.5%) 0 (0.0%) 7 (1.3%) Number of Directional Travel Lanes (number of segments) 2 Lanes 386 (84.1%) 69 (100%) 455 (86.2%) 3 Lanes 65 (14.2%) 0 (0.0%) 65 (12.3%) 4+ Lanes 8 (1.7%) 0 (0.0%) 8 (1.5%)
Speed Limit (number of segments) 55 mph 0 (0.0%) 0 (0.0%) 0 (0.0%) 65 mph 0 (0.0%) 0 (0.0%) 0 (0.0%) 70 mph 459 (100%) 69 (100%) 528 (100%) Lane Widths (number of segments) 11 feet 4 (0.9%) 0 (0.0%) 4 (0.8%) 12 feet 455 (99.1%) 69 (100%) 524 (99.2%) Lateral Distance From Near Side Cable Barrier to Edge of Nearest Travel Lane (feet)
Mean 13.5 15.0 13.7
St.Dev. 2.5 3.4 2.7
Min 7.4 12.1 7.4
Max 24.2 23.0 24.2
Annual Average Daily Traffic per segment (one-directional)
Mean
Before After Before After Before After 22,369 22,364 15,291 15,395 21,382 21,632
St.Dev. 13,204 15,071 2,975 3,083 12,526 14,451
Min 1,508 1,749 8,944 9,124 1,508 1,749
Max 99,850 100,600 22,941 21,437 99,850 100,600
Average Annual Snowfall (in) 62.0 43.7 47.0 34.2 59.9 42.7 *’No curve’ includes curved segments with radii greater than 3,500 ft.
Historical snowfall data were also obtained for each cable barrier segment. This data was downloaded from the National Oceanic and Atmospheric Administration’s (NOAA) National Climactic Data Center (36). Annual snowfall amounts in inches were obtained for every weather station in Michigan, Ohio, and Canada which were within 45 miles from the midpoint of a cable barrier road segment. Annual average snowfall amounts were then calculated for each cable barrier road segment (for each year from 2004 to 2013) based on data from the weather station(s) within 45 miles of the midpoint of the segment. The average annual snowfall in inches for cable barrier segments before and after cable barrier installation can be found in Table 7.
3.2.2 Comparison segment roadway and traffic volume data
In order to compare the performance of cable median barrier with other median barrier treatments, freeway segments with the following median characteristics were identified to serve as comparison segments for this study:
Segments with no median barrier and median widths less than 100 feet
Segments with thrie-beam median guardrail
Segments with concrete median barrier
The comparison segments were identified using the MDOT sufficiency file along with Google Earth and Google Maps street view imagery. The PR, BMP, and EMP of each segment were identified manually and the total lengths were divided into segments for analysis using the MDOT sufficiency file in a similar manner as the cable barrier sections described previously. After a review of Michigan’s entire controlled-access freeway system, there were a total of 337 miles of segments with no median barrier and median width less than 100 feet, 104 miles of segments with thrie-beam median guardrail, and 226 miles of segments with concrete median
barrier, all of which were analyzed as part of this study. Table 8 shows a summary of the no barrier, thrie-beam guardrail, and concrete barrier roadway segments.
Table 8. Summary of Comparison Roadway Segments
Characteristic No Barrier Segments Thrie-Beam Guardrail Segments Concrete Barrier Segments
Total Centerline Mileage 337 104 226
Directional Segment Length (mi) Mean 1.2 1.0 0.8 St.Dev. 1.0 0.7 0.7 Min 0.25 0.25 0.25 Max 67.2 3.4 6.3 Median Width of Segments (feet) Mean 77.3 42.3 24.6 St.Dev. 16.2 14.3 9.3 Min 26 12 6 Max 94 70 70
Left Shoulder Width of Segments (feet) Mean 8.3 8.9 8.6 St.Dev. 0.9 1.4 2.6 Min 8 3 1 Max 12 11 17 Number of Horizontal Curve Segments No Curve* 515 (91.5%) 196 (92.9%) 458 (79.0%) Radius 2,500-3,500 ft 29 (5.2%) 11 (5.2%) 66 (11.4%) Radius<2500 ft 19 (3.4%) 4 (1.9%) 56 (9.7%) Number of Directional Travel Lanes (number of segments) 2 Lanes 464 (82.4%) 59 (30.0%) 85 (14.7%) 3 Lanes 99 (12.3%) 143 (67.8%) 339 (58.4%) 4+ Lanes 8 (1.5%) 9 (4.2%) 156 (26.9%)
Speed Limit (number of segments) 55 mph 5 (0.9%) 2 (0.9%) 111 (19.1%) 65 mph 0 (0.0%) 0 (0.0%) 11 (1.9%) 70 mph 558 (99.1%) 209 (99.1%) 458 (79.0%) Lane Widths (number of segments) 11 feet 2 (0.4%) 0 (0.0%) 1 (0.2%) 12 feet 561 (99.6%) 211 (100%) 579 (99.8%) Annual Average Daily Traffic per Segment (one-directional) Mean 16,927 34,188 45,766 St.Dev. 10,004 15,750 18,225 Min 2,464 2,706 2,706 Max 57,450 99,200 97,150
Average Annual Snowfall (in) 44.7 37.0 38.1
The geometric, traffic, crash, and snowfall data were obtained for each comparison segment in the same manner as the cable barrier segments described previously. However, five years (2009-2013) of data were examined for the comparison segment analysis (there are no ‘before and after’ periods for the comparison segments as there are for the cable barrier
segments). Table 8 present several summary statistics for the comparison segments including average segment length, median width, horizontal curve presence, AADT, and average annual snowfall. Similar to table 7, the segment information in Table 8 is for one-directional segments, as found in the MDOT sufficiency file.
3.3 Traffic Crash Data 3.3.1 Cable barrier segment crash data
All crashes occurring on each cable barrier segment were obtained for years 2004 through 2013 from MDOT. The crashes were assigned to each cable barrier segment based on the PR and mile point which was coded for each crash. Since the primary purpose of this study is to analyze the safety effectiveness of cable median barriers, target crashes (which were defined as crashes that could be affected by the installation of cable median barriers) needed to be
identified. These target crashes include both median-crossover crashes and all median-related crashes. There was no reliable way to identify target crashes based on the electronically coded crash data alone, therefore a manual review of every crash occurring on the cable barrier segments was conducted. Crash reviewers were trained and instructed to code each crash into one of the following eight target crash categories:
Median or Median Crossover Crashes:
1 – Median Crash - vehicle left roadway and entered median, but did not strike any barrier or cross into opposing lanes of traffic. This includes vehicles which enter the median and re-enter the roadway onto original lanes of travel.
2 – Cross-Median Event – vehicle left roadway and entered median, travelled all the way across the median and entered into opposing traffic lanes, but did not strike an opposing vehicle.
3 – Cross-Median Crash – vehicle left roadway and entered median, travelled all the way across the median and entered into opposing traffic lanes and struck an opposing vehicle.
Cable Median Barrier Strike Crashes:
4 – Cable Barrier Strike – vehicle struck cable barrier, did not penetrate the barrier, and was contained in the median.
5 – Cable Barrier Strike – vehicle struck cable barrier, penetrated all the way through the cable barrier (including vehicles that flipped over the cable barrier), but did not enter opposing travel lanes.
6 – Cable Barrier Strike – vehicle struck cable barrier, penetrated all the way through the cable barrier (including vehicles that flipped over the cable barrier), and entered opposing traffic lanes, but did not strike opposing vehicle.