Abstract—A new scanner design for a high-speed atomic force microscope (AFM) is presented and discussed in terms of modeling and control. The lowest resonance frequency of this scanner is above 22 kHz. The X and Y scan ranges are 13 micrometers and the Z range is 4.3 micrometers. The focus of this contribution is on the vertical positioning direction of the scanner, being the crucial axis of motion with the highest bandwidth and precision requirements for gentle imaging with the atomic force microscope. A mathematical model of the scanner dynamics is presented that will enable more accurate topography measurements with the high-speed AFM system.
I. INTRODUCTION
HE atomic force microscope (AFM) [1],[2] is a very powerful tool to image [3] and manipulate [4] at the scale of only a few nanometers. The principle of this instrument is to scan a sample in close vicinity of a very sharp tip that is supported by a micromechanical cantilever. During this scanning process the tip probes the sample surface either in permanent contact (contact mode) [3] or by being oscillated at the cantilever’s resonance frequency (tapping mode) [5]. To get quantitative information about the sample topography the tip sample interaction force is held constant by closed-loop operation. A feedback controller varies the position of the sample (or the cantilever) in the vertical (Z) direction such that the cantilever deflection (in contact mode) or oscillation amplitude (in tapping mode) is held constant. The output of the feedback controller thus represents directly the topography information (cf. e.g. [6]). For this purpose the positioning system has to be characterized and calibrated in
Manuscript received September 15, 2005. This work supported by the NSF through the UCSB Materials Research Laboratory under Award DMR00-80034, by the NIH under Award GM65354, by the NASA University Research, Engineering and Technology Institute on Bio-inspired Materials under Award No. NCC-1-02037, by a research agreement with Veeco #SB030071, by the FWF under Project No. J2395-N02, by the SNF under Project No. PA002—108933 and PBEZ--105116, and a DOC-Fellowship of the OeAW.
Georg Schitter is with the Physics Department, University of California, Santa Barbara, CA-93106, USA (phone: 805-893-3999; fax: 805-893-8315; e-mail: [email protected]).
Karl J. Åström, Barry DeMartini and Kimberly Turner are with the Department of Mechanical Engineering University of California, Santa Barbara, CA-93106, USA (e-mail: [email protected], [email protected], [email protected]).
Georg E. Fantner, Philipp J. Thurner, and Paul K. Hansma are with the Physics Department, University of California, Santa Barbara, CA-93106, USA ([email protected], [email protected], [email protected]).
the Z-direction carefully.
The scanning motion as well as the movement in Z direction is performed by the so called scanner [7], which is typically a piezo-based system in order to achieve sub-nanometer precision in all three spatial directions.
One crucial issue in AFM development is the very slow imaging speed. For imaging of soft biological samples and in order to get reliable quantitative information about the sample topography the tip-sample interaction force has to be kept at a minimum and constant, i.e. with minimum variations in the cantilever deflection or amplitude signal. This puts high requirements on the feedback and actuation system, in particular motion in the Z-direction.
In the past years some efforts have been made to speed up the AFM by introduction of additional fast actuators to the vertical direction [8],[9], scaling down the scanner [10], making it more rigid [11], and by utilizing modern control methods [6],[12]-[18]. Model based controllers have been implemented to speed up the scanning motion [12]-[16] and to improve the performance of the AFM system in the Z direction [6],[17],[18]. Improvements also have been reported by utilizing control based methods to advance the accuracy of the recorded data when transforming the feedback signal into topography information [6],[17],[19].
This article presents a new design (Section II) and a simple mathematical model (Section III) of our high-speed scanner, which enables imaging speeds that are more than two orders of magnitude faster than commercial systems [20]. The derived mathematical model is verified by experimental data (Section IV). The accurate characterization is an important prerequisite for gentle quantitative imaging of biological processes on the molecular level in real-time. In order to get a better representation of the sample topography, the derived mathematical model can then be easily integrated in an improved version of the software that records the AFM image data.
II. SCANNERDESIGN A. Scanner Design
The mechanical design of the high-speed scanner is based on stack piezos and flexures according to Figure 1. The key in this design is to make the scanner compact and rigid, i.e. to make the mechanical paths as short as possible, in order to achieve high first resonance frequencies in all positioning directions.
Design and Modeling of a High-Speed Scanner for
Atomic Force Microscopy
Georg Schitter, Karl J. Åström, Barry DeMartini, Georg E. Fantner, Kimberly Turner, Philipp J. Thurner, and Paul K. Hansma
T
Proceedings of the 2006 American Control Conference
For actuation in the scanning directions (X and Y) this scanner is built in the push-pull principle, i.e. for each scanning motion one (or more) pair of piezos is integrated in the scanner to form a balanced structure (see Fig. 1, X and X). This has three main advantages: i) The actuation is mechanically balanced, i.e. the recoil into the supporting structure is minimized, ii) two piezos provide a higher force for actuation, and iii) the scanner is thermally balanced for minimal drift and even allows for implementation of a strain gauge full-bridge circuit that is also thermally balanced. This strain gauge bridge circuit can be used for closed-loop control of the scanning motion.
In order to decouple the different axes of motion the Z actuator is mounted on a center piece that is moved by the scanning piezos. For the decoupling of the X and Y motion this center piece is connected to the scanning piezos via the comb-like flexures according to Fig. 1. These flexures are rigid along the axis of motion of the corresponding piezos and in Z direction, and are weak in the perpendicular scanning direction. The flexure frame between the comb-flexures and the scanning piezos (deformed black square that is connected to the support material in Fig. 1) increases the stiffness of the supporting structure of the Z piezo and suppresses the trampoline motion that would occur, if the Z piezo was only held by the scanning piezos. Simultaneously this flexure frame confines the movement of the scanning piezos to their respective direction of actuation and suppresses any torsion or out of plane motion.
The actual design of the scanner has been optimized using finite element analysis (FEA) tools (ANSYS, Canonsburg, PA). The predicted first resonance frequencies in the scanning directions are at 27 kHz and in the Z direction at 33 kHz. The positioning range of this scanner is 13 micrometers in the X and Y directions and 4.3 micrometers in the Z direction.
B. Scanner Implementation
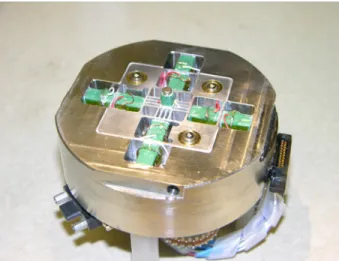
The scanner has been built using aluminum as the center piece and flexure material and a steel base housing for rigid support of the piezo stack actuators. A photograph of the fully assembled scanner is given in Fig. 2.
The scanning motion is performed by two pairs of piezos in each scanning direction. The two flexure frames that hold the scanning piezos (see Fig. 2) increase the stiffness of the system in the Z direction. We want to note that by adding additional pairs of piezos in the X and Y directions, the scan range could be extended further. The push-pull structure in the X-direction is comprised of four piezo stack actuators with a nominal unloaded positioning range of 9 micrometers (AE0505D08, Tokin-NEC, Sendai City, Japan). The same assembly is implemented for actuation in the Y-direction. This symmetric design allows for full image rotation during imaging with the AFM. A piezo stack actuator with an unloaded nominal range of 4.3 micrometers (AE0203D04, Tokin-NEC, Sendai City, Japan) is glued on the center piece to perform the actuation in the Z-direction.
The piezo stacks are driven by custom made amplifiers (Techproject, Vienna, Austria) that have been designed for the specific capacitive load in order to achieve a high-positioning bandwidth. The driving voltage of the piezos is between 0V and 150V. A 75V offset is applied to all piezos to drive them symmetrically around this start position. The scanning signals are generated by a custom made data acquisition system [21] that also records the AFM images.
Fig. 1. Scheme of the high-speed scanner. The comb-like flexures in the center decouple the scanning directions X and Y. The inner frame confines the movement of the scanning piezos in the Z direction and provides a rigid support of the Z piezo in order to achieve a high resonance frequency and suppress trampoline motion of the scanner.
Fig. 2. Photograph of the high-speed scanner. The center piece with the comb-flexures and the two frames to stiffen the system in Z direction can clearly be seen.
III. MODELING OF THE SCANNER
In this section a simplified mathematical model of the scanner is derived that explains some dynamics of the system along the vertical positioning axis.
The device is a complicated mechanical system with many oscillatory modes. We start by developing a simple mathematical model that captures only one mode. The scanner system is modeled as two masses supported by a spring with damping. A schematic diagram is shown in Fig. 3.
Let m1 and m2 be the masses, k the effective spring
constant, and c the damping coefficient. Furthermore, let the positions of the center of the masses be x1 and x2. The
elongation of the piezo stack is "=x1 - x2. Let the reaction
force created by elongation of the piezo stack be F. A momentum balance gives the following model for the system. F kx dt dx c dt x d m F dt x d m 2 2 2 2 2 2 2 1 2 1
Taking the Laplace transform gives
), ( ) ( ) ( ) ( 1 ) ( ) ( 1 ) ( 2 1 2 2 2 2 1 1 s X s X s L s F k cs s m s X s F s m s X and we get
( ). ) ( ) ( 1 1 ) ( ) ( ) ( 2 2 2 1 2 2 1 2 2 2 1 2 1 s F k cs s m s m k cs s m m s L s F k cs s m s m s X s X s L ¸¸ ¹ · ¨¨ © §When operating the Z-piezo we are interested in the transfer function from the elongation " to the top of the piezo stack m1. We have
. 2 2 ) ( , ) ( 2 0 0 2 2 0 0 2 2 2 1 2 2 1 1 Z ]Z Z ]Z D s s s s s G k cs s m m k cs s m s G x x " " (1)This transfer function is characterized by three parameters:
x The resonance frequency Z0 k/(m1m2) of the total mass oscillating against the spring.
x The relative damping
) ( 2 km1 m2 c ] .
x The parameter D= m2 / (m1+m2) which is
determined by the ratio of the masses.
The parameters can be determined from a step response. The parameter D can be obtained from the initial and final values of the step, and the frequency and relative damping from the oscillation period and decay. Examples of step responses for different parameters are shown in Fig. 4.
More accurate modeling can be obtained from the frequency response. The Bode plots of the transfer function are shown in Fig. 5.
Fig. 3. Model of the high-speed scanner in the vertical direction.
Fig. 4. Step responses for the model (1) with ] = 0.02 and D = 0.7 (solid blue), 0.8 (dashed red) and 0.9 (dotted blue) (upper curves). The lower curves show the step responses when a time constant of the power amplifier of WA= 0.07/ Ȧ0 has been added.
We have , 2 1 1 ) ( 0 1 i i Gx ] D Z "
where for small ]the peak of the frequency response occurs approximately at Ȧ0 and we have
. 4 1 1 ) ( 2 2 0 1 ] D Z i Gx"For small ] the dip in the frequency response occurs approximately at D Z0 / and we have . 1 2 2 1 2 ) ( 0 1 D D ] D D ] D ] D Z | i i i Gx"
For D= 0.9 and ] = 0.02 the expressions give a peak of 2.69 and a dip of 0.38, and the dip occurs at Z0/ D |1.05.
IV. EXPERIMENTALDATA
The model derived in Section III is verified by experimental data presented in this section.
Step responses of the scanner in the Z-direction are measured. A piece of a silicon wafer is glued on top of the piezo as a standard specimen. The Z-position of the sample is sensed by the AFM cantilever operated in contact mode without scanning. For this experiment the photo diode signal displaying the cantilever deflection represents the system
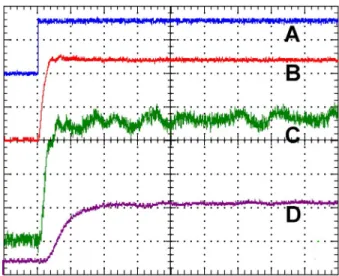
output. The input of the power amplifier for the Z piezo is regarded as the system input. The input steps are generated by a function generator (HP 3311A, Palo Alto, CA). Fig. 6 shows a measured step response at an input step height of 80mV (blue signal) that is amplified by the power amplifier to 1.2V (red signal). This voltage is applied to the piezo and represents a nominal step height of 34 nm. The cantilever deflection is measured by the optical lever setup of the AFM using a custom made high-bandwidth deflection electronics (green signal) and the electronics of the commercial AFM (purple signal), respectively. The measured step response (green signal) is in good agreement with the simulation in Fig. 4.
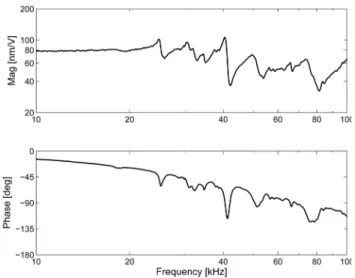
Amplitude versus frequency data of the amplifier and scanner system in the vertical direction are recorded with a network analyzer (4395A, Agilent, Palo Alto, CA). The input to the system is again the input of the power amplifier. The system output is the vibration of the top of the sample on the Z piezo measured by a scanning laser vibrometer (OFV-3001, Polytec, Waldbronn, Germany). The sinusoidal frequency sweep with constant excitation amplitude is also generated by the network analyzer. Using the vibrometer we recorded velocity data of the piezo top during the frequency sweep. The velocity data are converted into position data by dividing gain by frequency and subtracting 90° from the phase, according to an integration of a sinusoidal signal. The nominal time-delay of the vibrometer of 1.9 microseconds is also removed from the phase data. Fig. 7 shows a typical bode plot that has been recorded. The most dominant frequency peak occurs at about 40 kHz and is in good agreement with the simulation shown in Fig. 5.
Fig. 5. Bode plot of the model (1) with ] = 0.02 and D = 0.7 (solid blue), 0.8 (dashed red) and 0.9 (dotted blue).
Fig. 6. Measured step response of the high-speed AFM system in Z-direction. System input: input of the power amplifier; system output: AFM deflection signal. (A) Input step signal (blue, 50mV/div), (B) output of the power amplifier (red, 500mV/div), (C) high-bandwidth cantilever deflection (green, 200mV/div), (D) low-bandwidth cantilever deflection (purple, 2V/div); time scale: 25 μs/div.
V. RESULTSAND DISCUSSION
The experimental data shown in Section IV are in good agreement with the mathematical model of the scanner derived in Section III.
From Fig. 6 the rise time of the voltage at the amplifier
output (red signal, B) is determined to be about 10 microseconds. The time of the upward ramp in the
cantilever deflection signal is about the same for the high-bandwidth deflection electronics (green signal, C) and about 25 microseconds for the electronics of the commercial system (purple signal, D). The extended length of the rise time in the case of the electronics of the commercial system is due to the low pass characteristics of the dividing amplifier that normalizes the cantilever deflection signal to the sum of the detected laser signal. The measured step response, however, is in good agreement with the modeling and simulation shown in Fig. 4. The small and fast oscillations (Fig. 6, green signal) that are superimposed on the modeled oscillations are presumably due to the resonance of the Z piezo itself.
The amplitude spectrum in Fig. 7 shows the resonance peak at about 40 kHz and the dip (anti-resonance) as modeled and shown in Fig. 5. The spectrum also shows a resonance peak at about 120 kHz (data not shown), which is the resonance frequency of the piezo as mentioned above. The additional delay when comparing the phase vs. frequency plot of Figs. 5 and 7 is due to the low pass characteristics of the power amplifier. This will also be considered in the future implementation of a model-based controller [17] for the high-speed scanner. The mathematical model derived in this article helps to investigate the dynamics stemming from the scanner structure for a better understanding of the system dynamics in terms of design guidelines and potential for additional improvement. The multiple resonance and anti-resonance pairs between 22 and
35 kHz are attributed to the flexures for the X and Y movement, which is in agreement with the frequency range of the scanner resonances in the X and Y directions obtained from the FEA simulations. These peaks, however, are not the most dominant ones in the frequency response of the scanner in the Z direction. At about 40 kHz the amplitude spectrum clearly shows the resonance peak of the system. The dip in the spectrum occurs at about 42 kHz.
By comparing the measured step response in Fig. 6 to the simulated one in Fig. 4 the ratio of the masses is determined to be about
D
0.9. m1 represents half of the Z-piezo plusthe sample mass and is 10 percent of the total mass for
D
0.9. This means that for the Z-direction the effective mass of the supporting structure is about four times the mass of the Z-piezo.From equation (1) it is seen that the transfer function is Gx1l(s)=1 if D is 1. From Figs. 4 and 5 it is seen that the
larger D is, the smaller are the oscillations due to the Z-piezo support. Although using a heavier material or building the supporting structure in Z-direction thicker might compromise the scanning motion by increasing the moved mass, but it would also increase the mass ratio and therefore reduce the influence of its dynamics. On the other hand, since this behavior is known in advance, it can be compensated for by utilizing modern model-based control methods (cf. [17]). This would keep the system fast in the scanning direction and lead to a better performance of the AFM system in the vertical direction. Additionally, such a model-based controller also has the potential for direct implementation of the improved transformation of the control action into the topography signal.
In order to demonstrate the performance of the new high-speed AFM system, a silicon calibration grating with 44 nm deep etched squares at a pitch of 3 micrometers has been imaged at 1030 lines per second, i.e. at 4 frames per second (see Fig. 8). For generating the scanning signals and recording the images, a high-speed DAQ-system [21] has been used. Feedback operation for tracking the cantilever
Fig. 7. Bode plot measured with a scanning laser vibrometer. The resonance – anti-resonance pair around 40 kHz can clearly be seen in the amplitude and in the phase trace.
Fig. 8. Silicon calibration grating, showing 44 nm deep etched squares with a pitch of 3 micrometers. Images are recorded at a scan rate of 1030 lines per second and a resolution of 256x256 pixels. (A) feedback signal, representing the topography; (B) deflection image, representing the control error.
deflection is done with an analogue proportional-integral feedback controller. Images are recorded in contact mode, where the topography image (represented by the feedback signal) and the deflection image (representing the control error) are displayed.
VI. CONCLUSION
In this paper we present the design and a simplified mathematical model of a high-speed scanner for an atomic force microscope. The model obtained from first principles gives a good basis for implementing a model-based controller for better control performance and an observer for more accurate conversion of the control action into the topography signal [6][17][19]. Experimental step responses and frequency spectra verify the mathematical model and enable to obtain quantitative values of some unknown parameters of the mathematical model.
Performance results demonstrating the high-speed imaging capability of the new AFM system are shown.
ACKNOWLEDGMENT
The authors would like to thank Dr. Johannes Kindt for fruitful discussions.
REFERENCES
[1] G. Binnig, C.F. Quate, and C. Gerber, “Atomic force microscope”, Physical Review Letters 56(9), p. 930-3 (1986)
[2] D. Sarid, “Scanning Force Microscopy”, New York: Oxford University Press, 1994
[3] P.K. Hansma, V.B. Elings, O. Marti, C.E. Bracker, “Scanning tunneling microscopy and atomic force microscopy: application to biology and technology”, Science 242(4876), p.209-16 (1988) [4] A.L. Weisenhorn, J.E. Mac Dougall, S.A.C. Gould, S.D. Cox, W.S.
Wise, J. Massie, P. Maivald, V.B. Elings, G.D. Stucky, P.K. Hansma, “Imaging and manipulating molecules on a zeolite surface with an atomic force microscope”, Science 247(4948), p.1330-3 (1990) [5] Q. Zhong, D. Inniss, K. Kjoller, V.B. Elings, “Fractured
polymer/silica fiber surface studied by tapping mode atomic force micrsocpoy”, Surface Science Letters 290, p.L688-92 (1993)
[6] G. Schitter, P. Menold, H.F. Knapp, F. Allgower, A. Stemmer, “High performance feedback for fast scanning atomic force microscopes“, Review of Scientific Instruments 72(8), p.3320-7 (2001)
[7] G. Binnig, D.P.E. Smith, “Single-tube three dimensional scanner for scanning tunneling microscopy”, Review of Scientific Instruments 57(8), p.1688-9 (1986)
[8] H.J. Mamin, H. Birk, P. Wimmer, D. Rugar, “High speed scanning tunneling microscopy: principles and applications”, Journal of Applied Physics 75(1), p.161-8 (1994)
[9] S.R. Manalis, S.C. Minne, C.F. Quate, “Atomic force microscopy for high speed imaging using cantilevers with an integrated actuator and sensor”, Applied Physics Letters 68(6), p.871-3 (1996)
[10] T. Ando, N. Kodera, E. Takai, D. Maruyama, K. Saito, A. Toda, “A high-speed atomic force microscope for studying biological macromolecules”, Proceedings of the National Academy of Sciences USA98(22), p.12468-72 (2001)
[11] J.H. Kindt, G.E. Fantner, J.A. Cutroni, P.K. Hansma, „Rigid design of fast scanning probe microscopes using finite element analysis“, Ultramicroscopy 100(3-4), p.259-65 (2004)
[12] D. Croft, G. Shed, S. Devasia, “Creep, hysteresis, and vibration compensation for piezoactuators: atomic force microscopy applications, ASME Journal of Dynamic Systems, Measurement, and Control 123, p.35-43 (2001)
[13] Q. Zou, K.K. Leang, E. Sadoun, M.J. Reed, S. Devasia, “Control issues in high-speed AFM for biological applications: collagen imaging example, Asian Journal of Control 6(2), p.164-78
[14] G. Schitter, A. Stemmer, “Identification and open-loop tracking control of a piezoelectric tube scanner for high-speed scanning probe microscopy”, IEEE Transactions on Control Systems Technology
12(3), p.449-54 (2004)
[15] A. Daniela, S. Salapaka, M.V. Salapaka, M. Dahleh, “Piezoelectric scanners for atomic force microscopes: design of lateral sensors, identification and control”, Proc. of the 1999 American Control Conference, San Diego, CA, p.253-7 (1999)
[16] S. Salapaka, A. Sebastian, J.P. Cleveland, M.V. Salapaka, “high bandwidth nano-positioner: a robust control approach” Review of Scientific Instruments 73(9), p.3232-41 (2002)
[17] G. Schitter, A. Stemmer, F. Allgower, “Robust two-degree-of-freedom control of an atomic force microscope”, Asian Journal of Control 6(2), p.156-63 (2004)
[18] K. El Rifai, O.M. El Rifai, K. Youcef-Toumi, “On Dual Actuation in Atomic Force Microscopes”, Proc. of the 2004 American Control Conference, Boston, MA, p. (2004)
[19] S. Salapaka, T. De, A. Sebastian, “Sample-profile estimate for fast atomic force micrsocopy”, Applied Physics Letters 87, p.053112 (2005)
[20] G. Schitter, G.E. Fantner, J.H. Kindt, P.J. Thurner, P.K. Hansma, “On recent developments for high speed atomic force microscopy”, Proc. of the Conference on Advanced Intelligent Mechatronics 2005, Monerey, CA, p.261-4 (2005)
[21] G.E. Fantner, P. Hegarty, J.H. Kindt, G. Schitter, G.A.G Citade, P.K. Hansma, “Data acquisition system for high-speed atomic force microscopy”, Review of Scientific Instruments 76, p.026118 (2005)
![Fig. 4. Step responses for the model (1) with ] = 0.02 and D = 0.7 (solid blue), 0.8 (dashed red) and 0.9 (dotted blue) (upper curves)](https://thumb-us.123doks.com/thumbv2/123dok_us/9750027.2857059/3.918.158.370.289.466/step-responses-model-solid-dashed-dotted-upper-curves.webp)