1
Time-of-flight secondary ion mass spectrometry study of lithium intercalation process in LiCoO2 thin film
C. Dellen1,2*, H.-G. Gehrke1,2, S. Möller1, C.-L. Tsai1,2, U. Breuer3, S. Uhlenbruck1,2, O. Guillon1,2, M. Finsterbusch1,2, M. Bram1,2
1
Forschungszentrum Jülich GmbH, Institute of Energy and Climate Research (IEK), 52425 Jülich, Germany
2
Jülich Aachen Research Alliance: JARA-Energy 3
Forschungszentrum Jülich GmbH, Central Institute for Engineering, Electronics and Analytics - Analytics, 52425 Jülich, Germany
*Corresponding author: C. Dellen, E-Mail: c.dellen@fz-juelich.de, Phone: +49 2461 61 96762, Fax: +49 2461 61 2455, Address: Forschungszentrum Jülich GmbH, Institute of Energy and Climate Research, Wilhelm-Johnen-Str., 52425 Jülich, Germany
2
Abstract
A detailed Time of Flight – Secondary Ion Mass Spectrometry (ToF-SIMS) analysis of the lithium de-/intercalation in thin films of the insertion cathode material lithium cobalt oxide is presented. The LiCoO2 (LCO) thin films are deposited by radiofrequency magnetron sputtering at 600°C, having a (003) preferred orientation after deposition. The thin electrode films are cycled with liquid electrolyte against lithium metal, showing 80-86% extractable capacity. After disassembling the cells, the depth resolved elemental distribution in the LCO is investigated by ToF-SIMS and Glow Discharge Optical Emission Spectroscopy (GDOES). Both techniques show a stepwise lithium distribution in charged state, leading to a lithium depleted layer close to the surface. In combination with the electrochemical results, the qualitative comparison of the different lithium depth profiles yields a reversible lithium extraction in the depleted area below the stability limit for bulk materials of LCO. For bulk LCO a phase change normally occurs when the lithium concentration in LixCoO2 is lower than x=0.5. As a possible cause for the inhibition of the phase change, the preferred orientation and thus pinning of the crystal structure of the film by the substrate is proposed.
Keywords:
ToF-SIMS, GDOES, Radio frequency magnetron sputtering, LiCoO2, Thin film cathode
3
Introduction
To optimize the material properties and processing conditions of functional battery layers, knowledge about the lateral and vertical distribution of lithium is crucial. By analyzing the lithium depth distribution of electrode or electrolyte layers, one can, for example, investigate the impact of different processing parameters on the elemental composition of battery components [1, 2] or visualize the interdiffusion of lithium between active layers and inactive components of batteries [3, 4]. An even more fundamental field of application is the analysis of cycled battery cells in different states of charge, to get a deeper understanding of the Li transport and the de-/intercalation process inside the functional layers of the battery [5, 6]. Currently, inductively coupled plasma spectroscopy or spectrometry techniques (OES, ICP-MS) are typically used for the compositional analysis of bulk batteries or powders for battery production. However, when applied to thin film batteries with typical layer thicknesses of ~1 µm, these techniques are not feasible, especially if spatial and depth resolved elemental profiles are of interest, since it can only yield elemental concentrations averaged over all functional layers. Conventional thin film analytical techniques using X-rays for the analysis, like X-ray Photoelectron Spectroscopy (XPS) or in a wider sense energy/wavelength dispersive X-ray spectroscopy (E/WDX), are also not capable to detect lithium with a sufficient sensitivity. Driven by these difficulties in detection and quantification of lithium, an innovative combined approach is introduced, where Time of Flight – Secondary Ion Mass Spectrometry (ToF-SIMS) and Glow Discharge Optical Emission Spectroscopy (GDOES) are used to characterize the depth profile of Li distribution in LiCoO2 (LCO) thin films prepared by unbalanced radio frequency magnetron sputtering. The capability of ToF-SIMS to detect the spatial lithium distribution with high sensitivity makes this technique an
4
ideal candidate for the investigation of thin functional layers in batteries [4-8]. As a reference, GDOES is used as independent comparative analytical techniques for the lithium depth profile analysis, and to evaluate potential measurement artefacts of the ToF-SIMS analysis (e.g. SIMS matrix effects [9]). In addition, Nuclear Reaction Analysis (NRA) is used as a reference method, which is able to quantify lithium concentration in thin films.
For the presented investigation, LCO is chosen as a model system for layered intercalation cathodes because it has a high relevance for commercial applications and is a well-studied electrode material [10-13]. While the total theoretical capacity for complete delithiation of LixCoO2 where x=0 is 138 µAh cm-2 µm-1 or 275 mAh g-1, the useful capacity in conventional bulk LCO batteries is only half the value, because the reversible lithium extraction is limited to LixCoO2 where x = 0.5. In the case of LCO bulk materials, a delithiation of x < 0.5 is reported to cause a rapid capacity fading, due to a phase change in the material which is connected to a large variation in the c lattice parameter [11, 14, 15]. In contrast, for LCO thin films, a reversible cycling below the limit of Li0.5CoO2 was already reported in literature [16, 17].
Experimental
Thin film deposition process
The investigated thin film half-cells consist of a CrN current collector which has a thickness of around 300 nm and a submicron LCO cathode layer. The substrates for the thin film deposition process were quartz glass sheets with an area of 25 x 25 mm2 and a thickness of 1.25 mm. After cleaning in acetone and isopropanol, chromium nitride (CrN) current collector and LCO cathode layer were grown onto the glass substrate by physical vapor deposition (PVD) one after the other. Firstly, the
5
CrN was deposited by a reactive radio frequency sputter process using a CS 400 ES PVD cluster system (Von Ardenne GmbH). Prior to the deposition, the substrates were sputter etched and then transferred to the process chamber while the vacuum was maintained. The deposition was done at 500°C and a pressure of 6x10⁻³ mbar with a nitrogen flow of 50 sccm. For the subsequent deposition steps, samples were transferred to a CS 800 ES PVD cluster system (Von Ardenne GmbH). The surface of the CrN layer was again cleaned by sputter etching. After the etching process, samples were transferred to an electron beam (e-beam) evaporation chamber without breaking the vacuum. In the e-beam deposition process, an additional 10 nm chromium metal layer was deposited as adhesion layer. Afterwards, samples were transferred under vacuum to a sputtering chamber equipped with a commercial ceramic LCO target of 250 mm in diameter (Evochem Advanced Materials GmbH). The composition of the LCO target was determined by inductively coupled plasma – optical emission spectroscopy (ICP-OES) which gives the Li:Co ratio of 1.1:1.0. The successive deposition of the LCO was performed in a pure argon atmosphere at an Ar flow of 20 sccm and a processing pressure of 5x10⁻³ mbar. The sputter power was 500 W, which is equivalent to 1 W/cm2, and the substrate temperature was set to 600 °C during the one hour deposition. At first, the heating rate was 10 K/min up to a temperature of 550 °C and then switched to 5 K/min to avoid overshooting the targeted substrate temperature of 600 °C. After the sputtering, samples were cooled down with a controlled cooling rate of 5 K/min. The crystal structure of LCO thin films was analyzed by X-ray diffraction (XRD), using a Bruker D4 Endeavour X-ray diffractometer. The XRD analysis (not shown here) revealed, that as deposited LCO thin films were already in crystalline phase with a preferred (003) orientation. Therefore, no additional annealing step was needed prior to the electrochemical tests.
6 Electrochemical tests
The electrochemical activity of LCO thin films was tested by cyclic voltammetry (CV) experiments. For cell assembly, LCO thin films were transferred from the PVD system into a glove box with a protective Ar atmosphere without any contact to ambient atmosphere. As a standard liquid electrolyte, 1 M LiPF6 (Alfa Aesar) dissolved in ethylene carbonate (EC) (Sigma-Aldrich) and dimethyl carbonate (DMC) (Sigma-Aldrich) mixed in a 1:1 molar ratio was used. The electrolyte was pipetted onto two stacked round pieces of a commercially available glass fiber separator (Whatman) with a diameter of 12.7 mm limiting the active area of the LCO thin film. Metallic lithium foil (Alfa Aesar) was pressed on a nickel current collector disk and used as anode material. The cells were sealed under a protective Ar atmosphere in a pouch bag with an aluminum lead for cathode contact and a nickel lead for anode contact. CV measurements were performed outside the glove box by using a Biologic VMP-300 multipotentiostat (BioLogic Science Instruments). The scan rate was set to 0.04 mV s-1 and the cell was cycled between 3.0 V and 4.1 V vs. Li+/Li. The relatively slow scan speed was chosen to ensure the maximum utilization of the whole film during the cycling. The voltage range was chosen to cycle the thin films well within the reversible limits of LixCoO2 with 0.5 < x < 1 and to prevent a fast degradation of the material at a higher potential [14, 15, 18].
Analysis of elemental composition
ToF-SIMS analyses were performed by using a TOF-SIMS IV system (ION-TOF GmbH). The measurements were done with a dual beam setting [19] in non-interlaced mode. For the material erosion, a 2 keV Cs+ ion beam was rasterized over an area of 300 x 300 µm2. For the generation of analyzed secondary ions, a focused 25 keV Bi3+ ion beam was used and the Bi ion gun was operated in the high current
7
bunched mode. The analyzed area was 82 x 82 µm2 and centered within the sputter crater to avoid crater edge effects. Between the sputtering and analysis pulses, a low energy (20 eV) electron flood gun was used to compensate for sample charging during the sputter processes. The data analysis was carried out by using Software package SurfaceLab 6 (ION-TOF GmbH).
The depth calibration of the SIMS profiles was conducted by measuring each sputter crater depth by using a confocal scanning laser microscope VK-9700 (Keyence Corp.) and converting the sputter time into a depth scale.
For complementary depth profiling results on the lithium ion distribution, GDOES measurements were done using a Glow Discharge Analyzer (GDA) 750 HR (Spectruma Analytik GmbH). The GDA is equipped with a set of photomultipliers which cover the spectral range from 200 to 1200 nm. An additional charge-coupled device (CCD) optic, covering the spectral range between 200 and 800 nm, increases the number of parallel detectable elements. For the GDOES analysis of the LCO thin films, a radio frequency excitation source of the GDA 750 HR was used.
In order to get an insight into the quantitative elemental composition of LCO thin film, nuclear reaction analysis (NRA) was used. For the analysis, a 2 MeV proton beam, generated from a tandetron accelerator, was used and the Li content was determined by the 7Li(p,α0)4He reaction [20]. The Co concentration was derived from simultaneously recorded Rutherford backscattering (RBS) signal. For the signal acquisition, a silicon surface barrier detector (20 keV FWHM energy resolution) was placed in a backscattering geometry under a scattering angle of 165°. The data processing during the measurement was performed by using Canberra software package (Canberra Industries, USA) and the measured spectra were afterwards evaluated using the Software SIMNRA [21]. The fitting for the lithium quantification
8
was calculated with the cross section data published by Dieumegard et al. [22]. The validity of the cross section data for the used scattering angle was proven by calibration measurements with a LiAlO2 single crystal.
Results and discussion
Electrochemical testsTo study the dynamic of the lithium distribution in discharged and charged LCO thin films, voltammetry profiles with different final cutoff voltages were applied to the layer systems. The scan rate for each measurement was set to 0.04 mV s-1 in a cycling range between 3.0 V and 4.1 V vs. Li+/Li. Samples, which are further on referred to as discharged samples, were discharged to 3.0 V in the last voltage scan. Samples referred to in the following as charged LCO thin films were charged up to a voltage of 4.1 V in the last scan. In both cases, the final voltages of the samples were hold for at least five hours to reach an equilibrated lithium ion distribution in the thin films. Figure 1a) shows a result from CV measurement. The cell was cycled through 20 full CV cycles and afterwards charged to 4.1 V vs. Li+/Li. For the first CV cycle, only a redox couple with a peak position at 3.96 V for the anodic scan and a peak position at 3.86 V for the cathodic scan was observed. The peak positions for the anodic scans gradually decreased from 3.96 V to 3.94 V and that for cathodic increased from 3.86 V to 3.88 V vs. Li+/Li. The decrease of the voltage difference between anodic and cathodic redox peaks indicates that the ohmic resistance of the used LCO thin film was decreased upon cycling. After the 5th cycle, the variation in the peak shapes and positions are negligible, indicating a reversible lithium de-/intercalation process without any major degradation effects over the whole cycling.
9
Figure 1: a) CV-Measurement of a LCO thin film and schematic sketch of the cell stacking. b) Corresponding charge, discharge capacity and cathode efficiency for the same thin film. Additional samples for the SIMS-analysis were prepared and measured in the “as deposited” condition (i) as well as after cycling to the indicated half cycles (ii -vii).
a)
10
The peak positions in the CV measurement correspond to the expected redox couple at around 3.9 V which is in good agreement to related literature for hexagonal phase LCO thin films [23] and bulk LCO [11, 14], i.e. high temperature LCO (HT-LCO) phase. Besides the described major redox peaks, a minor peak at 3.82 V became more pronounced upon cycling. Takeushi et al. observe a side peak at the same potential for epitaxial LCO thin films prepared by using a pulsed laser deposition [23] and connect it to an irreversible oxidation of the electrolyte solvents [24]. Another explanation by Yoon et al. is, that the peak at 3.82 V is an indication for a mixed phase between the high and low temperature phase of LiCoO2 [25]. Since the peak gradually grew during the CV cycling and was only observed on the anodic scan, the explanation from Takeushi et al. seems more likely to apply to our experiments.
The charge and discharge capacities in Fig. 1b) were derived from the CV measurement by using the EC-Lab software package (BioLogic Science Instruments). The charging capacity of the cell is 61 µAh cm-2µm-1 at the first charging cycle and decreases down to 51 µAh cm-2µm-1 after charging for 21 times. The elevated charging capacity during the first cycle is attributed to the oxidation of impurities in the electrolyte. The discharging cycle capacity slightly increases from 50 to 52 µAh cm-2µm-1 within the first two cycles and then starts to decrease down to 48 µAh cm-2µm-1. For a fully dense LCO thin film and a delithiation of x=0.5 Li-ion per LixCoO2, the theoretical capacity of the prepared sample is 69 µAh cm-2µm-1. Therefore, the tested cell reaches a relative discharge capacity of around 70-75 %. This indicates that neither the whole cathode film is utilized during the cycling nor the assumption of a fully dense film is not valid. The latter one is likely contributing at least partly, since the high substrate temperature during the deposition process could
11
lead to a microporosity [26] in the LCO thin films and hence cause the density to be lower than the theoretical one. The cathode efficiency derived by the ratio of discharge to charge capacity is increasing with the cycle number. After 20 cycles, the efficiency of the cell is 95% which indicates a good reversibility of the lithium ion de-/intercalation process of the LCO thin film. Because of the destructive measuring principle of SIMS, multiple samples were prepared and cycled to the respective number of half cycles which are indicated in Fig. 1b). The samples were cycled under the same conditions and the CV measurements (not shown) were nearly identical to the results as shown in Fig. 1a). Additionally, a sample in the “as deposited” state was also analyzed by SIMS. This sample is used as a reference for a pristine LCO without any contact to the electrolyte or separator.
ToF-SIMS and GDOES depth profiling in the discharged and charged states
After electrochemical cycles, the cells were transferred to a glove box and disassembled under protective argon atmosphere. The lithium anodes and separators were removed to leave the LCO thin films as the top layer. After disassembling, samples were dried under vacuum at room temperature. In order to prevent any possible contamination of the LCO surface or reaction to ambient atmosphere, the samples were afterwards sealed in pouch bags under an Ar protective atmosphere. The seal was broken right before loading the samples into the ToF-SIMS setup for the measurement.
12
Figure 2: ToF-SIMS depth profiles for an “as deposited” LCO thin film a), two discharged LCO thin films c),e) and three charged LCO thin films b),d),f).
a) b) c) d) e) f)
13
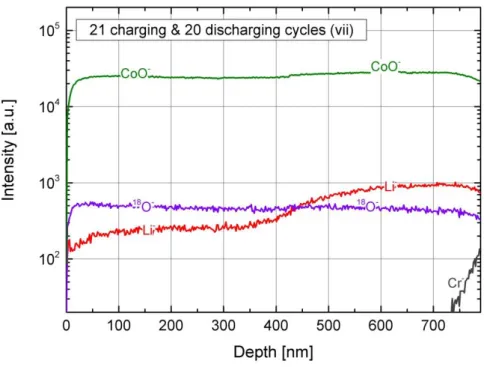
Figure 3: ToF-SIMS depth profile of a long term cycled LCO thin film after 20 cycles and charging to the charged state.
The SIMS depth profiles of the negative secondary ions for the different samples with the above described cycling histories are depicted in Fig. 2 and 3. The depth profiles cover the LCO thin films from their surfaces down to their interfaces between LCO and CrN current collectors which are indicated in the depth profiles by the rising Cr- signal. The elemental distribution of Li, O, and Co within the LCO layer is visualized by 7Li- (Li-), 18O- and 59Co16O- (CoO-) secondary ions. These ions were selected to achieve a good sensitivity while staying below the saturation limit of the detector. Therefore, 7Li- secondary ions are chosen for Li, because of significant higher natural abundance of 7Li in comparison to 6Li. In the case of oxygen, the 16O signal reaches detector saturation. Hence, the oxygen is represented by the secondary ions of the less abundant 18O isotope. The 59Co16O- molecular ions are chosen since they have a higher signal than the single 59Co- secondary ions, as can
14
be seen in the exemplary SIMS mass spectrum provided in the supplementary information, Fig. S1.
The depth calibration of the SIMS profiles were performed by measuring each SIMS crater using a confocal laser microscope with a depth resolution of 1 nm and converting the sputter time into a depth scale under the assumption of a constant sputter rate within the whole LCO thin film.
Figure 2a) shows the depth profile of the “as deposited” reference sample. Overall, a homogeneous elemental distribution of Li, Co, and O is detected in the LCO thin film. Furthermore, a higher intensity in the lithium signal at the surface is indicating a lithium rich surface layer for a thickness of around 100 nm. Upon charging the LCO thin film for the first time, the lithium distribution was significantly changed. As shown in Fig. 2b), the lithium signal exhibits a stepwise profile in the LCO thin film with a lower intensity for the first 400 nm. For the deeper part of the thin film, the lithium intensity rises back to same level as that in the “as deposited” reference. Figure 2c) shows the depth profile after a full CV cycle, ending up in the full lithiated state. The elemental distribution is homogeneous and again as that in the “as deposited” state. Another charging step leads once more to the formation of a stepwise lithium profile, Fig. 2d), in the LCO thin film. The interface between the two lithium plateaus is even more distinct than in Fig. 2b). From a depth of 300 nm to the interface with the CrN layer, the lithium intensity is as high as that in the discharged state. By further increasing the number of discharging and charging half cycles, one can see again the change from a homogeneous elemental distribution in the discharged state, Fig.2e), to a stepwise lithium profile in the 3 times charged sample, Fig. 2f). In the latter one, the interface between the two lithium plateaus is even more pronounced and around half of the film has a lower lithium intensity than the other
15
half. In Fig. 3, the SIMS depth profile for a sample which was cycled for 20 times and charged to the “charged LCO” is shown, corresponding to the results of point vii in Fig. 1b). The lithium distribution also exhibits a stepwise profile where approximately half of the film has a lower lithium intensity than the other half. In comparison to the charged samples in Fig. 2d) and 2f), the interface between the two lithium plateaus for the long-term cycled samples is less sharp.
Comparing all ToF-SIMS depth profiles, the difference in the thickness of the LCO thin films for the charged and discharged state is clearly visible. The charged thin films appear to be systematically thinner than that of the discharged thin films. The variation in the film thickness is evident in the different sputter times of the SIMS measurements as well as in the depth calibration performed for each SIMS profile using the confocal laser microscope. For the latter, the SIMS sputtering was stopped right at the interface between the LCO and the CrN current collector and the resulting crater was measured to determine the film thickness.
The samples were also measured in the positive secondary ion polarity while not changing any other parameter of the SIMS analysis. The resulting depth profiles (not shown) exhibit qualitatively the same characteristics, especially in the lithium distribution. This clearly demonstrates, that the stepwise lithium profile is not a result of a matrix effect [9], which is caused by the change in the chemical surrounding upon lithium ion deintercalation, since this would lead to the changes of the relative intensities of the elements when comparing positive and negative spectra.
16
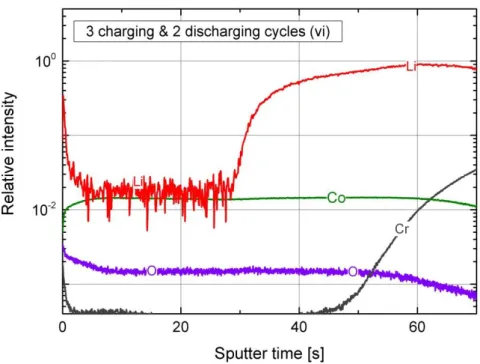
Figure 4: GDOES depth profile of a LCO thin film after 2 cycles and charging to charged state.
Besides the ToF-SIMS analyses, GDOES measurements were performed as a comparative analytical technique for elemental depth profiling. The GDOES results are also used to further exclude the SIMS matrix effect as the origin for the lithium profile and hence confirm the stepwise lithium concentration in the LCO thin film upon charging. Fig. 4 shows the GDOES depth profile of a charged LCO thin film with the same cycling history as the SIMS analysis in Fig. 2f). The lithium signal also shows a stepwise profile with a layer of lower lithium concentration close to the surface and a inner part of the film with higher lithium content, which is consistent with the analog SIMS measurement. The Co and O signals are homogeneous across the whole LCO thin film. Therefore, the GDOES results confirm the SIMS observation of the stepwise change of lithium concentration for charged LCO thin films, since it is less sensitive to matrix effects (due to the spatial separation of the sputter and the excitation process) [27].
17
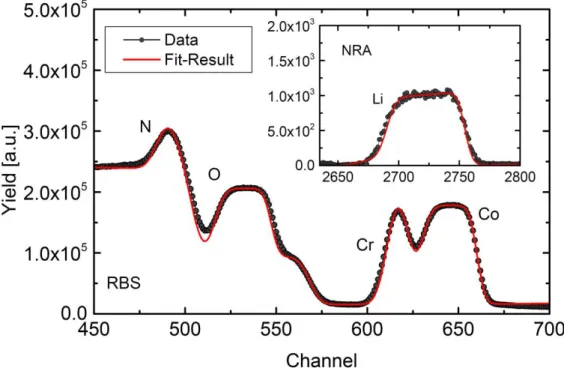
Figure 5: RBS and NRA (Inset) data as well as the calculated SIMNRA fit result for the double discharged LCO thin film. The corresponding SIMS profile is shown in Fig. 2e).
Because SIMS and GDOES can only yield a qualitative description of the elemental composition, the composition of the two times discharged LCO thin film, with the SIMS profile shown in Fig. 2e, was also analyzed by NRA. The measured NRA and RBS spectra as well as the fitting result of the SIMNRA simulation are shown in Fig. 5. The simulation yields lithium to cobalt ratio of 0.9:1.0 for this film, indicating a slight lithium deficiency. Using the NRA as quantitative reference, one can assume that the equal intensity ratios in the lithiated parts of the other SIMS profiles of Fig. 2 correspond to analog lithium to cobalt ratios. Furthermore, the relative density of the film is calculated to be 87% by combining the SIMNRA results with the film thickness derived from the SIMS measurement. Taking into account this relative density, the electrochemical utilization of the LCO film in Fig.1b) was 80-86%.
18
Overall, the ToF-SIMS and GDOES depth profiles from Fig. 2 to 4 show the reversible transition from a homogeneous lithium distribution in the discharged state to a stepwise lithium distribution in the charged state of LCO thin films. The stepwise lithium profile proves that the lithium ions are not homogeneously extracted during the charging of the LCO thin film; even with prolong holding times at the final Voltage.
A similar observation which shows a stepwise lithium distribution was recently reported by Kikkawa et al.. A surface layer with Li depletion well below x=0.4 for LixCoO2 was found to reach up to 100 nm into their 60% charged LCO particles [28]. They comment that this over-delithiated layer was due to the reaction between the used liquid electrolyte and LCO, resulting in the formation of Co3O4 and CoO accompanied by an oxygen extraction from the particle surface. Furthermore, Kikkawa et al. also observed that nanocracks were formed on the surface of their LCO particles which they associated with the relaxation of lattice strain, induced by extraction of Li ions and oxygen, resulting in changes in the crystal structure. This mechanism is then leading to the degradation of LCO upon cycling due to its irreversibility.
Additionally, Oudenhoven et al. also observed an inhomogeneous extraction of lithium ions from an enriched 6LiCoO2 thin film cathode in their in situ neutron depth profiling (NDP) experiments [29]. While charging their thin film all solid state battery to an aimed composition of Li0.5CoO2 and monitoring the lithium concentration by NDP, they detected a similar lithium profile. The cathode region close to the solid electrolyte exhibited a lithium ion extraction below Li0.5CoO2 while the inner part of the cathode maintained at a higher lithium concentration. Their explanation for the delithiation below Li0.5CoO2 is attributed to the fact that NDP can only detect 6Li isotope. Therefore, they state that the low 6Li concentration in the proximity of the
19
electrolyte, which is not enriched with 6Li, is affected by a change of the 6Li/7Li abundance ratio in the enriched 6LiCoO2 cathode and does not reflect the real Li composition.
Both publications support our general finding of a stepwise lithium profile with an over-delithiated layer close to the surface followed by a rather steep transition to a region with higher lithium concentration close to the current collector, but their explanations are not applicable to our experiments. First, it is very unlikely that a reaction between the used liquid electrolyte and LCO would reversibly for at least 21 cycles form a Co3O4 and CoO containing layer extending down to around half of the film thickness. Second, SIMS analysis is capable of distinguishing between different isotopes and the stepwise Li profile is visible for both Li isotopes.
In summary, the combination of the electrochemical picture provided by our CV measurement and the microscopic elemental distribution from our depth profiling results reveals the following information about the lithium de/intercalation of LCO thin films. From the electrochemical point of view, the LCO thin films show a utilization of 80-86% using a charging voltage of 4.1 V vs. Li+/Li without taking into account the ohmic polarization across the cell. This fits very well to our initial target of delithiating LCO down to Li0.5CoO2 for the thin film. On the other hand, the closer look into the elemental distribution in the LCO thin films shows us that a highly Li depleted area was developed from the surface into its interior but not extends more than 50 % through the film. Comparing the high Li concentration region in the charged samples to the discharged samples and the as deposited state, it can be concluded that the area in the proximity of the current collector is still highly lithiated.
Assuming that the highly lithiated part of the charged samples is still close to the initial composition and the depleted part is only deltithiated down to Li0.5CoO2, as
20
expected for charging up to 4.1 vs. Li+/Li, the complete extraction of lithium to an overall composition of Li0.5CoO2 would add up to a capacity well above the theoretical capacity, i.e. 69 µAh cm-2µm-1. Therefore, the combination of electrochemical and depth profiling results is pointing to a delithiation well below Li0.5CoO2 in the Li depleted region of the film.
Generally, in bulk LCO, delithiation below x=0.5 is usually regarded as irreversible, since a transition from a hexagonal to a monoclinic phase accompanied by large changes in the c lattice parameter takes place which also associate with loss of oxygen from LCO[11, 14, 15, 30]. This variation of the lattice parameters and loss of oxygen is believed to cause the failure of the material, which results in capacity fading during electrochemical cycling with high lithium extraction. In contrast, the measured cells could be charged and discharged at least 21 times with fairly good efficiency. This hints at a stabilizing mechanism, allowing for reversible local over-charging of the LCO thin films.
One possible stabilizing mechanism could be the pinning of the film in the (003) orientation by the substrate, as exemplary seen in the X-ray diffraction patterns of a charged LCO thin film, Fig. 6. The measurement under grazing incidence only shows a (003) reflex at 18.8° clearly evidencing the (003) texture of the film. The other reflexes of the LCO cannot be separated from the background signal in the grazing incidence measurement. For the measurements under normal incidence, the power of the x-ray tube was adapted for the low and high angular range, in order to compensate for the large intensity difference of the reflexes. For diffraction angles above 22°, the power of the X-ray tube was increased by a factor of eight. Besides the intense (003) reflex, the measurement under normal incidence also reveals further, less intense reflexes, which can be connected to HT-LCO (ICDD#:
00-050-21
0653), i.e hexagonal phase LCO. In addition, there are also two distinct reflexes at 37.4° and 43.6° from the CrN (ICDD#: 03-065-2899) current collector visible.
Figure 6: XRD patterns of a charged LCO thin film under grazing and normal incidence with corresponding references for LCO and CrN current collector.
Jang et al. reported of reversible high voltage cycling up to 4.4 V of (003) oriented LCO thin films [16]. Furthermore, Hart et al. and Bates et al. suggest that the growth of (003) oriented LCO thin film at ~1 m in thickness by using high temperature substrate during deposition is due to the tendency to minimize the volume strain energy of the film [12, 31]. Therefore, as long as the internal strain of the film is not released, the strain could be relaxed by delithiation and lowering its lattice volume in the direction of the strain if the LCO film is constrained. Thus, one possible explanation would be the energy level which is normally necessary to extract the Li ions out of LCO could be lower than what it should be by the strain in the film while the structure is also maintained.
22 Conclusion
Crystalline LCO thin films with an underlying CrN current collector were deposited via magnetron sputter deposition and cycled with liquid electrolyte against Li metal to different states of charge. The state of charge dependency of the Li distribution was investigated by depth profiling via ToF-SIMS and GDOES. Both analytical techniques independently reveal an inhomogeneous Li distribution in the charged, delithiated state and a homogeneous elemental distribution for the discharged state. The measured Li profiles in the charged state show a region with a depleted lithium concentration originating from the electrolyte-facing surface followed by a transition to a region with a higher Li content. The comparison of the depth profiles of the discharged and charged states shows that the plateaus with the high Li content correspond to a fully lithiated LCO thin film. Combining this microscopic elemental distribution with the electrochemical results a delithiation below the reversible stability limit of Li0.5CoO2 is indicated by the comparison of the extractable and theoretical capacity of the LCO thin films. The reversible lithium extraction of LixCoO2 below x = 0.5 is possibly connected to the pinning of the LCO thin film in the (003) orientation and the internal strain in the thin film.
Acknowledgement
The authors would like to thank M. Krott, T. Albrecht and F. Vondahlen for the support with the sputter deposition processes. We also thank Y. J. Sohn for the XRD analysis and J. Steffens for the GDOES analysis. Furthermore, the financial support by the Helmholtz Association under grants “Elektrochemische Speicher im System – Zuverlässigkeit und Integration“ and “Helmholtz-Initiative für Mobile / Stationäre Energiespeichersysteme“, and by the German Federal Ministry of Education and
23
Research, under project no. 03X4634C (“Meet Hi-EnD”), and the Ministry of Innovation, Science and Research of North Rhine-Westphalia under project no. 424-Japan (ERA-NET) is gratefully acknowledged.
24 Glossary
CCD charge coupled device
CV cyclic voltammetry
EDX energy dispersive X-ray analysis
GDA glow discharge analyzer
GDOES glow discharge optical emission spectroscopy
ICP-MS inductively coupled plasma – mass spectrometry
ICP-OES inductively coupled plasma – optical emission spectroscopy
LCO LiCoO2
NRA nuclear reaction analysis
PVD physical vapor deposition
RBS Rutherford backscattering
ToF-SIMS time of flight – secondary ion mass spectrometry
WDX wavelength dispersive X-ray analysis
XPS X-ray photoelectron spectroscopy
25 References
[1] H.Y. Park, S.R. Lee, Y.J. Lee, B.W. Cho, W.I. Cho, Materials Chemistry and Physics, 93 (2005) 70-78.
[2] K. Tadanaga, H. Egawa, A. Hayashi, M. Tatsumisago, J. Mosa, M. Aparicio, A. Duran, Journal of Power Sources, 273 (2015) 844-847.
[3] A. Bünting, S. Uhlenbruck, C. Dellen, M. Finsterbusch, C.L. Tsai, D. Sebold, H.P. Buchkremer, R. Vaßen, Journal of Power Sources, 281 (2015) 326-333.
[4] R. Janski, M. Fugger, M. Sternad, M. Wilkening, ECS Transactions, 62 (2014) 247-253.
[5] C. Pereira-Nabais, J. Światowska, M. Rosso, F. Ozanam, A. Seyeux, A. Gohier, P. Tran-Van, M. Cassir, P. Marcus, ACS Applied Materials & Interfaces, 6 (2014) 13023-13033.
[6] T. Sui, B. Song, J. Dluhos, L. Lu, A.M. Korsunsky, Nano Energy, 17 (2015) 254-260.
[7] J.T. Lee, N. Nitta, J. Benson, A. Magasinski, T.F. Fuller, G. Yushin, Carbon, 52 (2013) 388-397.
[8] N. Yabuuchi, K. Yoshii, S.-T. Myung, I. Nakai, S. Komaba, Journal of the American Chemical Society, 133 (2011) 4404-4419.
[9] V.R. Deline, W. Katz, C.A. Evans, P. Williams, Applied Physics Letters, 33 (1978) 832-835.
[10] K. Mizushima, P.C. Jones, P.J. Wiseman, J.B. Goodenough, Materials Research Bulletin, 15 (1980) 783-789.
[11] J.N. Reimers, J.R. Dahn, Journal of The Electrochemical Society, 139 (1992) 2091-2097.
[12] J.B. Bates, N.J. Dudney, B.J. Neudecker, F.X. Hart, H.P. Jun, S.A. Hackney, Journal of The Electrochemical Society, 147 (2000) 59-70.
[13] N.J. Dudney, Y.-I. Jang, Journal of Power Sources, 119–121 (2003) 300-304. [14] T. Ohzuku, A. Ueda, Journal of The Electrochemical Society, 141 (1994) 2972-2977.
[15] T. Ohzuku, A. Ueda, M. Nagayama, Y. Iwakoshi, H. Komori, Electrochimica Acta, 38 (1993) 1159-1167.
[16] Y.-I. Jang, N.J. Dudney, D.A. Blom, L.F. Allard, Journal of The Electrochemical Society, 149 (2002) A1442-A1447.
[17] Y.J. Kim, E.-K. Lee, H. Kim, J. Cho, Y.W. Cho, B. Park, S.M. Oh, J.K. Yoon, Journal of The Electrochemical Society, 151 (2004) A1063-A1067.
[18] E. Endo, T. Yasuda, A. Kita, K. Yamaura, K. Sekai, Journal of The Electrochemical Society, 147 (2000) 1291-1294.
[19] K. Iltgen, C. Bendel, A. Benninghoven, E. Niehuis, Journal of Vacuum Science & Technology A, 15 (1997) 460-464.
[20] D. Dieumegard, B. Maurel, G. Amsel, Nuclear Instruments and Methods, 168 (1980) 93-103.
[21] M. Mayer, in: Report IPP 9/113, Max-Planck-Institut für Plasmaphysik, Garching, Germany, 1997.
[22] V. Paneta, A. Kafkarkou, M. Kokkoris, A. Lagoyannis, Nuclear Instruments and Methods in Physics Research Section B: Beam Interactions with Materials and Atoms, 288 (2012) 53-59.
[23] S. Takeuchi, H. Tan, K.K. Bharathi, G.R. Stafford, J. Shin, S. Yasui, I. Takeuchi, L.A. Bendersky, ACS Applied Materials & Interfaces, 7 (2015) 7901-7911.
[24] M. Matsui, K. Dokko, K. Kanamura, Journal of Power Sources, 177 (2008) 184-193.
26
[25] W.-S. Yoon, K.-B. Kim, Journal of Power Sources, 81–82 (1999) 517-523. [26] S. Nakahara, Thin Solid Films, 64 (1979) 149-161.
[27] K. Shimizu, H. Habazaki, P. Skeldon, G.E. Thompson, Spectrochimica Acta Part B: Atomic Spectroscopy, 58 (2003) 1573-1583.
[28] J. Kikkawa, S. Terada, A. Gunji, T. Nagai, K. Kurashima, K. Kimoto, The Journal of Physical Chemistry C, 119 (2015) 15823-15830.
[29] J.F.M. Oudenhoven, F. Labohm, M. Mulder, R.A.H. Niessen, F.M. Mulder, P.H.L. Notten, Advanced Materials, 23 (2011) 4103-4106.
[30] R. Hausbrand, G. Cherkashinin, H. Ehrenberg, M. Gröting, K. Albe, C. Hess, W. Jaegermann, Materials Science and Engineering: B, 192 (2015) 3-25.