Syracuse University Syracuse University
SURFACE
SURFACE
Dissertations - ALL SURFACE
May 2018
Three Essays on Public Policy and Health
Three Essays on Public Policy and Health
Jessica E. Sauve-Syed Syracuse University
Follow this and additional works at: https://surface.syr.edu/etd Part of the Social and Behavioral Sciences Commons
Recommended Citation Recommended Citation
Sauve-Syed, Jessica E., "Three Essays on Public Policy and Health" (2018). Dissertations - ALL. 874. https://surface.syr.edu/etd/874
This Dissertation is brought to you for free and open access by the SURFACE at SURFACE. It has been accepted for inclusion in Dissertations - ALL by an authorized administrator of SURFACE. For more information, please contact
Abstract
This dissertation is comprised of three essays on health and public policy. My research examines how regulations and targeted programs impacted health outcomes.
The first two chapters use the unexpected shock of water borne lead in Flint Community Schools’ classrooms to estimate the causal impacts of lead on students’ cognitive and behavioral outcomes. The first paper focuses on the short-run academic achievement of elementary school children. At the average level of lead exposure, conservative estimates find that the share of students scoring proficient on statewide standardized exams drops by 6 to 9 points in math and drops by 12 to 14 points for reading. This represents an average of 3 to 5 students for a typical grade within a school. The second paper estimates the impact of lead exposure on student behavior. The analysis finds that during the Flint Water Crisis a typical grade within a school receives 8.6 additional disciplinary actions per year at the average level of lead exposure.
The third chapter focuses on the perennial topic of access to healthcare and health
outcomes. Access in this case is measured by the supply of primary care physicians. The federal Health Professional Shortage Area initiative identifies underserved areas and makes them
eligible for incentives to attract physicians. Using propensity score matching methods, an average 3 percent decline in mortality rates is found for areas that receive the designation.
Three Essays on Public Policy and Health
By
Jessica E. Sauve-Syed B.A., Syracuse University, 2009
Dissertation
Submitted in partial fulfillment of the requirements for the degree of Doctor of Philosophy in Economics
Syracuse University May 2018
Copyright © Jessica E. Sauve-Syed, 2018 All Rights Reserved
Acknowledgements
I would like to express my deepest appreciation to my primary advisor Jeffrey Kubik for his guidance and support throughout this process. I am also very grateful to Gary Engelhardt for his advice and feedback along the way. I am thankful to my dissertation defense committee: Elizabeth Ashby, Gary Engelhardt, Jerry Evensky, Jeffrey Kubik, Perry Singleton, and the chair, Sarah Hamersma. I also thank Jerry Evensky and Inge O’Connor who have been supportive in achieving my goals.
On a personal note, I thank my close friends and family who have provided words of encouragement and share in my joy at this completion. I am forever grateful to my parents, Brent and Sandy Sauve, who have always valued education and supported my dreams. Finally, the love and support of my husband, Syed Adnan Alli, has been invaluable. I am appreciative of his continued patience and encouragement.
Table of Contents
1. Lead Exposure and Student Performance: A Study of Flint Schools ... 1
1.1 Introduction ... 2
1.2 Background ... 6
1.2.A The Source of Flint’s Water Crisis ... 6
1.2.B The Dangers of Lead and Its Impact on Children ... 7
1.2.C Lead and Student Achievement ... 9
1.3 Data ... 12
1.3.A Student Achievement Data ... 12
1.3.B Classroom Lead-in-Water Data ... 13
1.3.C Summary Statistics ... 15
1.4 Empirical Strategy ... 17
1.5 Results... 20
1.5.A Primary Results ... 20
1.5.B Estimating Within Flint ... 22
1.6 Robustness ... 24
1.7 Discussion ... 26
1.8 Conclusion ... 28
Chapter 1 Figures ... 30
Chapter 1 Tables ... 36
2. Student Behavior and Lead Exposure: Evidence from School Discipline Data ... 42
2.1 Introduction ... 43
2.2 Background ... 47
2.2.A The Flint Water Crisis ... 47
2.2.B Lead Exposure and Child Development ... 49
2.2.C Lead and Behavior ... 51
2.3 Data ... 53
2.3.A Water Borne Lead Data ... 53
2.3.B Student Behavior Data... 54
2.3.C Summary Statistics ... 55
2.4 Empirical Strategy ... 56
2.5 Results... 59
2.5.A Lead and Disciplinary Action ... 59
2.5.B Impacts by Discipline Type ... 61
2.5.C Impacts by Age ... 62
2.6 Robustness ... 63
2.7 Discussion ... 64
2.8 Conclusion ... 66
Chapter 2 Tables ... 67
3. Health Professional Shortage Area Designations and Mortality ... 74
3.1 Introduction ... 75
3.2 Background ... 77
3.2.B Health Professional Shortage Area Designations ... 79
3.2.C Physician Supply and Health Outcomes ... 81
3.3 Data ... 84
3.3.A Health Professional Shortage Area Variable ... 84
3.3.B Mortality Data ... 85
3.3.C Summary Statistics ... 86
3.4 Empirical Strategy ... 86
3.5 Results... 89
3.5.A Basic Results... 89
3.5.B Impacts by Cause of Death ... 90
3.5.C Impacts by Early and Late Periods ... 90
3.6 Robustness ... 92 3.7 Discussion ... 94 3.8 Conclusion ... 95 Chapter 3 Figures ... 96 Chapter 3 Tables ... 100 Appendices ... 108 Bibliography ... 116 Vita ... 125
List of Figures
Figure 1.1: Timeline of Flint Water and School Testing by Academic Year... 30
Figure 1.2: Blood Lead Exposure from Average Classroom Water Draws ... 31
Figure 1.3: Mean Blood Lead Exposure from Average Draws by Year ... 32
Figure 1.4: Heterogeneous Levels of Water Borne Lead Across Classrooms ... 33
Figure 1.5: Blood Lead Exposure from Maximum Classroom Water Draws ... 34
Figure 1.6: Mean Blood Lead Exposure from Maximum Draws by Year ... 35
Figure 3.1: Propensity Score Overlap for Basic Results ... 96
Figure 3.2: Box Plot of Basic Results ... 97
Figure 3.3: Standardized Bias for Matched and Unmatched Counties ... 98
List of Tables
Table 1.1: Summary of Data for Flint and Comparison School Districts ... 36
Table 1.2: Basic Regression ... 37
Table 1.3: Basic Regression within Flint Community Schools ... 38
Table 1.4: Flint Community Schools with Linear Time Trends ... 39
Table 1.5: Basic Regression with Maximum Treatment Variable ... 40
Table 1.6: Comparing Estimated Impacts on Shares (Not) Proficient ... 41
Table 2.1: Summary Statistics ... 67
Table 2.2: Lead and Student Discipline ... 68
Table 2.3: Lead and Types of Discipline ... 69
Table 2.4: Lead and All Discipline by Grade Ranges... 70
Table 2.5: Lead and All Discipline by Grade Ranges with Added Controls ... 71
Table 2.6: Lead and Student Discipline with Maximum Lead Exposure ... 72
Table 2.7: Lead and Student Discipline with Missing Values ... 73
Table 3.1: Summary Statistics with County Level Averages ... 100
Table 3.2: County Designations by Year ... 101
Table 3.3: Basic Results ... 102
Table 3.4: Basic Results with CDC Data ... 103
Table 3.5: Cause of Death with CDC Data ... 104
Table 3.6: Late and Early Years with One Match ... 105
Table 3.7: HPSA Designation and Mortality Model Robustness Check ... 106
Table 3.8: HPSA Designation and Mortality Data Robustness Check ... 107
Table A1.1: Student Performance Variable Description ... 111
Table A1.2: Calculation for Blood Lead Exposure ... 112
Table A1.3: Matching Characteristics for Flint and Comparison Schools ... 113
Table A3.1: CDC Mortality Codes ... 114
Chapter 1
1.1 Introduction
There is a large literature in public health that links childhood lead exposure to negative cognitive impacts. The findings suggest that even low levels of lead exposure may result in permanent deficiencies. Therapies designed to mitigate the effects of lead after exposure appear unsuccessful in reducing the severity of the cognitive declines (Kaufman (2001), Canfield et al (2005), Shih et al (2007)). Lead ingestion often occurs at an early age and may have
considerable ramifications for life long success.
This evidence has motivated economic studies related to human capital, including the impacts of early childhood lead exposure on elementary school standardized exams and lifetime earnings (Cohen-Cole (2006), Rau et al (2013), Reyes (2015), Aizer et al (2017)). These studies rely on variation in lead exposure between households or neighborhoods to calculate the effects on long-run outcomes. Unfortunately, student performance and lifetime earnings are also correlated with household and neighborhood characteristics that are not easily observed. One of the greatest challenges in this literature has been disentangling the causal impacts of lead
exposure from endogenous household and neighborhood effects.
This study overcomes this challenge with unique data from a quasi-natural experiment in Flint, Michigan that resulted in an exogenous shock of lead exposure at the classroom level. The City of Flint faced a looming financial crisis and was appointed an emergency financial manager by the governor of Michigan from 2011 to 2015. During this time costs were cut across the city to address the large deficit. In early 2014, the City of Flint stopped sourcing its municipal water from the City of Detroit and started locally treating the Flint River to save money. This switch resulted in highly corrosive water being supplied to homes, businesses and public buildings until October of 2015. Lead found in service lines connecting buildings to the municipal water system
as well as lead components in water fixtures leached into the water. The localized lead sources resulted in heterogeneous levels of lead-in-water at the fixture for classrooms within school buildings.
An important contribution of this study is the exogenous source of lead variation to estimate the causal impact of lead on student achievement. Students of Flint Community
Schools were randomly exposed to different levels of lead-in-water within schools based on their assigned classroom. Fountains within elementary schools appear similar, but the variation in the distribution of lead within fountain components as well as soldered pipe joints contributed to different levels of lead-in-water across classrooms. Information requested from Flint
Community Schools is used to link proficiency measures from state standardized exams to classroom lead-in-water levels. A novel measure of lead exposure is created to account for variation in the cumulative stores of lead in students’ bodies. Cohort panel data within each elementary school is used to study the same students over time to estimate the short run impacts of lead exposure. This builds on the work of previous studies which relied on variation between cohorts before and after the passage of lead abatement policies to estimate the effect of early childhood blood lead tests on academic achievement in elementary school.
This study also provides valuable insight into the short run effects of lead on the
academic achievement of older children. There is very little work that focuses on this age group. The physical symptoms of lead exposure are rare in elementary school children, so there has been less urgency to study these students. The lack of visible symptoms may provide a false sense of security if there are severe cognitive consequences.
Significant, meaningful impacts on student proficiency are found using the exogenous shock in lead exposure with a fixed effects specification. At the mean level of cumulative lead
exposure, the estimated impact on share proficient in reading is -12 to -14 percentage points. The share proficient in math dropped -6 to -9 percentage points. The impact on share not proficient in reading is an increase of 13 to 15 percentage points. The magnitudes of these changes reflect an average of three to five students in a typical school cohort. A larger impact on reading proficiency as compared to math is consistent with patterns found in previous studies in the economic literature.
The education literature has historically focused on production variables, such as class size, per pupil spending, teacher quality, and student nutrition. These factors only explain a small portion of the gaps in student achievement. This study provides evidence of an important classroom environmental factor for student success that has not been previously studied. The education production literature suggests that per pupil spending would have to change by 10 to 20 percent to impact proficiency shares by similar magnitudes (Papke and Wooldridge (2008), Kesler and Munkin (2015)).
This study adds to a growing literature that tests the effects of environment and health on academic outcomes. School level analyses suggest that air quality and temperature influence student test scores (Stafford (2015), Cho (2017), Park (2017), Marcotte (2015) (2017)). This study utilizes within school variation to explore another dimension of school environment, classroom water quality. Health shocks and access to early childhood healthcare have traditionally been used to estimate the effects on future attainment (Case et al (2005), Currie (2009), Levine and Schazenbach (2009), Contoyannis and Dooley (2010), Robinson and Coomer (2014)). By comparison, this paper studies a decline in cognitive ability during and shortly after the period of lead exposure.
The findings suggest that school infrastructure can be important for academic success. A small literature has estimated the effects of school bonds on student achievement and found little impact (Callini et al (2010), Hong and Zimmer (2016), Martorell et al (2016)). However, these previous studies do not differentiate between different school improvement initiatives. Targeted maintenance as well as regular water analysis may be valuable to student success. Corrosion of brass components that contain lead can result in elevated lead-in-water for both old and new buildings. A timely response to elevated levels of lead may be important to ensuring a safe and productive academic environment.
The results of this study are measured in the short run, and it is unclear whether the declines in achievement will persist. The previous literature suggests that the impacts from elevated blood lead levels in young children have permanent consequences for human capital development. However, there are developmental differences between young children and elementary school students. Even if the cognitive deficiencies are temporary, it is possible that short-term lags in achievement may impact future attainment if students are not provided the resources needed to catch up.
The paper continues with the following sections. Background information is provided on the Flint water crisis, the regulation of lead and its effects on children, as well as recent efforts to estimate the impacts of lead on student achievement. Then the data are described and details are provided about the construction of the variable of interest, cumulative blood lead exposure. The estimation strategy and main results follow. The robustness of the treatment variable is tested with an alternative measure of lead exposure. Finally, a brief discussion about the results and a conclusion are offered.
1.2 Background
1.2.A The Source of Flint’s Water Crisis
In 2013, the City of Flint decided to break its water supply contract with Detroit Water and Sewage in favor of a new pipeline that was under development. This triggered a one-year notice of termination for Flint’s current water supply contract1. A decision was made to treat the
local Flint River while the new supply lines were constructed. The City of Flint’s water
treatment plant had the capacity to treat water in the interim, but it had not been regularly utilized in nearly 50 years (Davis et al, 2016).
The water supplied from Detroit had been regularly treated with orthophosphate for more than twenty years. This additive to the water builds a protective passive layer inside pipes to prevent corrosion. After the change in water sources the City of Flint chose not to continue with the orthophosphate or utilize other corrosion inhibitors. This made the passive layer susceptible to flaking and exposed the pipes to corrosion (Torrice, 2016).
Surface waters, such as rivers, are naturally corrosive and have more organic materials in them. They also require more treatment to remove particles and microorganisms2. To kill off
microorganisms chlorine is added to the water as a disinfectant. In the City of Flint the chlorine reacted with iron in the pipes and caused corrosion. The corrosion process consumed the chlorine, leaving bacteria in the water and exposing lead in the pipes.
Killing off microorganisms with the chlorine increased the organic material in the water. To remove the contaminating materials ferric chloride was added as a coagulate to assist in the filtering process (Torrice, 2016). This combined with the already corrosive water to cause
1 “Flint Water Crisis Fast Facts.” CNN. http://www.cnn.com/2016/03/04/us/flint-water-crisis-fast-facts/index.html (accessed September 1, 2017).
2 Olson, T. 2016. “The science behind the Flint water crisis: corrosion of pipes, erosion of trust.” The Conversation, January 28. https://theconversation.com/the-science-behind-the-flint-water-crisis-corrosion-of-pipes-erosion-of-trust-53776
chloride levels to soar. High chloride-to-sulfate ratios in water are known to be very corrosive to lead (Edwards and Triantafyllidou, 2007). In general, a chloride-to-sulfate ratio of .58 is
considered an upper bound for water management. Researchers from Virginia Tech sampled treated water with ratios as high as 1.6 in Flint during the water crisis.
Corrosive water can leach lead from many plumbing sources. Lead service lines and lead solder in older homes are obvious origins, but lead is also used in brass components for water fixtures including faucets, fountains, valves and other components. Analysis provided by the Michigan Department of Environmental Quality reported elevated levels of lead in the Flint Community Elementary Schools’ water and cite water fixtures as the probable sources3. 1.2.B The Dangers of Lead and Its Impact on Children
Lead in the water has been a target of federal regulations for nearly half a century. Under the 1974 Safe Drinking Water Act, the Environmental Protection Agency (EPA) set a non-enforceable maximum containment level goal of zero for lead, signaling that there are no safe levels of lead exposure4. Starting in 1986 lead pipes and lead solder were banned from new
water and plumbing systems. Lead content in brass plumbing components was limited to eight percent. This followed the restriction of lead in residential paint (1978) and the transition away from leaded gasoline, two other common sources of lead exposure. The Lead and Copper Rule in 1991 addressed issues of corrosion control and set an actionable level for lead in public water at 15 parts per billion (ppb) at the 90th percentile for customer taps.
The regulations expanded in response to a growing literature of the health impacts of lead. Lead is a toxin that can cause numerous medical issues. At high levels, it may even cause
3 Taking Action on Flint Water. 2015-2017. “School Testing.” State of Michigan.
http://www.michigan.gov/flintwater/0,6092,7-345-76292_76294_76297---,00.html (accessed September 15, 2016). 4 “Basic Information about Lead in Drinking Water.” United States Environmental Protection Agency.
https://www.epa.gov/ground-water-and-drinking-water/basic-information-about-lead-drinking-water (accessed on August 28, 2017).
death. Once lead enters the body it is absorbed into the blood. Absorption rates vary by age, with young children absorbing up to 50% of consumed lead and adults absorbing as little as 10%. Pharmacokinetic models of lead assume children as young as 8 years old have the same absorption rates as adults. These models attempt to quantitatively model biological relationships and the impacts of lead but have often had to rely on limited observational data to calibrate absorption rates. As a result, the broader medical field has traditionally assumed that older children are not as susceptible to the impacts of lead (Toxicological Profile of Lead, 2007). Lead mimics calcium and iron, leading to greater absorption in people with nutrition deficiencies. Once absorbed into the blood lead passes through the circulatory system where it becomes deposited in tissues and bone. The half-life for lead in the blood is 30 days, while for tissues and bones the half-life is years or even decades (Toxicological Profile of Lead, 2007). For this reason, lead can continue to cause issues in the body long after blood lead levels have dropped to within a normal range.
Children are especially vulnerable to problems caused by elevated blood lead levels. Their developing bodies absorb lead more easily than adults. Of particular concern is the underdeveloped blood brain barrier. Lead’s ability to pose as calcium and pass into the brain presents a high risk during neurological development. This substitution impacts the creation of synapses and neurotransmitters in the brain. Long-term behavioral and intellectual deficiencies have been observed at relatively low levels of lead exposure. The blood brain barrier is still developing into the second decade of a child’s life, posing a particularly large risk for growing children with nutrient deficiencies (Lidsky and Schneider, 2003).
Young children also run a greater risk of exposure. Toddlers can mistakenly put dust and chips from lead paint in older homes into their mouths. In 1991, the CDC recommended
universal blood lead testing for all young children. Many states have since adopted blood lead screenings and tests during routine children’s appointments. In 1991, a blood lead level of concern was greater than 15 micrograms per deciliter, down from 60 in 1960. As scientific studies have found negative impacts from lead at lower levels, the blood lead level of concern has also dropped. In 2012 the CDC decided to discontinue the use of this system and adopted a policy that all blood lead levels are concerning. Now a reference value of five has been adopted as a trigger for health interventions (Advisory Committee on Childhood Lead Poisoning
Prevention, 2012).
Public resources have focused on prevention and testing for young children due to their greater risk of exposure. This has resulted in a large volume of data for blood lead levels of this age group, and they have subsequently been the focus of many studies. There is reason to believe that elementary school students will behave differently than the young children since they are biologically more developed. Historically, medical models have treated them as fully developed. However, they are not simply small adults as their bodies and brains are still
developing into their second decade (Lidsky and Schneider, 2003). Potential deficiencies caused by lead exposure later in childhood can impact students’ learning and their subsequent human capital development. Their loss of opportunity and truncated success have broader implications for societal welfare and issues of equality.
1.2.C Lead and Student Achievement
Early studies look at both long-term and short-term impacts of early childhood lead exposure and intellectual outcomes. Bellinger and coauthors (1990) measured lead exposure through deposits of lead in children’s teeth. Their analysis finds negative impacts in elementary school as well as high school academic achievement. For more contemporaneous outcomes,
Chen and coauthors (2005) find that for children age two to seven concurrent blood lead levels became more strongly associated with IQ as the children grew older. In recent years access to data from universal lead testing programs and student achievement records has renewed interest and resulted in new estimates.
Zhang and coauthors (2013) claim to be the first to test the relationship between early childhood blood lead levels and classroom achievement. Confidential data from Detroit Public Schools linked to early childhood blood lead tests suggest that high blood lead levels have an odds ratio of 2 or greater for children to be labeled as not proficient on the third, fifth, and eighth grade Michigan standardized exams. The authors admit the study suffers from potential
confounding issues with only limited household data available to control for unobserved characteristics.
Third graders were also studied by Reyes (2015) as well as Aizer and coauthors (2017). Large drops in childhood blood lead levels in the late 1990s in Massachusetts were used to test the relationship between childhood lead exposure and standardized exam results. The strongest relationship suggests that a one percentage point increase in the share of students with blood lead levels over 20 micrograms per deciliter is linked to a one percentage point increase in the share of students scoring unsatisfactory (Reyes, 2015). While interesting, a blood lead level of 20 is no longer common with the 97.5th percentile of early childhood blood lead levels less than 5
(Caldwell et al., 2017).
A Rhode Island lead certificate policy targeting leaded paint in rental units caused a sharp decrease in early childhood blood lead levels. Aizer and coauthors (2017) use an instrumental variable strategy to avoid the issues of endogeneity from previous studies. The probability of having a lead certificate at the time of childbirth based on census tract and family characteristics
is instrumented for the child’s blood lead levels on their early childhood blood test. An increase in blood lead levels by 1 unit is estimated to increase the probability of being below proficient in third grade reading by 3.1 percentage points and in third grade math by 2.1 percentage points.
These studies provide fresh insight and support the broad assertion of an inverse relationship between early childhood blood lead levels and later academic achievement. They are also limited by the cross-sectional nature of the data as well as broad treatment measures. Household and neighborhood factors are correlated with educational outcomes and often children’s health. Blood lead levels are often higher for children from disadvantaged backgrounds.
The use of early childhood blood lead levels may not be a good measure for a child’s exposure to lead. Lead has a relatively short half-life in the blood, just over 30 days, so annual tests may not accurately reflect exposure from earlier in the year. At the same time, lead that is deposited into soft tissues has a much longer half-life and can continue to impact a child. Aizer and coauthors (2017) mention potential issues with measurement error in blood lead levels, particularly the use of capillary samples. According to a CDC report, the measurement error on a child’s blood test is approximately three. Most children who are tested have blood lead levels less than five. The variation due to measurement error may cause issues when studying the low levels of lead common in the post lead abatement program period (Advisory Committee on Childhood Lead Poisoning Prevention, 2012).
This study adds to the existing literature by focusing on lead exposure to elementary school children in third through sixth grades. During this period the absorption and metabolizing of lead is believed to be different from that of young children, but the brain is still undergoing development. This analysis distinguishes itself from most of the academic achievement
literature by focusing on both older children and the short run impacts of lead ingestion. It also departs from the more recent literature by focusing on lead-in-water exposure as opposed to lead paint abatement programs. While this difference may impact initial absorption rates into the blood, it does not change how lead diffuses throughout the body and impacts various organs. Finally, it also uses a unique exogenous shock in lead exposure to identify the impact of lead on academic achievement rather than relying on heterogeneous impacts of public policy.
1.3 Data
1.3.A Student Achievement Data
The student achievement data for this study come from the Michigan Department of Education’s Center for Educational Performance and Information. Data files can be downloaded from the MI School Data web portal5. Proficiency levels are used to measure student
performance. For the 2012-2013 and 2013-2014 academic years, the Michigan Educational Assessment Program (MEAP) standardized test results are utilized; these are the same
examinations used by Zhang and coauthors (2013) in their analysis of Detroit students. For the 2014-2015 and 2015-2016 academic years, the Michigan Student Test of Educational Progress (M-STEP) assessment is used to measure proficiency. The change in examinations reflects statewide reform in student assessment by the Michigan Department of Education. Standardized exams measuring student proficiency are administered prior, during, and after the water crisis. A timeline showing exposure to lead-tainted water and the standardized testing schedule is
available in Figure 1.1.
Math and reading tests are administered to third through sixth grade students under both regimes. The proficiency results are reported within schools at the grade level. Students are categorized into four levels of proficiency based on the number of points earned under both the
MEAP and M-STEP standardized tests. Of the four categories, students who are labeled advanced or proficient are grouped together to generate the share proficient for this study. Students who fall in the bottom tier are labeled not proficient and compose the share not proficient for this study. Further information on the State of Michigan’s Student Performance Levels is available in Appendix Table A1.1.
1.3.B Classroom Lead-in-Water Data
Information about lead-in-water levels for classroom drinking fountains is taken from the Michigan Department of Environmental Quality (DEQ)’s Outlet Sampling and Plumbing
Assessments conducted from late October 2016 to December 20166. Water samples were taken
from each of the operating faucets and fountains in the Flint Community Schools. Four samples over a period of 150 seconds were drawn from each source following a 12-hour stagnation period.
A cumulative blood lead exposure measure is used as the treatment variable in this analysis. This variable is different from the blood lead levels typically used in studies of student achievement. The benefits of the traditional measure include large sample sizes and individual level data. However, blood lead level studies suffer from the short half-life of lead in the blood, which is approximately 30 days. The half-life is important because blood lead levels may fall while there is still significant lead deposited in the organs impacting student success. Analyses that focus on low levels of lead in the blood are also susceptible to measurement error, with the 97th percentile blood lead level less than five micrograms per deciliter and the accuracy of most
laboratories within a variance of two micrograms (Caldwell et. al, 2017).
6Taking Action on Flint Water. 2015-2017. “School Testing.” State of Michigan.
This study’s cumulative blood lead exposure variable reflects total lead exposure throughout the treatment period. By construction, it grows larger over time. This measure is a better reflection of potential lead in the soft tissues and organs during the period of analysis due to the relatively long half-life of lead in the organs and the short run outcomes of this study. The measure also provides real variation over time for school-specific cohorts.
The primary cumulative blood lead exposure variable is generated using all of the water information collected by the Michigan Department of Environmental Quality. The lead-in-water levels are averaged over all four water samples at the classroom level. This is done to most accurately reflect the levels of lead students may have ingested throughout the day.
Achievement data is available at the school-specific cohort level, so a weighted average is taken of the classroom lead-in-water values based on the share of students for a cohort in each
particular classroom. Assumptions about the volume of water and absorption rate are made to find the blood lead exposure for one day. Examples of daily blood lead exposure calculations are available in Appendix Table A1.2.
A challenge for this study is that classroom water is only tested at the end of the exposure period. Students had access to the water for many months leading up to the water test, and it is unlikely that the lead-in-water values found by the DEQ were static during the duration. One of the exams measuring student performance was proctored in the middle of this exposure period. The water at that point likely had less lead than when it was tested several months later. To capture the variation in exposure to lead-in-water over time, the cumulative blood lead exposure variable is created. Data about the average weekly chemical composition of the treated Flint River from the water treatment plant and the science behind lead leaching into water are used to calculate average weekly lead-in-water values for each classroom. This is then combined with
the academic calendar, information about lead absorption, and annual classroom homeroom assignments to create the cumulative blood lead exposure variable for each school-specific cohort. A complete, detailed explanation of how this variable was generated is available in Appendix A1.1 of this paper.
1.3.C Summary Statistics
Classroom water data from the Department of Environmental Quality (DEQ) is matched to student achievement data by classroom number using information obtained from Flint
Community Schools through a Freedom of Information Act (FOIA) request. The request
included details about primary classroom usage and class size. The classroom information spans four academic years and covers the eight elementary schools that operated continuously
throughout the period of study.
Of the eight elementary schools, only six were successful in matching classroom numbers to classroom grade assignments. The room numbers used in the DEQ report for Holmes STEM Academy do not match the room numbers provide by the school district. Based on the DEQ report for Durant Tuuri Elementary drinking fountains were not available in the classrooms occupied by the students of this study. The remaining six elementary schools used in this analysis include Doyle-Ryder Elementary, Eisenhower Elementary, Freeman Elementary, Neithercut Elementary, Pierce Elementary, and Potter Elementary.
Summary statistics are available in Table 1.1. The left two columns provide the statistics for Flint Community Schools before and after the change in the water. Column (1) shows an assumed cumulative blood lead exposure level of two and the average shares proficient and not proficient for math and reading for the two years prior to any change in the water source. Column (2) shows the average values for these variables for the two years following the change
in water. In column (1), Flint students tend to do significantly better in reading than math on the standardized test. Comparing these values to column (2), the share proficient drops for both subject areas and the share not proficient rises. The changes are more than twice the magnitude for reading than for math. The average cumulative blood lead exposure level is 49 and has a large standard deviation, reflecting a large variance in the sample.
Columns (3) and (4) provide the summary statistics for the comparison school districts before and after the change in Flint water. The cumulative blood lead water variable is assumed to be two throughout the period of study. Math and reading proficient shares both drop in the post-water period, suggesting the change from the MEAP to the M-STEP impacted the share proficient more broadly. For not proficient, the reading share grew while the math share dropped slightly. Comparing the pre-period for Flint Community Schools to the comparison schools shows that the students in Flint generally performed worse on the exams prior to lead exposure. The gap is consistently about 10 points for all four proficiency measures.
Figure 1.2 shows the distribution of the cumulative blood lead exposure variable for Flint Community Schools at the time of the standardized tests in the 2014-2015 and 2015-2016
academic years. Most of the observations are less than 50 micrograms, but the right tail extends out to 190. Figure 1.3 presents the average cumulative blood lead exposure by year. From the graph, it is clear that the largest change is between the 2013-2014 and 2014-2015 academic years. A slight increase in the exposure level for the 2015-2016 academic year reflects exposure in May 2015 following the M-STEP exams and exposure in September 2015 prior to when the water fixtures were no longer accessible to students.
Control schools are used in the estimation of the model. The schools are carefully selected to ensure that they are comparable to the Flint Community Schools. The Michigan
Department of Education uses an algorithm to generate peer districts for comparison purposes on their Michigan School Data website. Schools are matched at the district level on a handful of characteristics, including the size of the student population, student-to-instructor ratio,
instructional spending per pupil, the share of students receiving free lunch, and geographic distance from the other districts. Elementary schools from four school districts were chosen as the comparison group. Appendix Table A1.3 summarizes the matching characteristics for each of the districts as well as Flint Community Schools.
1.4 Empirical Strategy
This study utilizes an unexpected change in water quality to estimate the relationship between cumulative blood lead exposure and student academic achievement. The essentially random allocation of students within schools to classrooms with elevated lead-in-water drinking fountains provides an opportunity to address the issues of endogeneity found in other studies. Figure 1.4 provides an example of the within school, across classroom variation of lead for one of the elementary schools in the study.
Panel data analysis is utilized for within school-specific cohorts. The cohorts are identified by anticipated year of graduation. A fixed effects approach that controls for time invariant characteristics within schools, cohorts, and school-specific cohorts addresses many of the issues that confound other studies. The general model used in this study is highlighted below:
The dependent variable, Achieve, is measured as share proficient (not proficient) for cohort c in school s in year t. The variable is the cumulative blood lead exposure variable, measured in micrograms. The coefficient is the estimated impact of lead exposure on
academic achievement and is the coefficient of interest. The regression includes cohort fixed effects to control for differences across cohorts, such as test difficulty. There are school fixed effects to control for differences across schools, not limited to the quality of teachers and the quality of surrounding neighborhoods. The inclusion of cohort by school fixed effects controls for variation in student quality across cohorts within schools. In the basic regression is year fixed effects to control for annual shocks.
All the estimated standard errors are clustered at the school-specific cohort level.
Clustering controls for correlation among groups in the error term and is important for obtaining accurate standard errors. The motivation for clustering comes from the potential autocorrelation between the error terms from consecutive time periods for a school-specific cohort. While there is also potential for error correlation within schools, the small dataset has only six schools to cluster which is too few for accurate statistical inference (Cameron and Miller, 2015).
The variables and are winsorized at the 5th and 95th percentiles to
help control for outliers. The form of the relationship between lead and academic achievement is unclear in the literature, so estimates are provided in both level and log forms for completeness.
Identification of the effects of cumulative blood lead exposure is driven by variation in the intensity of lead exposure and standardized testing results within each school cohort over time. Fixed effects for schools, cohorts, and school-specific cohorts absorb variation caused by static differences among these groups. Year fixed effects and school-specific linear trends control for broad changes impacting all students or students within a school over time. The estimates subsequently reflect the covariance between intensity of cumulative blood lead exposure and movement in proficiency shares within school cohorts over time.
There are several assumptions necessary for identification in this study. First, the exogenous shock of water quality within the classroom cannot be correlated with the quality of students assigned to those classrooms. There were no visible signs indicating which classroom water fountains would contain higher levels of lead based on the analysis conducted by the Department of Environmental Quality and photos of the drinking fixtures.
The shock of water quality within the classroom also cannot be correlated with the level of exposure outside the classroom. The corrosive waters of the treated Flint River caused elevated lead-in-water levels throughout the city, not just in the elementary schools. This study assumes that school-specific cohorts of children that are exposed to higher than average in-water levels at classroom fountains are not systematically exposed to higher than average lead-in-water at home. In general, students in a public elementary school come from the same neighborhood, and often siblings who share the same home living situations are enrolled in different grades. Based on this reasoning, this study assumes that the lead exposure out of school is a random draw among cohorts within the same elementary school.
A third assumption is that the change in state standardized testing is not correlated with the level of lead exposure within classrooms. Such correlations seem unlikely based on the structure of the data. School fixed effects control for general differences in quality across schools. If the exam has become relatively more difficult for a grade, the cohorts across the six schools in that grade would need to experience relatively higher levels of lead exposure at their respective classroom levels. All evidence suggests that the level of lead-in-water at the
classroom level is random within schools.
The results start with the basic regression, which is a two-way fixed effect model estimated with a set of control schools. The inclusion of year fixed effects can control any
potential shocks correlated with the treatment variable that are also related to student
achievement. The analysis then turns to specifications using only Flint Community Schools data. The two-way fixed effects regression is re-estimated. Next, structure is added to the model to preserve variation with linear trends replacing the year fixed effects. The sensitivity of the treatment variable is tested by re-estimating the model with a maximum lead water measure.
As a preview, the results suggest larger impacts for the reading proficiency measures than for the math. Using the mean post treatment lead-in-water value, the impact on share proficient using level and log treatment is -6 to -9 points for math and -12 to -14 points for reading. Similarly, the impact on the share not proficient is 13 to 15 points for reading.
1.5 Results
1.5.A Primary Results
The basic regression is estimated from academic year 2012-2013 through academic year 2015-2016. The fixed effects regression uses variation from within school-specific cohorts to calculate the impact of cumulative blood lead exposure on proficiency shares in math and reading. This approach utilizes the greatest within cohort variation in lead exposure, occurring between the 2013-2014 and 2014-2015 academic years. The lead exposure variable and share (not) proficient variables are all winsorized at the 5th and 95th percentiles to temper the influence
of outliers. To calculate the impact of these estimates the median cumulative blood lead exposure value is 27 micrograms and the mean is 49 micrograms.
Table 1.2 shows the impacts of cumulative blood lead exposure on student proficiency shares using the basic regression. Starting from the left, columns (1), (2), (5), and (6) use level values of the treatment variable and columns (3), (4), (7), and (8) use a logged treatment variable. The cumulative blood lead levels are skewed right, and the logged treatment can
reduce the importance of outliers. The even columns – columns (2), (4), (6), and (8) – are estimated with the inclusion of school-specific linear trends.
Panel A of Table 1.2 shows the results for share proficient for both math and reading. All of the estimates are negative as expected, suggesting that an increase in lead exposure causes a decline in student achievement. The inclusion of the school linear time trends results in more significant estimates. The impacts on share proficient in reading in columns (6) and (8) are statistically different from zero and significant at around the five percent level. The estimates for math are noisier, with only the estimate in column (2) statistically different from zero. The impacts on the share proficient in math is -5 points at the median level of cumulative blood lead exposure and -9 points at the mean. For reading, the estimated impacts of level and logged treatment for share proficient are -8 to -10 points at the median and -12 to -15 points at the mean.
Panel B provides the corresponding results for share not proficient. The estimates for math are statistically different from zero while the results for reading are more significant. The impacts of level and logged treatment on share not proficient in math at the median are 5 to 6 points and 7 to 10 points at the mean. For reading the values are 9 to 12 points at the median and 15 to 17 points at the mean.
The estimates in Table 1.2 rely on the assumption that students in the comparison schools are similar to the students of Flint Community Schools. Comparison schools were chosen from a list of peer school districts identified by the state of Michigan. The variables used to select the comparison schools are available in Appendix Table A3.1. To relax the assumptions surrounding the comparison schools, the model is estimated again using achievement data only from Flint Community Schools.
1.5.B Estimating Within Flint
The basic model is run again using data from Flint Community Schools for 2012-2013 through 2015-2016. The results are shown in Table 1.3. The impacts found in Table 1.2 have disappeared. Nearly all of the estimates are not statistically different from zero. Moving from the full specification to estimating within Flint Community Schools resulted in a significant drop in observations. This decreases the power of the regression. The fixed effects use a lot of the useful variation in the observations, so it is not surprising that these estimates are noisy. The flexibility of the year fixed effects is not practical for this sample. A more restrictive
specification that replaces the year fixed effects with a linear time trend is estimated.
The new model is estimated in Table 1.4. Panel A shows the results for share proficient in math and reading. The regressions that include the school-specific trends are all significant at the one percent level. The estimates for math are slightly less than half the magnitude of the estimates for reading. The impacts for level and logged treatment at the median are -4 to -13 points on the share proficient in math and -6 to -16 points at the mean. Based on the median, the impacts on the share proficient in reading are -8 to -30 points and at the mean they are -14 to -35 points.
Panel B provides the corresponding results for share not proficient. The estimates for math are insignificant and not statistically different from zero. Columns (5) through (8) provide the estimates for share not proficient in reading, which are all highly significant. At the median, the impacts on share not proficient in reading using level and logged treatment are 7 to 31 points and at the mean are 13 to 37 points.
In general, the coefficients for reading, both shares proficient and not proficient, are highly significant at the one percent level. The math proficient estimates are significant at the
one percent level except for column (1), and the share not proficient estimates are not statistically different from zero7.
Overall, the logged treatment results are larger in magnitude than the results from Table 1.2. The level results are similar across both specifications. The results for reading in both Tables 1.2 and 1.4 tend to be more significant and larger in magnitude than the corresponding coefficients for math. Consistency in the linear estimates from both specifications suggests that lead exposure in schools had meaningful impacts on student proficiency8.
Taken together, Tables 1.2 and 1.4 suggest a conservative estimated impact at the mean of -6 to -9 points for share proficient in math, -12 to -14 points for share proficient in reading, and 13 to 15 points for share not proficient in reading. These estimates account for
approximately half of the observed changes in proficiency between the pre- and post-periods. The mean class cohort size is 38 students, so this suggests that exposure to lead in the classroom caused an average of three students to fall out of proficiency in math, five students to fall out of proficiency in reading, and five students to be labeled not proficient in reading for each school-specific cohort.
The education literature has studied many determinants of academic success. From the education production analyses class size, teacher quality, and spending per pupil have received most of the attention. The class size literature is large and conflicted in its analysis. Most studies have failed to identify a meaningful relationship between class size and overall student achievement in elementary school (Hoxby (2000), Chingos (2012), Bosworth (2014)).
7 A squared term is added to the regression to ease the linear restriction and the estimated coefficients are nearly identical to those found in Table 4.
8 The regression from Table 4 was also estimated using a full dataset incorporating the control schools. With the treated variable winsorized to the same level, the results were not statistically different from those found in Table 4.
Teacher quality has also been widely studied. While it is generally understood that a great teacher can have meaningful impacts on student success, measuring what makes a teacher great has been difficult. By and large, the evidence has been meager on teacher qualifications and student outcomes. Teacher productivity has been linked to classroom experience, but studies have found this is only relevant during the first few years of a teacher’s career when they are still honing their practice (Rivkin, Hanushek, and Kain (2005), Buddin and Zamarro (2009), Harris and Sass (2011), Garritsen, Plug, and Webbink (2017)).
There is evidence that per-pupil spending influences student achievement. Findings from both Michigan and Florida suggest a similar impact of a five percentage point increase in
passage rates for fourth graders with an increase of ten percent in spending (Papke and
Wooldridge (2008), Kesler and Munkin (2015)). Using the conservative results from this study, an increase of 10 to 20 percent in per pupil spending is needed to return math proficiency shares to levels prior to the change in water or an increase of 25 to 30 percent in per pupil spending to return reading proficiency shares back to their respective levels.
1.6 Robustness
The main regressions have used a treatment variable calculated from an average of the reported lead-in-water levels for each classroom. The purpose of averaging the water draws collected by the Michigan Department of Environmental Quality was to reasonably approximate the quality of the water students drank throughout the day. There is no reason to believe that this is the only appropriate way to model the variable of interest. The cumulative blood lead
exposure treatment variable is unique to this study, and testing its sensitivity is important for understanding the robustness of the results.
The basic model is estimated again using cumulative blood lead exposure levels derived from the maximum value of lead as opposed to the average of four draws. The process is the same as the derivation of the other cumulative blood lead exposure measure. The new median treatment value is 62 micrograms and the mean is 124 micrograms.
Figure 1.5 shows the distribution of the new treatment variable. The right tail has moved even further away from the mean of the distribution. To mitigate the effects of outliers, the treatment is again winsorized at the 95th percentile and specifications using logged treatment are
estimated. The new average cumulative treatment values by academic year are shown in Figure 1.6. The proficiency data is the same as the summary statistics used for the previous estimates, available in Table 1.1.
Table 1.5 shows the results from estimating the basic regression using the new treatment variable. The estimates follow the same process as Table 1.2. Panel A shows the results for share proficient. The estimates are the expected direction. The reading estimates are larger and more significant, particularly with the inclusion of school linear trends in columns (6) and (8). For math, the estimated impact is -6 points at the median and -11 points at the mean. The impacts on share proficient in reading for level and logged treatment are -9 to -10 at the median and -12 to -19 at the mean.
Panel B of Table 1.5 shows the results for share not proficient. Similar to Table 1.2, the estimates are mostly statistically different from zero and show the anticipated relationship. The impacts for math not proficient are not significant. Columns (5) through (8) show the estimates for share not proficient in reading which are more significant. Using level and logged treatment, the estimated impacts at the median are 11 to 12 points and at the mean are 15 to 22 points.
The results from using the maximum lead draw as an alternative to the average of the four draws largely support the earlier findings in Table 1.2. Comparing the preferred estimates using lead values from the average and maximum water lead levels, the impacts measured at the median are very similar and estimates at the mean are slightly larger when using the maximum values. Table 1.6 compares the estimated impacts between the two treatment variables based on the estimates in Tables 1.2 and 1.59.
1.7 Discussion
The magnitudes found in this study may not accurately reflect the impacts from similar levels of lead exposure in other schools. The absorption of lead into the body and its distribution to the brain and other organs is dependent on student nutrition. Children with deficiencies in calcium and iron are at a greater risk for lead absorption and impacts to cognitive development. More than 80 percent of students in Flint Community Schools qualify for the free lunch program which may signal a greater likelihood for these deficiencies. The impact of similar cumulative lead exposure levels may be smaller for schools whose students are more food secure.
The magnitudes of the impacts may also be affected by the average lead exposure outside of school. In previous studies of younger children, the largest marginal neurological impacts occur at relatively low blood lead levels (Canfield et al (2003), Lamphear et al (2000)). This nonlinearity at low levels of lead exposure suggests that the marginal magnitudes of this study may have been greater if the students had not been exposed to lead outside the classroom.
The main contribution of this study is evidence of meaningful, short run impacts from lead on the achievement of students in elementary school. Until recently, it was assumed that lead exposure in older children was negligible until blood lead levels reached 10 micrograms, the
9 A similar exercise was conducted to compare the results of Table 4 to estimates using the maximum value of lead. The results were very similar across the two specifications.
threshold at which physical symptoms begin to manifest. In 2006, Seattle Public Schools were advised that elevated lead-in-water levels as high as 963 parts per billion presented a very small risk of elevated blood lead levels and subsequent health issues10. Other studies have since
documented negative cognitive impacts for young children with blood lead levels below 10 micrograms. This study adds to the growing literature by finding important impacts for older children with moderate lead exposure.
It is expensive to raise proficiency rates and provide extra support to students who are struggling. A study commissioned by the State of Michigan found it costs 30 percent more for schools to educate at-risk students. The potential costs for students in special education are even higher11. Academic papers have found that per pupil spending needs to increase approximately
twenty percent to raise proficiency rates a magnitude equal to the decline found in this study (Papke and Wooldridge (2008), Kesler and Munkin (2015)). These estimated increases in spending are to raise proficiency shares for a typical cohort. It is not known whether the efforts to raise the performance of older children suffering from lead exposure will require additional support.
This study focuses on the short-run impacts of lead exposure and cannot conclude
whether the cognitive impacts are permanent or can be easily overcome with remedial education. The studies of early childhood blood lead levels suggest that the impacts of lead continue to affect student achievement years later. If students continue to lag in academic achievement after
10 Heffter, Emily, and Warren King. 2006. “Above-normal levels of lead found in Seattle schools’ water.” The Seattle Times, November 9. http://www.seattletimes.com/seattle-news/above-normal-levels-of-lead-found-in-seattle-schools-water/
11 Higgins, Lori. 2016. “Report: At-risk students need more Michigan funding.” Detroit Free Press, June 28. http://www.freep.com/story/news/education/2016/06/28/study-michigan-must-create-equal-school-funding-system/86289694/
the lead exposure, there may be meaningful negative impacts on human capital development that persist into adulthood.
Appropriate plans and actions can be taken with knowledge of the consequences of lead exposure for elementary students. Most schools are not legally required to test their drinking water. However, maintenance of plumbing systems and regular analysis of water quality may now be prudent with evidence that student success is at risk. Officials responding to elevated levels of lead in schools can now make tough decisions with the knowledge that limiting exposure is protecting students. Revisiting what level of lead-in-water is safe for children in school may also be appropriate considering the cumulative impacts on the brain and other organs from extended exposure to low-levels of lead over time.
1.8 Conclusion
This study utilizes an exogenous shock of lead-in-water levels within schools to estimate the impacts of cumulative blood lead exposure on elementary school students. The analysis of Flint Community Schools suggests that at a mean cumulative blood lead exposure of 49 micrograms, the share proficient in math dropped by -6 to -9 points, the share proficient in
reading dropped by -12 to -14 points, and the share not proficient in reading rose 13 to 15 points. These findings were the first to confirm negative, short run impacts on achievement for
elementary school children due to lead exposure.
The analysis is limited by a small sample size and limited variation in the treatment variable. Consistent estimates are found from multiple specifications. The magnitudes found in this study may not accurately reflect the response to exposure in other schools due to differences in environmental factors. The results provide evidence of the risks of lead exposure to older children and offer important insight for school policy.
This paper is the first to use a treatment variable that reflects cumulative blood lead exposure. Other applications using this unique data may prove helpful in understanding the impacts of lead on elementary students. Long run studies have found significant impacts on student behavior, and it would be interesting to test if these relationships are salient in the short run.
The potential harm from exposure to lead has been of public concern for decades. The findings of this study suggest that older children are vulnerable to exposure to elevated lead-in-water levels. This information can help schools and public policy form appropriate responses to the risks of lead exposure in the classroom.
Figure 1.1: Timeline of Flint Water and School Testing by Academic Year
The timeline is presented by academic year. On the timeline, 2012.2013 represents September 2012, the beginning of the 2012-2013 academic year.
2012 MEAP Exam
2013 MEAP Exam
Water Switched to Flint River
2014 M-Step Exam
Water Switched to Detroit Supply 2015 M-Step Exam
Figure 1.2: Blood Lead Exposure from Average Classroom Water Draws
Cumulative blood lead exposure values are pooled from academic years 2014-2015 and 2015-2016. They are calculated using averaged lead-in-water values for Flint Community Schools.
0 1 2 3 4 5 6 7 8 9 0 10 20 30 40 50 60 70 80 90 100 110 120 130 140 150 160 170 180 190 200 Freq u en cy
Figure 1.3: Mean Blood Lead Exposure from Average Draws by Year
Average cumulative blood lead exposure values are assumed to be two for the 2012-2013 and 2013-2014 academic years. Values are estimated at the time of standardized testing.
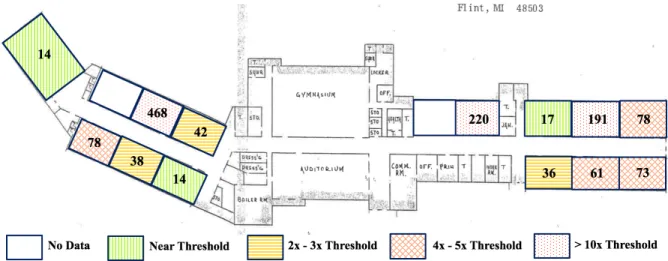
Figure 1.4: Heterogeneous Levels of Water Borne Lead Across Classrooms
This is a map of Pierce Elementary School. The values show the lead-in-water levels as measured in parts per billion for the largest value collected by the Michigan Department of Environmental Quality. The EPA’s threshold is 15ppb.
Figure 1.5: Blood Lead Exposure from Maximum Classroom Water Draws
Cumulative blood lead exposure values are pooled from academic years 2014-2015 and 2015-2016. They are calculated using maximum lead-in-water values for Flint Community Schools.
0 1 2 3 4 5 6 0 50 100 150 200 250 300 350 400 450 500 Freq u en cy
Figure 1.6: Mean Blood Lead Exposure from Maximum Draws by Year
Average cumulative blood lead exposure values are assumed to be two for the 2012-2013 and 2013-2014 academic years. Values are estimated at the time of standardized testing.
2 2 111.47 135.98 0 20 40 60 80 100 120 140 160 2012.2013 2013.2014 2014.2015 2015.2016 Average Cu m u lat ive Bl ood Lead Exp os u re Academic Year
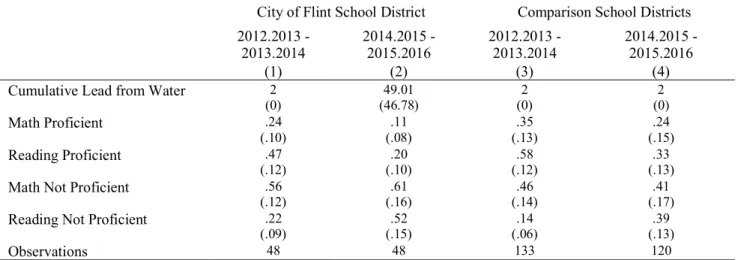
Table 1.1: Summary of Data for Flint and Comparison School Districts
City of Flint School District Comparison School Districts
2012.2013 -
2013.2014 2014.2015 - 2015.2016 2012.2013 - 2013.2014 2014.2015 - 2015.2016
(1) (2) (3) (4)
Cumulative Lead from Water 2
(0) 49.01 (46.78) 2 (0) 2 (0) Math Proficient .24 (.10) .11 (.08) .35 (.13) .24 (.15) Reading Proficient .47 (.12) (.10) .20 (.12) .58 (.13) .33
Math Not Proficient .56
(.12) (.16) .61 (.14) .46 (.17) .41
Reading Not Proficient .22
(.09) (.15) .52 (.06) .14 (.13) .39
Observations 48 48 133 120
A constant value of 2 micrograms of cumulative lead exposure is assumed for the 2012 and 2013 academic years and for the comparison schools. Standard deviations are presented in parentheses.
Table 1.2: Basic Regression Panel A: Proficient Shares
Math Proficient Reading Proficient
(1) (2) (3) (4) (5) (6) (7) (8) Lead Exposure -.0003 (.0009) (.0013) -.0018 (.0011) -.0011 -.0031* (.0016) Ln(Lead Exposure) -.0006 (.0100) -.0112 (.0144) -.0102 (.0117) -.0310* (.0169) School Linear
Time Trend No Yes No Yes No Yes No Yes
Observations 349 349 349 349 349 349 349 349
Groups 169 169 169 169 169 169 169 169
R-Squared .4614 .5633 .4612 .5608 .6447 .7107 .6442 .7099
Panel B: Not Proficient Shares
Math Not Proficient Reading Not Proficient
(1) (2) (3) (4) (5) (6) (7) (8) Lead Exposure .0019 (.0014) (.0018) .0020 (.0010) .0019* .0035** (.0017) Ln(Lead Exposure) .0186 (.0141) .0184 (.0178) .0170 (.0105) .0378** (.0170) School Linear
Time Trend No Yes No Yes No Yes No Yes
Observations 349 349 349 349 349 349 349 349
Groups 169 169 169 169 169 169 169 169
R-Squared .1297 .2844 .1289 .2835 .7284 .7992 .7270 .7993
These estimates are calculated using data for Flint Community Schools and a full set of control schools. The years of analysis cover academic year 2012-2013 through academic year 2015-2016. All estimates include fixed effects and year fixed effects. The standard errors are clustered at the school cohort level. Standard errors are in parentheses. The lead exposure variable and all outcome variables have been winsorized at the 5 and 95 percentiles. Significant at the 10% (*), 5%(**), 1%(***) levels.
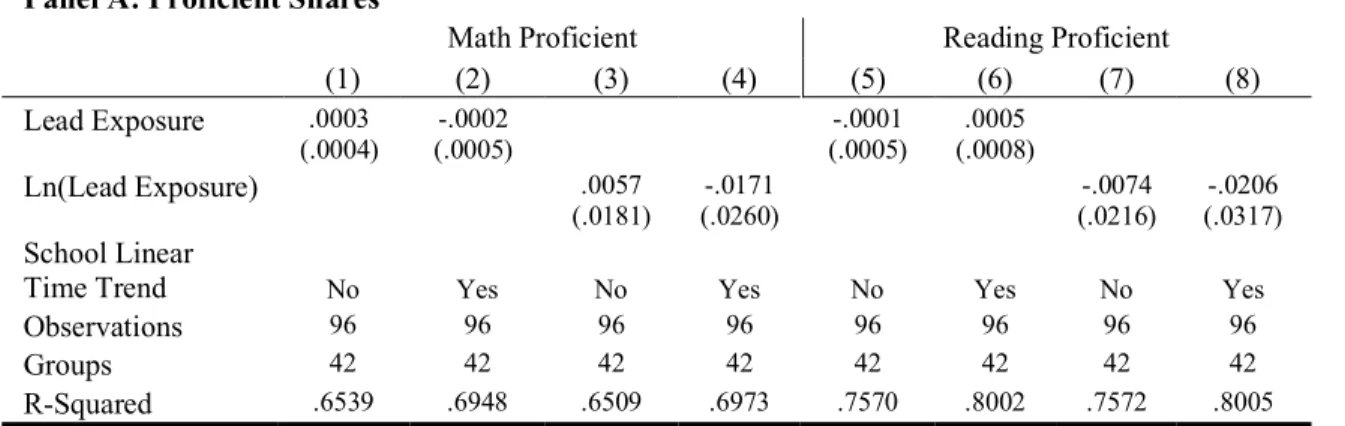
Table 1.3: Basic Regression within Flint Community Schools Panel A: Proficient Shares
Math Proficient Reading Proficient
(1) (2) (3) (4) (5) (6) (7) (8) Lead Exposure .0003 (.0004) (.0005) -.0002 (.0005) -.0001 (.0008) .0005 Ln(Lead Exposure) .0057 (.0181) -.0171 (.0260) -.0074 (.0216) -.0206 (.0317) School Linear
Time Trend No Yes No Yes No Yes No Yes
Observations 96 96 96 96 96 96 96 96
Groups 42 42 42 42 42 42 42 42
R-Squared .6539 .6948 .6509 .6973 .7570 .8002 .7572 .8005
Panel B: Not Proficient Shares
Math Not Proficient Reading Not Proficient
(1) (2) (3) (4) (5) (6) (7) (8) Lead Exposure -.0006 (.0004) (.0007) -.0003 (.0005) -.0003 (.0007) -.0001 Ln(Lead Exposure) -.0262 (.0274) -.0191 (.0432) .0033 (.0337) .0008 (.0368) School Linear
Time Trend No Yes No Yes No Yes No Yes
Observations 96 96 96 96 96 96 96 96
Groups 42 42 42 42 42 42 42 42
R-Squared .3183 .4287 .3179 .4304 .7296 .8146 .7283 .8145
These estimates are calculated using data for Flint Community Schools. The years of analysis cover academic year 2012-2013 through academic year 2015-2016. All estimates include fixed effects and year fixed effects. The standard errors are clustered at the school cohort level. Standard errors are in parentheses. The lead exposure variable and all outcome variables have been winsorized at the 5 and 95 percentiles. Significant at the 10% (*), 5%(**), 1%(***) levels.
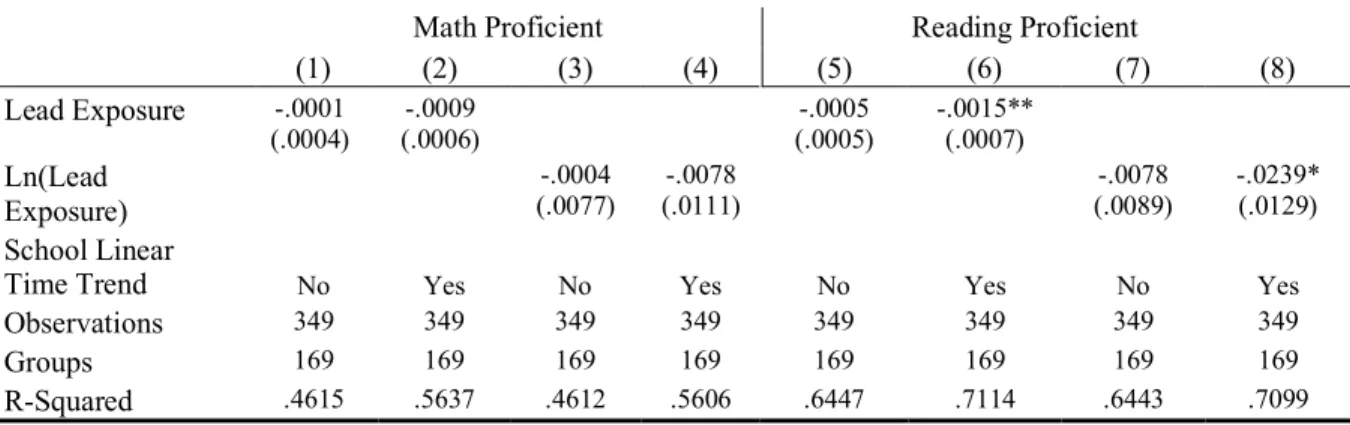
Table 1.4: Flint Community Schools with Linear Time Trends Panel A: Proficient Shares
Math Proficient Reading Proficient
(1) (2) (3) (4) (5) (6) (7) (8) Lead Exposure -.0004 (.0004) -.0013*** (.0004) -.0015*** (.0004) -.0028*** (.0009) Ln(Lead Exposure) -.0314*** (.0109) -.0409*** (.0100) -.0780*** (.0114) -.0903*** (.0136) School Linear
Time Trend No Yes No Yes No Yes No Yes
Observations 96 96 96 96 96 96 96 96
Groups 42 42 42 42 42 42 42 42
R-Squared .4686 .5560 .5305 .6093 .5183 .6237 .6772 .7588
Panel B: Not Proficient Shares
Math Not Proficient Reading Not Proficient
(1) (2) (3) (4) (5) (6) (7) (8) Lead Exposure -.0003 (.0004) (.0006) .0001 .0013*** (.0004) .0027*** (.0009) Ln(Lead Exposure) -.0009 (.0104) .0040 (.0127) .0864*** (.0130) .0974*** (.0154) School Linear
Time Trend No Yes No Yes No Yes No Yes
Observations 96 96 96 96 96 96 96 96
Groups 42 42 42 42 42 42 42 42
R-Squared .1775 .2941 .1741 .2947 .5160 .6470 .6606 .7679
These estimates are calculated using data for Flint Community Schools. The years of analysis cover academic year 2012-2013 through academic year 2015-2016. All estimates include fixed effects and year linear time trends. The standard errors are clustered at the school cohort level. Standard errors are in parentheses. The lead exposure variable and all outcome variables have been winsorized at the 5 and 95 percentiles. Significant at the 10% (*), 5%(**), 1%(***) levels.