TOWARDS UNDERSTANDING THE RELATIONSHIP BETWEEN GAME TYPE AND
NETWORK TRAFFIC FOR CLOUD GAMING
Mirko Suznjevic
1, Justus Beyer
2, Lea Skorin-Kapov
1, Sebastian Moller
2, Nikola Sorsa
11
University of Zagreb, Faculty of Electrical Engineering and Computing, Unska 3, Zagreb, Croatia
2Technische Universitat Berlin, Strasse des 17. Juni 135, Berlin, Germany
{
mirko.suznjevic, lea.skorin-kapov, nikola.sorsa
}
@fer.hr,
[email protected], [email protected]
ABSTRACT
Cloud based games have significantly larger network band-width requirements when compared with traditional online games (up to two orders of magnitude). Differences in trans-mission characteristics can be observed not only between various cloud gaming platforms, but also between different games played on the same platform. As the differences be-tween games on the same platform can be very high (up to several Mbit/s), we can witness significant impacts on game performance and consequently the end user Quality of Expe-rience. In this paper, we present a first step in the attempt to quantify this phenomenon through measurements of 18 games which differ in type, perspective, and input charac-teristics running on an open source cloud gaming platform - GamingAnywhere. We analyse gathered video samples and calculate the values of spatial and temporal video metrics de-fined in the literature. We identify the relation between two sets of video metrics and compare them with the network traf-fic characteristics, primarily bandwidth usage and packet rate. We also annotate and analyse the impact of user input and the context of the game on the application level.
Index Terms— cloud games, game genre, traffic analysis, video metrics, user behaviour
1. INTRODUCTION
Cloud gaming, or gaming on demand, is a type of online gam-ing that allows on-demand streamgam-ing of game content (usu-ally video and audio) onto non-specialized devices (e.g. PC, smart TV, etc.). One of the key benefits is that no download or game installation is required, given that the actual game is stored and executed on the game company’s server and only its output is streamed to the client. This fact also results in almost instant game access. Another benefit is that there are no constraints based on end devices’ hardware capabilities or operating systems, freeing developers of the need to develop multiple versions of the game, and enabling end users to play the game on almost any device.
While cloud gaming reduces client hardware require-ments and provides other benefits, most such games are traffic-intensive and may significantly increase the network requirements necessary to secure a good level of Quality of Experience (QoE) [1]. The network latency between the client and the cloud gaming server must be kept very low to maintain the real-time responsiveness of the game’s vir-tual world. Also, the traffic requirements of cloud games in comparison to standard games may increase by two orders of magnitude. For example, World of Warcraft, a popular Mas-sively Multiplayer Online Role-Playing Game (MMORPG), has a bandwidth requirement of approximately 55 kbps for the most complex in-game situations (with many players and Non-Player Characters (NPCs) participating) [2], while games from one of the cloud gaming platforms - OnLive can require up to 5.6 Mbps [3]. Originally, these downsides re-sulted in a weak market response to the first cloud gaming platforms, with one of the major companies in the business -OnLive going bankrupt and being sold to a new owner. Nev-ertheless, considering new market trends, new investment in OnLive, and the purchase of another cloud gaming company - Gaikai by Sony, it is clear that the cloud gaming paradigm is a promising direction for the gaming industry.
In previous research it has been shown that the network traffic generated by different cloud gaming platforms differs significantly (between 2 and 14 Mbit/s) [4]. Further, it has been established in several works [4, 5, 6] that different games offered by a cloud gaming provider have different network traffic characteristics (e.g. bandwidth requirements for On-Live have been proven to vary more than double [3]). Also, it has been established that the game type has an influence on the reported QoE under the same network conditions [7], as well as that the cloud gaming systems adapt their service according to the available bandwidth [6]. The research ques-tion remains how to establish the relaques-tion between the char-acteristics of the game played (game genre, input rate, graph-ics, etc.), network traffic characteristgraph-ics, and finally the end user QoE for cloud gaming? In this paper, our focus is on the network aspects of this relation, as securing sufficient
net-work capabilities is a prerequisite for enjoyable cloud gaming gameplay. Knowledge regarding this relation can be utilized in two directions: 1) bottom up approach - given certain net-work conditions, determine what is the achievable QoE for a chosen game (or game type), and 2) top down approach -given a specific game, determine what network characteris-tics are needed to achieve a satisfactory level of QoE.
The measurements and analysis presented in this paper are a first step towards answering the aforementioned ques-tions. While our focus is on traffic and video analysis, the re-sults will provide the basis for future studies targeted towards quantifying and modelling the relation towards QoE. The pa-per describes empirical measurements of 18 games differing in game genre, player’s perspective, and input dynamics. All measurements were conducted in a laboratory setting using an Open Source cloud gaming platform - GamingAnywhere, described in detail in [4, 8]. We captured generated network traffic, videos of the gameplay, and player input for each of the tested games for 10 minutes. We analysed the gameplay videos and extracted metrics which describe the spatial and temporal components of the recorded video. We further con-ducted traffic analysis in order to address possible relations between the characteristics of the video, input rate, and net-work traffic characteristics. Additionally, we shortly report on issues using the GamingAnywhere platform.
The remainder of the paper is organized as follows. A brief overview of related work is given in section 2. An overview of our measurement methodology is given in sec-tion 3, while results are presented in secsec-tion 4. A conclusion and outlook with regards to future studies is given in section 5.
2. RELATED WORK
While cloud gaming is a relatively recent paradigm for host-ing and deliverhost-ing games over the Internet, it has received a significant amount of attention from the research community in recent years. We shortly survey the literature focusing on those works which take into account the variations in cloud gaming systems caused by different games being streamed. The bulk of the network related research has focused on the interactivity constraint - i.e., the real-time requirements at-tributed to cloud games. The processing delay for the On-Live cloud gaming platform is assessed in [9] and estimated to 150 ms. The authors of [10] performed a delay comparison analysis of OnLive and StreamMyGame, and identified that OnLive implements a game genre-based differential resource provisioning strategy to provide sufficiently short latency for real-time gaming.
The quality of streamed online gaming over fixed WiMAX is evaluated in [11]. The conclusion is that the quality of streamed gaming is very sensitive to delays, and that the transmission latencies measured in a WiMAX net-work are near the edge of providing a smooth gaming
ex-perience. In fact, it has been noted that under heavy traf-fic loads, end user perceived gaming experience faces severe degradation. A QoE analysis conducted in a laboratory cloud gaming testbed involving three different games with differ-ent perspectives showed that fast-paced cloud-based games are more resilient to packet loss degradation and video qual-ity degradation, likely due to the player never really focusing on his/her rapidly changing environment [7]. From the set of tested parameters, the most important were found to be downstream packet loss, followed by downstream delay. A detailed electromyographic-based (EMG) QoE measurement study was done in order to assess which of the different types of games are more delay tolerant, and consequently cloud gaming friendly [12].
In [6], the authors analyse the traffic characteristics of three games of the OnLive cloud gaming platform under dif-ferent network parameter scenarios (capacity, latency, and packet loss), and further make comparisons with traffic ob-tained from YouTube and a Skype video call. They con-cluded that OnLive as a service is fundamentally different from Skype and YouTube (in terms of network performance metrics), and that OnLive adapts to changes in network con-ditions (i.e., delay or bandwidth). For example, Youtube uses TCP and claims as much as possible of the network capac-ity with characteristic “saw-like” bitrate curve, while OnLive and Skype have stable bitrate.
In [3] the authors analysed and compared the traffic char-acteristics of OnLive and Gaikai based on several different games. It was pointed out that both platforms generate traffic that is similar with respect to packet size distribution, while significant differences were found with respect to inter-arrival times. In subsequent studies, the authors in [5] performed a detailed analysis of the OnLive network protocol and mod-elled the traffic of two games showing the most extreme dif-ferences in the characteristics of the network traffic - Crazy Taxi and Four Elements.
3. METHODOLOGY
In this section we describe in detail the procedures performed in the measurement process and the methods used to analyse the gathered dataset.
3.1. Measurements
All measurements were performed at the laboratory facilities of the Technical University of Berlin. Figure 1 depicts the test setup, which involved a PC, with separate monitor, lap-top, Game Capture HD device, and an Etherbased net-work which was connected to the university’s Internet con-nection through a switch. We gathered the following data: original game video (gathered on the server), network traffic (gathered on the client), and player’s input (i.e. in terms of mouse and keyboard usage).
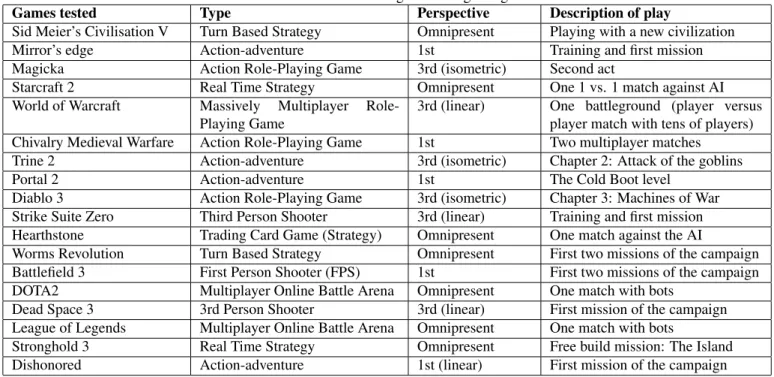
Table 1. Characteristics of tested games and gaming scenarios
Games tested Type Perspective Description of play
Sid Meier’s Civilisation V Turn Based Strategy Omnipresent Playing with a new civilization
Mirror’s edge Action-adventure 1st Training and first mission
Magicka Action Role-Playing Game 3rd (isometric) Second act
Starcraft 2 Real Time Strategy Omnipresent One 1 vs. 1 match against AI
World of Warcraft Massively Multiplayer Role-Playing Game
3rd (linear) One battleground (player versus player match with tens of players) Chivalry Medieval Warfare Action Role-Playing Game 1st Two multiplayer matches
Trine 2 Action-adventure 3rd (isometric) Chapter 2: Attack of the goblins
Portal 2 Action-adventure 1st The Cold Boot level
Diablo 3 Action Role-Playing Game 3rd (isometric) Chapter 3: Machines of War Strike Suite Zero Third Person Shooter 3rd (linear) Training and first mission Hearthstone Trading Card Game (Strategy) Omnipresent One match against the AI
Worms Revolution Turn Based Strategy Omnipresent First two missions of the campaign Battlefield 3 First Person Shooter (FPS) 1st First two missions of the campaign DOTA2 Multiplayer Online Battle Arena Omnipresent One match with bots
Dead Space 3 3rd Person Shooter 3rd (linear) First mission of the campaign
League of Legends Multiplayer Online Battle Arena Omnipresent One match with bots
Stronghold 3 Real Time Strategy Omnipresent Free build mission: The Island
Dishonored Action-adventure 1st (linear) First mission of the campaign
Fig. 1. Laboratory testbed
The laptop used was an Asus G55 with i7-3610QM pro-cessor, 4GBs of RAM, and Nvidia Geforce GTX 660M graphics card. All the games are played on the laptop. The software installed on the laptop included: GamingAnywhere (GA) client, Wireshark, and Game Capture HD (GCHD) soft-ware. GCHD is a product consisting of a hardware device and specialized software produced by the company Elgato. Its main purpose is capturing and publishing video recordings of gaming sessions. It supports both PC and console game video capture. GCHD hardware has two HDMI ports, one for the input signal, and the other for the output signal, and a USB
port through which the device is controlled by the computer on which the control software is installed (i.e., laptop in our testbed). GCHD creates MPEG4 video files with H.264 video compression as well as some additional information files and .TS video files.
The configuration of the PC used in the measurement setup was as follows: i3 2120 processor (2x 3.3 GHz), 4 GB of DDR3-1600 RAM, 1.5 TB hard disk, Nvidia Quadro FX 4800 graphics card. On the PC the following software was in-stalled: Windows 7, GamingAnywhere server, the Mousotron software for tracking mouse and keyboard usage, as well as all of the tested games and different systems for digital game distribution (i.e. Steam by Valve, Origin by Electronic Arts, and Battle.net beta client by Blizzard). Mousotron works by capturing the events fired by the Windows operating system and not directly on keyboard and mouse, so it was necessary to install it on the PC hosting the GamingAnywhere server and not the laptop hosting the GamingAnywhere client. The input parameters which Mousotron captures are: keystrokes, left, right, middle, and double mouse clicks, scrolls, cursor speed, and distance travelled by mouse.
Regarding the settings of the GA platform, we used rela-tive mouse positioning for the client input and periodic server mode for delivering the game video. The frame rate of the periodic mode was set to 60 frames per second. All games tested were played for around 10 minutes at a resolution of 1280x720 (HD), given that high-quality video has been de-fined as one of the requirements regarding cloud gaming [13]. It should be noted that the majority of games had to be run in Windowed mode (except Dishonored and Mirror’s Edge);
A summary of the tested games and their characteristics is given in Table 1. Tests were performed with 18 games be-longing to different game genres - role playing games, action games, shooters, multiplayer online battle arenas (MOBAs), MMOs, etc. We labelled the games which are from cross genres as belonging to the more dominant genre (e.g. Dis-honored as an action role-playing game was labelled as an ac-tion game). All games were played by an experienced player, and we further provide information regarding the actual game play performed during the playing session (e.g. whether mis-sions from the campaign were played, whether the player took part in multiplayer matches, etc.). This annotation was re-quired as some of the games have highly variable game play (e.g. MMORPGs), and also for the purpose of providing a more detailed analysis of the gathered dataset.
3.2. Analysis
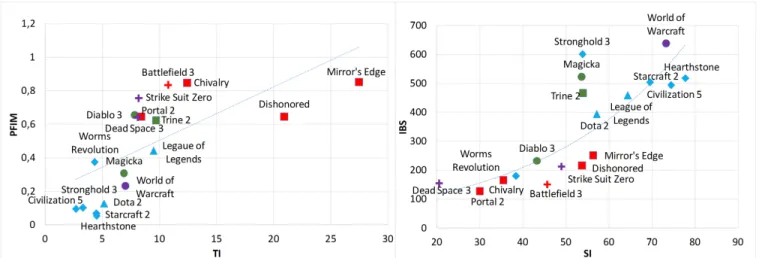
After having collected all video traces, we performed extrac-tion of the spatial and temporal video metrics. We extracted two sets of metrics, the first one according to ITU-T rec-ommendation P.910 (4/2008): Spatial perceptual information (SI) and Temporal perceptual information (TI) [14]. The sec-ond set of metrics identified to be usable for our use case included the Percentage of encoded macroblocks, i.e. the percentage of Forward/backward or Intra-coded Macroblocks (PFIM) for the temporal aspect of the video (motion in sub-sequent images), and Intra-coded Block Size (IBS) for the spatial aspect of video (scene complexity) as defined in [15].
SI is derived based on the Sobel filter. Each video frame (luminance plane) at timen(Fn) is first filtered with the So-bel filter [Sobel(Fn)]. The standard deviation over the pixels (stdspace) in each Sobel-filtered frame is then computed. This operation is repeated for each frame in the video sequence and results in a time series of spatial information of the scene. The maximum value in the time series (maxtime) is chosen to represent the spatial information content of the scene. This process can be represented in equation form as:
SI=maxtime{stdspace[Sobel(Fn)]} (1)
TI is based upon the motion difference feature, Mn(i, j), which is the difference between the pixel values (of the lu-minance plane) at the same location in space but at successive times or frames.Mn(i, j)as a function of time (n) is defined as:
Mn(i, j) =Fn(i, j)−Fn−1(i, j) (2) HereFn(i, j)is the pixel at theith row andjth column of nth frame in time. The measure of temporal information (TI) is computed as the maximum over time (maxtime) of the stan-dard deviation over space (stdspace) ofMn(i, j)over alliand
j.
T I =maxtime{stdspace[Mn(i, j)]} (3)
More motion in adjacent frames will result in higher values of TI. For scenes that contain scene cuts, two values may be given: one where the scene cut is included in the temporal information measure, and one where it is excluded from the measurement.
The logic behind PFIM and IBS metrics is as follows: A video with visual changes from frame to frame will have these changes encoded (either by neighbouring blocks or indepen-dently of other blocks), while video without visual changes can skip much of the encoding (PFIM) and if the scene is sim-ple, there is not much information to be encoded. As a result, the intra-coded block size will be small. If the scene is com-plicated, the IBS will be large to contain all the information. The extraction process for these metrics is a bit more compli-cated as they were designed for MPEG 1. We created several bash scripts to execute the needed actions. First we extract soundless .avi fragments from .mp4 files. The process relies on ffmpeg for conversion and sampling. The .avi files are sampled first so they could later be used in calculating TI and SI. The next step was to convert .avi fragments to .mpg frag-ments. Statistics were extracted from the new .mpg fragments using the Berkeley tool mpeg stat and the values of IBS and PFIM are calculated from collected data using python scripts created by Mark Claypool [15].
4. RESULTS
In this section we present the analysis of the gathered data. Our dataset is comprised of 13.8 GBs of video recordings, 4.83 GBs of network traffic traces, and input characteristics of all 18 tested games.
In Figure 2 we depict the scores of all 18 games in the form of a scatter plot portraying temporal and spatial met-rics. The results are extracted as an average of three video sequences extracted from the whole game play recorded with each sequence lasting 15s. It is easily seen that for temporal metrics (which correspond to how much the image changes across subsequent frames), action games and shooters have the highest values as was expected. For the majority of strat-egy games we found relatively low TI values (which was ex-pected as they are much less dynamic), while role-playing games maintain the middle of the data. For the spatial met-rics the situation is reversed, the highest scores correspond to strategy games and role-playing games, while action games and shooters are on the lower part of the scale.
In Figure 3 the average bandwidth used across games is reported for the full length of the capture (10 minutes). Fur-thermore, the graph includes results of a test in which only the monochromatic image was streamed to the client (idle) which showed that for such video under our settings 0.4 Mbit/s are needed with a packet rate of 208 pckt/s.
While the majority of games stayed in the range between 3 and 4 Mbit/s, there were several exceptions. As expected, strategy games have lower bandwidth usage. Stronghold has
Fig. 2. Scores for temporal and spatial video metrics of tested games
the lowest score with just 1.4 Mbit/s of average bandwidth usage. It should be noted that Stronghold 3 was the game which was very troublesome as it crashed the GamingAny-where platform several times during the measurements, espe-cially in case of scrolling around the map. The results for this game should be taken with this in mind as the testing player quickly adapted and started using clicking on the minimap for map navigation instead of scrolling. The system crashes are easily distinguishable in the traffic trace and the traffic char-acteristics reported for Stronghold have been extracted from a 1 minute long section of the whole network trace in which no crashes of the system occurred. Surprisingly, World of Warcraft was the game which had the highest bandwidth re-quirements. It should be noted that activity played in World of Warcraft was a player versus player activity which is the most dynamic activity in MMORPGs [2]. Another surprising finding is that there is no obvious relation between the scores on the video metrics and traffic characteristics. For example, Starcraft 2 and Civilisation 5 have very similar scores with respect to spatial and temporal metrics, while their bandwidth requirements are on opposite sides of the graph. We
hypoth-Fig. 3. Bandwidth usage of tested games
esized that some relations will be connected to the type of the game or the game’s perspective, but correlations of both of these game characteristics to required bandwidth are very low. Finally, we wanted to inspect the impact of player input characteristics on generated network traffic. We calculated action rate as a sum of all actions (all types of mouse clicks and keyboard presses) divided by the duration of the game session. We found no impact on the traffic volume, but only a slight increase of packet rate with action rate as depicted in Figure 4.
5. DISCUSSION AND FUTURE WORK
In this paper we have presented the results of measurement of cloud gaming video and generated network traffic for 18 games of various game types and perspectives in an effort to shed light on the relation between application level pa-rameters such as game genre, input characteristics, and
erated video characteristics and network level characteris-tics. We extracted video metrics and examined the relation between the traffic characteristics, video characteristics and player input. We identified significant discrepancies between the games which we could not explain by only taking into account evaluated factors. Therefore, in future work we aim to look into more detail into other factors such as graphics specifics of each game, video encoding, different settings of the cloud gaming platform, etc. Future work will also aim to address the relationships between the aforementioned met-rics and network performance with subjective user perceived game experience.
6. ACKNOWLEDGMENTS
This research has been done in scope of European COST ac-tion IC1003 - European Network on Quality of Experience in Multimedia Systems and Services (Qualinet). The research leading to these results has also received funding from the European Community Seventh Framework Programme under grant agreement no. 285939 (ACROSS).
7. REFERENCES
[1] S. M¨oller, Dennis Pommer, Justus Beyer, and Jannis Rake-Revelant, “Factors Influencing Gaming QoE: Lessons Learned from the Evaluation of Cloud Gam-ing Services,” inProceedings of the 4th International Workshop on Perceptual Quality of Systems (PQS 2013), Sept. 2013, pp. 1–5.
[2] Mirko Suznjevic, Ognjen Dobrijevic, and Maja Mati-jasevic, “MMORPG player actions: Network perfor-mance, session patterns and latency requirements anal-ysis,” Multimedia Tools and Applications, vol. 45, no. 1-3, pp. 191–241, 2009.
[3] Marc Manzano, Jose Alberto Hernandez, Manuel Urue˜na, and Eusebi Calle, “An empirical study of Cloud Gaming,” inProceedings of the 11th ACM/IEEE Annual Workshop on Network and Systems Support for Games, 2012.
[4] Chun-Ying Huang, Kuan-Ta Chen, De-Yu Chen, Hwai-Jsung Hsu, and Cheng-Hsin Hsu, “GamingAny-whereThe First Open Source Cloud Gaming System,” ACM Transactions on Multimedia Computing, Commu-nications and Applications, vol. 2, no. 3, pp. 1–26, 2010. [5] Marc Manzano, Manuel Uruena, Mirko Suznjevic, Eu-sebi Calle, Jose Alberto Hernandez, and Maja Matijase-vic, “Dissecting the Protocol and Network Traffic of the OnLive Cloud Gaming Platform,” 2014, p. 8.
[6] Mark Claypool, David Finkel, Alexander Grant, and Michael Solano, “Thin to Win? Network Performance
Analysis of the OnLive Thin Client Game System,” in Proceedings of the 11th ACM/IEEE Annual Workshop on Network and Systems Support for Games, 2012. [7] Michael Jarschel, Daniel Schlosser, Sven Scheuring,
and Tobias Hoßfeld, “An evaluation of QoE in cloud gaming based on subjective tests,” inInnovative Mobile and Internet Services in Ubiquitous Computing (IMIS), 2011 Fifth International Conference on. IEEE, 2011, pp. 330–335.
[8] Chun-Ying Huang, De-Yu Chen, Cheng-Hsin Hsu, and Kuan-Ta Chen, “GamingAnywhere: An Open-Source Cloud Gaming Testbed,” inProceedings of ACM Multi-media 2013 (Open Source Software Competition Track), Oct 2013.
[9] R. Shea, Jiangchuan Liu, E. C. H. Ngai, and Yong Cui, “Cloud gaming: architecture and performance,” IEEE Network, vol. 27, no. 4, 2013.
[10] Kuan-Ta Chen, Yu-Chun Chang, Po-Han Tseng, Chun-Ying Huang, and Chin-Laung Lei, “Measuring the la-tency of cloud gaming systems,” inProceedings of ACM Multimedia, Nov 2011.
[11] Esa Piri, Matti Hirvonen, and Jukka-Pekka Laulajainen, “Empirical Evaluation of Streamed Online Gaming over WiMAX,” inTestbeds and Research Infrastructure. De-velopment of Networks and Communities, pp. 255–270. Springer, 2012.
[12] Yeng-Ting Lee, Kuan-Ta Chen, Han-I Su, and Chin-Laung Lei, “Are All Games Equally Cloud-gaming-friendly?: An Electromyographic Approach,” in Pro-ceedings of the 11th Annual Workshop on Network and Systems Support for Games, Piscataway, NJ, USA, 2012, NetGames ’12, pp. 3:1–3:6, IEEE Press.
[13] S.S. Kim, K.I. Kim, and J. Won, “Multi-view Render-ing Approach for Cloud-based GamRender-ing Services,” in Proceedings of the 3rd International Conference on Ad-vances in Future Internet, 2011, p. 102107.
[14] P.910 ITU-T Recommendation, “Subjective video qual-ity assessment methods for multimedia applications,” 1999.
[15] Mark Claypool, “Motion and scene complexity for streaming video games,” inProceedings of the 4th Inter-national Conference on Foundations of Digital Games. ACM, 2009, pp. 34–41.