ISSN 1607148-4
9 7 7 1 6 0 7 1 4 8 0 0 6
O C C A S I O N A L PA P E R S E R I E S
N O 5 5 / M A R C H 2 0 0 7
GLOBALISATION AND
EURO AREA TRADE
INTERACTIONS AND
CHALLENGES
by Ursel Baumann
and Filippo di Mauro
O C C A S I O N A L PA P E R S E R I E S
N O 5 5 / M A R C H 2 0 0 7
This paper can be downloaded without charge from http://www.ecb.int or from the Social Science Research Network electronic library at http://ssrn.com/abstract_id=923379.
GLOBALISATION AND
EURO AREA TRADE
INTERACTIONS AND
CHALLENGES
by Ursel Baumann
and Filippo di Mauro
In 2007 all ECB publications feature a motif taken from the €20 banknote.
© European Central Bank, 2007 Address Kaiserstrasse 29 60311 Frankfurt am Main Germany Postal address Postfach 16 03 19 60066 Frankfurt am Main Germany Telephone +49 69 1344 0 Website http://www.ecb.int Fax +49 69 1344 6000 Telex 411 144 ecb d
All rights reserved. Any reproduction, publication or reprint in the form of a different publication, whether printed or produced electronically, in whole or in part, is permitted only with the explicit written authorisation of the ECB or the author(s).
The views expressed in this paper do not necessarily reflect those of the European Central Bank.
ISSN 1607-1484 (print) ISSN 1725-6534 (online)
CONTENTS
C O N T E N T S ABSTRACT 4
INTRODUCTION AND SUMMARY OF THE
MAIN CONCLUSIONS 5
1 GLOBALISATION AND TRADE:
THE CONCEPTUAL FRAMEWORK 7
1.1 Recent trends 7
1.2 Conceptual framework 8
1.3 How do we measure adjustments in euro area trade in a globalised
world? 10
2 DEVELOPMENTS IN EURO AREA EXPORTS 12
2.1 Structural versus cyclical changes
in global trade patterns 12
2.2 Recent developments in export
specialisation 15
2.2.1 The dataset 15
2.2.2 Comparative advantage
and factor intensity 16
2.2.3 Specialisation by sector according to technology
content 20
2.2.4 Export specialisation and
productivity growth 25
2.3 Euro area exports – summary 29 3 SPECIALISATION AND IMPORTS OF
INTERMEDIATES 30
3.1 Motivation 30
3.2 General trends in import
penetration 31
3.3 Imports of intermediate goods 34
3.4 Does the trade specialisation change when imports are netted
out of exports? 38
3.5 Intermediate imports and value
added 40
4 CONCLUSIONS 41
ANNEX A
DATA CLASSIFICATIONS 43
ANNEX B
DEFINITIONS OF INTERNATIONAL SOURCING 45 ANNEX C
DEFINITION OF THE LAFAY INDEX 47
REFERENCES 48 EUROPEAN CENTRAL BANK
ABSTRACT
As a major player in world trade, the euro area is strongly influenced by globalisation, but is far from being a passive spectator. The paper analyses how the euro area’s trade specialization has changed in response to stronger international competition and the emergence of new global players, evaluating results and possible challenges ahead. The message remains mixed. On the positive side, the export specialisation of the euro area is increasing in some medium-high or medium-high-tech sectors where productivity growth is strong and demand robust, such as pharmaceuticals, also by a more intensive recourse to importing intermediate goods from low-cost countries. On the other hand, in comparison to other industrialised economies, the euro area has been somewhat slower in moving towards research-intensive goods and away from labour-intensive sectors. While this could reflect data classification issues, it may also be a sign of structural rigidities in the euro area, which hinder adjustment processes.
INTRODUCTION AND SUMMARY OF THE MAIN CONCLUSIONS1
Globalisation is not a new phenomenon, but there is growing consensus that its impact is fundamentally changing world patterns of production and trade. For the euro area,2 a very
open economic area with a strong manufacturing orientation, such developments obviously have a critical relevance. What aspects of globalisation are the most important for the euro area as a major player in world trade? What are the main channels through which the globalisation process is exerting its effects? How is the euro area adjusting to this, overall? These are the main issues we aim to address in this paper. Recent changes in euro area trade are analysed against the background of comparative advantages as well as in comparison with other large economies. The ultimate objective is to assess how the euro area’s trade patterns have changed in response to stronger competition and to other recent changes in the economic environment, drawing conclusions on the possible direction that further adjustments may take (and paying due attention to classification issues related to the indicators used).
Section 1 discusses predictions based on trade theories as to the trade effects of globalisation and provides the conceptual framework. It also lays out the set of complementary trade indicators that we consider to analyse recent changes in euro area trade. Section II looks at the euro area’s export performance at the aggregate and sectoral level. It aims to determine where the euro area’s specialisation lies and how this has changed in recent years. The analysis assesses factor and technology intensity of exports, looks at how dynamic destination markets are and establishes a connection between trade and sectoral productivity. Section III looks at euro area import penetration; a special emphasis is given to intermediate imports, used as a proxy for the increasing fragmentation of production across countries. The intermediate imports data are then used to create alternative measures of sectoral specialisation net of imports. Changes in
intermediate imports are also related to sectoral value added shares in order to tentatively assess whether the location abroad of some production stages is consistent with an increase in value added across sectors as available resources are used more effectively. Finally, Section IV summarises the main findings of the paper and discusses the outlook for euro area trade in the light of an increasingly integrated and globally competitive external environment.
The main result of the paper is that substantial adjustments have been taking place in euro area trade, which could reflect globalisation among other things. In particular, on the positive side, (i) the export specialisation of the euro area is increasing in some medium-high or high-tech sectors where productivity growth is strong and demand robust, such as pharmaceuticals, while declining in lower-tech sectors, such as textiles and (ii) the euro area appears to increasingly import intermediate goods from low-cost countries, in order to lower production costs and perhaps to focus on the higher value-added stages of the production chain.
Nevertheless, there are also signs that further adjustments may still be needed. The f irst is that the euro area still has a higher specialisation in relative terms than other major industrialised countries – including the United States, the United Kingdom and Japan – in predominantly labour-intensive categories of goods. Moreover, despite the closer integration of emerging markets’ labour pools into the world economy, the euro area has not become less specialised in exporting labour-intensive goods, even when accounting for intermediate imports. While this could reflect the predominant use of relatively highly-skilled labour or an effective
1 We are grateful for the contributions from D. Taglioni (Sections I and III), C. Hornok (Boxes 4 and 5) and K. Benkovskis (Section II.1). Excellent research assistance was provided by N. Queiros de Faria and R. Pereira. Moreover, the paper draws on some previous internal work by S. Cabral and M. Bussière and has greatly benefited from comments by R. Anderton, H. J. Klöckers, D. Taglioni and by an anonymous internal referee.
2 Throughout the entire paper we refer to the euro area excluding Slovenia due to the period covered by the analysis, which ends before the adoption of the euro by this country.
AND SUMMARY OF THE MAIN CONCLUSIONS
use by multinational companies of labour supplied abroad, it may also be a sign of relatively protected product and labour markets, which could have sheltered the manufacturing sectors from competitive pressures, thus delaying adjustment processes. In comparison with the euro area, the United States appears to be moving more decisively towards research-intensive products, while retreating from labour-intensive and raw materials-intensive products. Second, there is evidence that the euro area is losing ground in one of its traditionally strong sectors – machinery and equipment – since higher intermediate imports are associated with stagnant exports, which could be a sign of deindustrialisation in this field. This is corroborated by the strong rise in imports of capital goods (particularly machinery and transport equipment) from the new EU Member States,3 which appears to be in part
displacing intra-euro area imports.
3 Throughout the entire paper we refer to the new EU Member States excluding Bulgaria and Romania as the analysis was undertaken while these countries were not yet members of the EU.
1 GLOBALISATION AND TRADE: THE CONCEPTUAL FRAMEWORK
1.1 RECENT TRENDS
Globalisation is a catchword for the growing interdependence of economies via an increase in cross-border transactions in goods and services, natural resources, capital and labour. In the past decade the process of globalisation has accelerated as the use of ever more sophisticated information and communication technology has grown exponentially, while a breakthrough in connectivity, partly via the internet, has reduced the costs of transporting goods and information across the globe.4
This technological empowerment across the world has been accompanied by a strong rise in foreign direct investment (FDI) (see Chart 1). This has led to new ways of doing business: production processes have become increasingly internationalised as companies have established aff iliates abroad to gain access to foreign markets and reduce input costs, while supply-chains have been set up on a global scale as a way of gaining a competitive edge.
Globalisation has also allowed emerging countries to enter and compete in world markets.
The growing integration into world trade of emerging Asia, as well as that of central and eastern European countries (CEECs) following the collapse of the Soviet Union (see Chart 2), has led to a sharpening in the competitive environment and to large changes in the structure of global trade.
Over time, globalisation means that national boundaries for goods, services and production factors are becoming less important in economic terms. This, in turn, implies that overall welfare gains are being realised as the world’s scarce resources are reallocated into the most productive activities across the world. For the euro area – a large and relatively open economy – the benefits are likely to be significant, since closer trade integration worldwide, by leading to higher world trade, will increase demand for euro area goods. Moreover – all else being equal – stronger international competition should bring about lower costs for f irms and lower prices of traded goods for consumers in the euro area, increase the availability of new product varieties, induce technology and knowledge transfers, as well as increase
4 For a more detailed description of how the current era of globalisation is different from previous such eras, see for instance Bourguignon et al (2002) or Bernanke (2006).
Chart 2 Integration of China and the CEECs into world trade
(Exports+imports by country/region divided by world exports+imports, in percentages)
Sources: CHELEM and ECB calculations.
Note: Trade flows are in values and include only goods.
China CEECs 1993 2004 1993 2004 0.0 1.0 2.0 3.0 4.0 5.0 6.0 7.0 8.0 9.0 0.0 1.0 2.0 3.0 4.0 5.0 6.0 7.0 8.0 9.0
Chart 1 World imports and the global stock of inward and outward FDI as a proportion of world GDP
(percentages of GDP)
Source: United Nations Conference on Trade and Development, World Investment Reports 2005 and 2006.
inward FDI outward FDI world imports 0 5 10 15 20 25 30 0 5 10 15 20 25 30 1990 2000 2004 AND TRADE: THE CONCEPTUAL FRAMEWORK
productivity and economic growth. These benef its notwithstanding, market forces will trigger large changes in the structure of trade and the economy in line with comparative advantages, thus altering the relative returns on capital and labour.5
1.2 CONCEPTUAL FRAMEWORK
What can trade theory tell us about the likely direction of adjustments in trade patterns following the structural shift induced by globalisation? The world of today consists of very complex trade relationships between a growing number of countries and it is characterised by an increasing number of goods, services and production tasks, which altogether, simple models of trade cannot fully capture. Nevertheless, such models are still informative and provide important yet – given the different assumptions on which they are based – different predictions as to how globalisation will affect world trade structures. A brief summary is provided below.
To start with, traditional trade theories that assume perfectly competitive markets and are aimed at explaining inter-industry trade – see
Ohlin (1933) and Ricardo (1963) or Krugman and Obstfeld (2003) for a summary – suggest that countries engage in trade according to their comparative advantages. These are determined by the relative availability of factors of production as well as differences in productivity.
Chart 3 Physical capital/labour ratios across countries
(Index, US = 100, 1999)
Sources: World Bank (Sandeep Mahajan (PRMEP) 2002) and ECB calculations.
Note: “Other e. Asia” stands for ”other emerging Asia”. For the definition of country groups see Table A1 in Annex A. Prices and exchange rates are for 1987.
0 20 40 60 80 100 120 140 160 0 20 40 60 80 100 120 140 160 United Kingdom United States Other e. Asia China euro area Japan
5 See for instance Bernanke (2006).
Table 1 R&D intensity
(percentages of GDP, 2003)
Sources: OECD Science, Technology and Industry Scoreboard 2005, except EU25 and euro area (Eurostat, structural indicators database).
1) Gross domestic expenditure on R&D as a percentage of GDP. R&D intensity1) EU25 1.9 euro area 1.9 France 2.2 Germany 2.6 Italy (2002) 1.2 United Kingdom 1.9 United States 2.6 Japan 3.2 Czech Republic 1.3 Hungary 1.0 Poland 0.6 Slovakia 0.6 China 1.3
Chart 4 Physical capital/labour ratios for
the world1 before and after trade
integration
(Index: world before trade integration = 100; 1999)
Sources: World Bank (Sandeep Mahajan (PRMEP) 2002) and ECB calculations.
Note: Prices and exchange rates for 1987.
1) World before trade integration is proxied by the United States, the United Kingdom, the euro area and Japan. The world after trade integration additionally includes China, other emerging Asia and Hungary.
0 20 40 60 80 100 0 20 40 60 80 100 World after trade integration World before trade integration
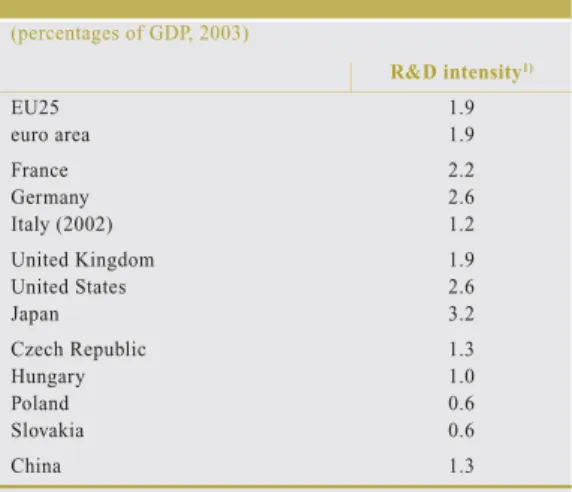
A country would thus optimally specialise in the production of those products that use the abundant productive resources more intensively. Despite notorious diff iculties in actually measuring factor endowments, available evidence confirms that capital/labour ratios are much lower in emerging, low-wage economies than in developed, high-income countries, particularly Japan and the United States (see Chart 3). Differences in the intensity of research and development (R&D) are also large across countries, with intensity relatively high in Japan and the United States, somewhat lower in the euro area and significantly lower in China and some of the CEECs (see Table 1). This would support the idea that, a priori, developed economies have a comparative advantage in the production and export of capital-intensive and research-intensive goods, whereas the comparative advantage of emerging economies is more likely to lie in the production and export of labour-intensive goods.
These traditional trade theories and the trade patterns that follow from them suggest that the integration of new players – such as China, the CEECs and India – into world trade leads to a further sharpening of these comparative advantages across countries. Chart 4 illustrates the reason for this. An initial situation without the fast-growing emerging countries is assumed and the world capital/labour ratio is indexed to 100.6 When these new players are integrated,
the capital/labour ratio of the world drops to around a third of its starting level, since these countries are heavily labour-abundant. This would mean strong market pressure for developed economies to shift their production and export structures towards more capital-intensive goods.
Other trade theories, however, lead to different conclusions about the impact of globalisation on trade. The new trade theories (developed mainly to explain the existence of extensive intra-industry trade among developed economies) replace the assumption of perfect competition on product markets with the one of monopolistic competition, and introduce
product differentiation, scale economies and utility functions including preference for variety.7 These theories describe well the
existence of intra-industry trade flows between trade partners with similar factor intensities and comparative advantages. Hence they are consistent with the view that more open global markets would ultimately lead to a fall in cross-country industrial specialisation. This clearly holds provided that openness leads to a convergence of international factor intensities and incomes – as assumed by standard trade and growth theories.8
The literature on the new economic geography, by contrast, suggests that industrial activities concentrate in certain countries or regions, determined by the availability of skilled labour pools, specialised suppliers and knowledge externalities.9 In these theories, specialisation
across countries is thus motivated not only by factor proportions but also by externalities and spillovers that lead to self-reinforcing equilibria in agglomerated industry clusters.10 Predictions
of trade flows arising from the theory of economic geography are, however, ambiguous, since they mostly depend on historical “accidents”. Furthermore, agglomeration also creates congestion costs, offsetting some of the positive effects.
Recent evidence (Schott, 2004; Fontagné et al., 2006) suggests that capital and skill-intensive countries use their endowment advantage over low-wage countries to produce “vertically superior” varieties of a good. These are varieties 6 Capital-labour ratios are estimated for two sets of country groups: the first (defined as “world prior to trade integration”) includes the United States, the United Kingdom, the euro area and Japan, and the second (def ined as “world after trade integration”) additionally includes China, the “other emerging Asia” countries and Hungary. The ratios are calculated using World Bank data from Sandeep Mahajan (PRMEP, 2002). 7 An example is the Spence-Dixit-Stiglitz utility function, see
Dixit and Stiglitz (1977) and Spence (1976).
8 See for instance Helpman and Krugman (1985) and Kierzkowski (1984).
9 See for instance Krugman (1991), Fujita et al (1999) and Porter (1990).
10 The theories of trade and economic geography seem to be relevant in explaining some of the specialisations in industries across euro area countries, see Box 3.
AND TRADE: THE CONCEPTUAL FRAMEWORK
that are relatively capital or skill-intensive and possess added features or higher quality, thereby leading to high value added return by commanding high prices. This evidence would suggest that conventional tests of trade theory using industry-level data are problematic because much of the endowment-driven specialisation might still take place, but at a level that was – until recently – hidden to the researcher. It would partly explain why developed economies – and most notably the euro area – continue to produce and export in industries, such as apparel and textiles, which are commonly associated with developing countries, and why they do so even in those instances where protection and market segmentation do not fully motivate the choice of foreign consumers to pay a premium for the higher priced labour-intensive goods produced there.
In an attempt to solve some of the puzzles of recent trends in international trade, Grossman and Rossi-Hansberg (2006) focus their analysis on a growing feature of globalisation – the increasing fragmentation of production across countries. Their models have two main implications. First, while specialisation may still be in line with factor endowments, it will apply not only to f inal goods but also to individual production tasks. For example, regardless of the nature of the f inal product, labour-intensive tasks or stages of the production process will tend to be relocated to labour-abundant countries. Developed economies will be more likely instead to focus on the upper stages of the value chain (e.g. research, development, planning and design, the production of skill and technology-intensive parts and the marketing of products). The second implication is that, because of the critical role of multinational companies in the global economy, the concepts of national boundaries and geographical specialisation across countries is becoming less meaningful. As multinational companies take advantage of differences in endowments, factor costs, skills and technology across countries, emerging economies can through them gain easy access
to otherwise unavailable technologies. As a result, emerging economies could experience large increases in productivity as they quickly move up the technological ladder, possibly leading to a specialisation in high-tech (f inal or intermediate) goods. Similarly, industrialised economies, by making use of the abundant labour in developing countries via production or task off-shoring, may ultimately increase their specialisation in labour-intensive products while reducing the domestic labour devoted to it.
The main conclusion of the above discussion is that even theoretically, there is no single benchmark against which to assess the way global trade patterns will move in the light of globalisation pressures. This is because a number of forces tend to pull in different directions than a simple comparative advantage model would have predicted. As the overall results of these forces are indeterminate, and theory on the issue is still nascent, the question of the direction in which trade patterns are changing, which is the focus of the rest of this paper, is essentially an empirical one. A corollary to this discussion is that changes in market shares and in countries’ trade specialisations might not be a clear and fully satisfactory signal of the underlying national competitiveness.
1.3 HOW DO WE MEASURE ADJUSTMENTS IN EURO AREA TRADE IN A GLOBALISED WORLD?
In line with the above discussion, traditional indicators of trade performance used by the applied trade literature need to be cautiously interpreted in the light of trade globalisation. The overriding reason for this is that globalisation triggers substantial structural changes in production and trade specialisation, which may either not be captured by standard indicators or make their interpretation difficult. A loss in export market share, for instance, might well be expected if new trade players are entering the f ield. And, more generally, there may even be circumstances in which such a loss
can actually be seen as a positive development, as it could in fact allow developed economies to reorient their production and exports towards goods with higher value added content. Trade theory would suggest that, ultimately, any change in the structure of euro area trade should be evaluated against the long-term welfare gains that it provides, thus whether it leads to an increase in current and future per capita income, wealth and productivity. Since, however, a satisfactory measure of welfare is diff icult to attain in practice, the strategy we adopt here is to rely on a set of indicators – rather than on a single measure – to assess the extent and nature of aggregate structural changes that are taking place now and are likely in the future. We are interested in gauging the direction in which the euro area is adjusting to the competitive challenges posed by the changes in world demand and relative prices caused by the emergence of new global players and to other changes in the economy. Moreover, we analyse how quickly these adjustments are taking place, as a quick adjustment would minimise the losses that occur in the transition period as a result of resources being locked into inefficient uses.
We will use f ive main indicators. The f irst indicator is the realised specialisation of exports by factor intensity, which we employ with the aim of verifying whether changes in trade specialisation are in line with notional comparative advantages. While indicators of specialisation are largely ex post measures of trade performance, reflecting past decisions by f irms regarding the sectoral/geographical markets on which to focus, changes over time in these measures can give some indication as to how the euro area export sector has readjusted in recent years in comparison with other economies.
Second, we look at how the trade specialisation across countries compares with the composition and dynamics of world import demand. Is the euro area specialising in sectors which are the world’s most dynamic and/or least volatile? Is
there evidence that emerging markets are becoming stronger competitors in the most dynamic sectors of world demand, leading to potentially lower prof it margins in those sectors?
The third indicator we use is sectoral productivity. In the long run, exports are likely to increase in the sectors where productivity is highest, as the most eff icient producers tend to participate in highly competitive export markets. Against this background, we also look at whether strong and rising trade specialisations are paralleled by high sectoral productivity growth across sectors and relative to other developed economies.
The fourth set of indicators addresses the issue of international production sharing and focuses on export indicators, net of imports. While our approach is similar to the standard Lafay index11
(an indicator of revealed comparative advantage that nets out imports from exports at the sectoral level), we focus on intermediate imports, which are likely to better capture – although this is not free from caveats – international production sharing for a particular good. The comparison of trade specialisation based solely on exports with that based on exports net of intermediate imports sheds light on some aspects of international production sharing, including its impact on trade structures across countries. Finally, we look at whether, across sectors, increased sourcing of intermediate inputs from low-wage countries is associated with increasing value added. While a more rigorous econometric analysis would be required to obtain solid conclusions, we provide some tentative evidence on whether changes in the sourcing of inputs is allowing euro area firms to concentrate on stages of the production chain where value added is higher.
11 See Lafay (1992). The standard Lafay index is often used in the applied trade literature, see European Commission (2005), and Felettigh et al. (2006).
AND TRADE: THE CONCEPTUAL FRAMEWORK
2 DEVELOPMENTS IN EURO AREA EXPORTS 2.1 STRUCTURAL VERSUS CYCLICAL CHANGES IN
GLOBAL TRADE PATTERNS
The extent to which export developments are affected by structural factors such as globalisation is evident from basic broad indicators of trade performance, i.e. export market shares and export price competitiveness (Charts 5 and 6). Two features stand out. First, as expected, against the background of new low-income global trade players entering the f ield, export market shares of the incumbent countries have fallen in recent years, while that of China, for instance, has dramatically increased (Chart 5).
For the euro area – and the United Kingdom – this loss has been relatively contained and mostly concentrated in the last few years in conjunction with the appreciation of the euro. In contrast, the United States and Japan experienced a sharp loss in market share between 1998 and 2002-03. More recently, Japan’s market share has recovered and that of the United States stabilised, which could suggest that the structural adjustment to global trade integration is taking place across countries and regions at different points in time and over different horizons.
A second feature, strongly related to the previous point, is that diverging trends in export market shares are hardly in line with movements in relative export prices,12 except for the euro
area (for a discussion of export market shares and export price competitiveness across individual euro area countries, see Box 1). Chart 6 shows developed economies’ export market shares in relation to export price competitiveness, def ined as the export prices of a country’s competitors over the prices of the country’s own exports (an increase in the index therefore signals an improvement in competitiveness). The most striking developments occurred in Japan, which suffered considerable export market share losses in spite of strong gains in price competitiveness. This
reflects a shift of part of Japan’s production facilities abroad, which has meant the use of neighbouring countries as export platforms.13
In the United States, the improvement in price competitiveness since 2002 has led only to some stabilisation in the export market share, while in the United Kingdom, relative export prices have improved since 2000, but the export market share continued to decrease until early 2005.
Chart 5 Export market shares
(in volumes; index: 1994 = 100; annual data)
Sources: IMF, Eurostat and ECB calculations. Note: Last observation refers to December 2005.
euro area United Kingdom United States Japan
China (right-hand scale)
65 70 75 80 85 90 95 100 105 110 115 1994 1996 1998 2000 2002 2004 50 100 150 200 250 300 350 400
12 In this paper, we focus on relative export prices as a measure of price competitiveness, although there are many others, each having their own merits. More discussion on the relationship between changes in the nominal euro effective exchange rate and relative export prices as well as other measures of price competitiveness can be found in a previous Occasional Paper (see MPC Task force of ESCB (2005)).
13 See Abe (2003) for more detail on Japan’s trade response to the increasing competition from China. Moreover, OECD (2002) finds a large increase in Japanese intra-firm trade with the rest of Asia and other countries over the 1990s.
Box 1
EXPORT MARKET SHARES AND EXPORT PRICE COMPETITIVENESS OF EURO AREA COUNTRIES
This box looks at export market shares in relation to their main determinant, price competitiveness, for the individual euro area countries.1 For the euro area in aggregate, we had
found that the export market share was relatively stable between 1994 and 2002, while some market share losses occurred thereafter. This is the result of a relatively diverse performance across euro area countries (Chart A). While Italy has experienced significant losses since 1995, as – to a lesser extent – has France, most other countries have held broadly stable export market shares or even increased them (particularly Ireland and Germany).
Chart 6 Export price competitiveness and export market shares (Index 1999 Q1 = 100)
Sources: Eurostat external trade statistics and national accounts, and ECB.
Note: Relative export prices equal a weighted average of competitor export prices divided by domestic export prices (an increase
reflects a gain in price competitiveness). The real export market share is derived as the volume of exports divided by a weighted average of import volumes for major trading partners. Foreign demand and competitors’ export prices are computed by the ECB.
export market share relative export price
euro area 80 85 90 95 100 105 110 115 120 80 85 90 95 100 105 110 115 120 1994 1996 1998 2000 2002 2004
export market share relative export price
United Kingdom 80 85 90 95 100 105 110 115 120 80 85 90 95 100 105 110 115 120 1994 1996 1998 2000 2002 2004
export market share relative export price
United States 80 85 90 95 100 105 110 115 120 80 85 90 95 100 105 110 115 120 1994 1996 1998 2000 2002 2004
export market share relative export price
Japan 1994 1996 1998 2000 2002 2004 75 80 85 90 95 100 105 110 115 120 75 80 85 90 95 100 105 110 115 120
1 This Box draws on ECB (2006), in which the competitiveness and export performance of the euro area and of individual euro area countries is discussed in more detail.
IN EURO AREA EXPORTS
Against this background, one tentative way of assessing how much of the loss in euro area export market share may have been a consequence of China having recently become a new major player in world trade is to simply subtract world imports from China from the euro area foreign demand indicator.14 Chart 7
shows that this does not change the dynamics of the euro area export market share before 1999,
as China’s trade growth was similar to growth in world trade in this period.
However, between 1999 and 2006, which corresponds to the period of rapid expansion of China’s share in world trade, the euro area’s market share loss is signif icantly smaller Chart B shows the relationship between export market shares and price competitiveness (measured here as relative export prices) across euro area countries. Differing movments in price competitiveness across euro area countries need to materialise through changes in actual costs and prices, as adjustments in nominal exchange rates are no longer possible within the euro area.2 Focusing on the
period since 1998, there appears to be a positive correlation between relative export prices and export market shares at the euro area country level. It appears that the export performance of Ireland has been relatively favourable given developments in relative export prices, whereas export market shares in France, Finland and Portugal have been lower than perhaps suggested by price developments, as price competitiveness has improved, but market shares have fallen nevertheless. Italy’s large loss in export market share seems to be closely related to the substantial fall in its export price competitiveness. Overall, the correlation between changes in export market share and relative export prices is not particularly strong, however, suggesting that other determinants, such as non-price competitiveness, the different sectoral specialisation across countries and the different ways of adjusting to globalisation also influence export market shares at the country level.
2 See ECB (2005) for a comprehensive discussion of inflation differentials within the euro area.
14 All calculations are made in constant prices from 2000.
Chart A Export market shares, selected euro area countries
(index: 1998 = 100; quarterly data; seasonally adjusted)
Sources: Eurostat national accounts and ECB calculations Note: Last observation refers to the fourth quarter of 2005.
Chart B Price competitiveness and export market shares across euro area countries (annual percentage changes)
Note: The data show average annual rates of change for the period 1998-2005. Price competitiveness is proxied by relative export prices corresponding to country export prices divided by competitors export prices. An increase in relative export prices implies a fall in competitiveness.
60 70 80 90 100 110 120 130 140 60 70 80 90 100 110 120 130 140 1995 Germany Italy Spain Netherlands France Ireland 1997 1999 2001 2003 2005 NL PT FR BE IT ES AT DE IE FI -6 -5 -4 -3 -2 -1 0 1 2 3 -6 -5 -4 -3 -2 -1 0 1 2 3 -4 -3
x-axis: change in relative export prices y-axis: change in export market shares
-2 -1 0 1 2 3 4 GR
if China is excluded. This indicates that the trade integration of China associated with globalisation may have been a prominent reason for the fall in the euro area export market share beyond export price competitiveness effects.
2.2 RECENT DEVELOPMENTS IN EXPORT SPECIALISATION
2.2.1 THE DATASET
The previous section has shown that structural factors, which could be associated with globalisation, seem to have exerted an influence on global trade. To further evaluate recent changes in the structure of euro area exports, we need to look at trends in sectoral specialisation. The aim is to compare these findings with respect to the trends expected on the basis of the standard comparative advantage framework outlined in Section 1, as well as with trends for major competitors. To do so, we use the CHELEM database of the Centre d’Etudes Prospectives et d’Informations Internationales (CEPII), which reports information on bilateral trade flows across countries for goods in value terms (in US dollars), broken down into 71 sectors.
For our purposes we use two distinct, but fairly complementary ways of aggregating and analysing the data:
1) a four-product group classif ication in accordance with the factor intensity of production; and
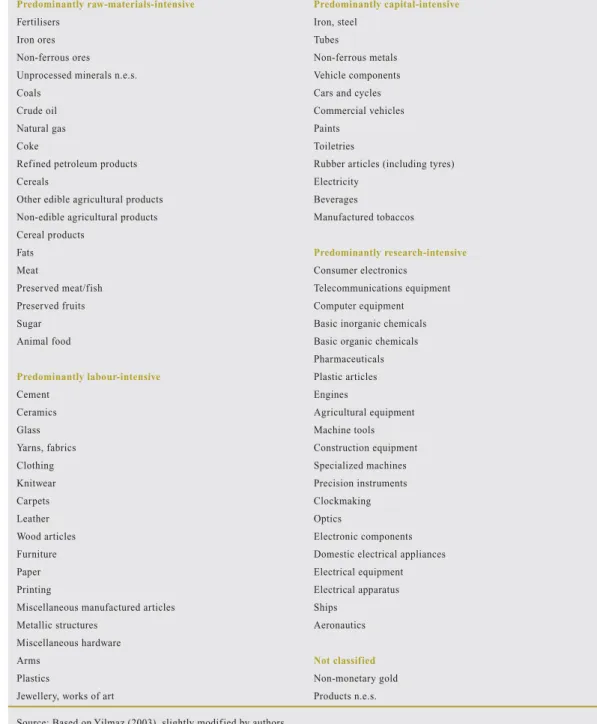
2) a 17-product group classif ication in accordance with technological intensity. The first classification is intended to broadly test whether specialisations are in line with comparative advantages based on factor endowments. By contrast with the standard theoretical framework (which examines two production factors) we consider four factors of production, i.e. (i) raw materials (including energy-related goods), (ii) labour, (iii) physical capital and (iv) research. The export flow data based on the initial 71 sectors are thus aggregated into four product groups, depending on which of these factors of production the sectors mostly use. As an example, fertilizers fall in the predominantly raw materials-intensive category, while clothing is categorised as predominantly labour-intensive, cars are predominantly capital-intensive and aeronautics predominantly research-intensive. The classif ication methodology follows (with some modif ication) that undertaken by Yilmaz (2003), which builds on Hufbauer and Chilas (1974), and is described in Table A3 of Annex A.15 A caveat that applies to this
classification is that it is largely subjective and that some goods can be quite difficult to classify as their production may use several factors to a similar extent. Moreover, the results may be misleading if, for instance, a country focuses on the labour-intensive production stages of a predominantly research-intensive good.
The second classif ication aggregates the raw data into 17 sectors according to their technological content, using the breakdown in the OECD Science, Technology and Industry Scoreboard 2005. The classification establishes the technological content by ranking the 17 sectors by their R&D intensity, defined as R&D spending divided by production or value
Chart 7 Euro area world export market shares, total and excluding China (volume index: 1992 = 100)
Source: ECB calculations.
total excluding China 90 95 100 105 110 115 90 95 100 105 110 115 1992 1994 1996 1998 2000 2002 2004 2006
15 This classification is also applied in some recent trade policy papers, see for instance European Commission (2005).
IN EURO AREA EXPORTS
added in 12 OECD countries. It is thus somewhat better founded than the f irst classif ication as it is more objective. Nevertheless, this classification also has caveats in that it is still quite broad, so that more finely disaggregated products or product stages within industries classified as high-technology may not actually require much R&D investment, while others in low-technology industries may be highly research-intensive. In this second breakdown, we exclude trade flows of energy-related products16 in order to avoid distortions resulting
from the highly volatile prices of oil and other energy-related products.
2.2.2 COMPARATIVE ADVANTAGE AND FACTOR INTENSITY
In order to assess whether the euro area17 and its
main competitors have an export specialisation broadly in accordance with their relative factor abundance, we use the first data classification mentioned above – four product groups – to construct an index of revealed comparative advantage (RCA). Following Balassa (1965), we compute the relative export specialisation of individual countries across the four product groups with respect to the world average as follows:
∑
∑
= i wi i w i ki i k i k X X X X RCA , , , , , / / ) 1 (The numerator represents the percentage share of sector i in country k’s total exports, and the denominator corresponds to the percentage
share of sector i in total world exports. If RCAk.i > 1, then country k is specialised in
sector i relative to the world average. The normalisation by the world average share of exports by sector controls for cyclical changes in the world export structure; the RCA index can therefore be interpreted as a structural index of specialisation.
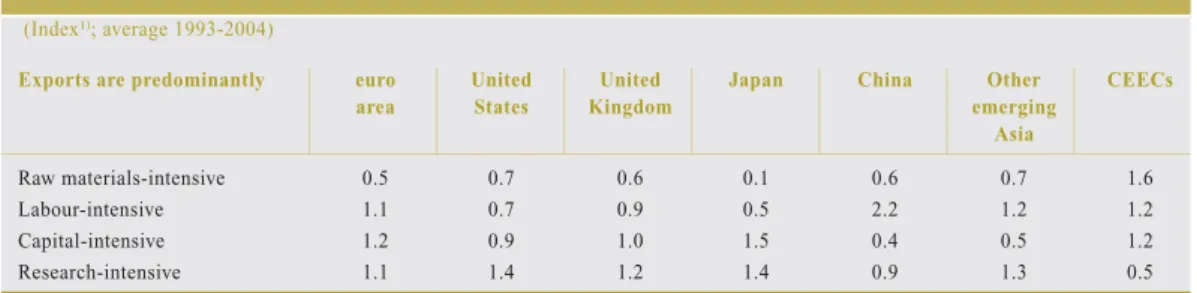
The results show that over the period 1993-2004, euro area exporters appear to have been specialising in predominantly capital and research-intensive, but also labour-intensive, categories of exports (see Table 2). The specialisation in the latter category does not seem to be fully in line with the capital/labour ratio of the euro area, which is much higher than in emerging economies. Partly, this reflects the export specialisation of some euro area countries in lower-tech sectors such as textiles and paper (for more information on the specialisation of individual euro area countries, see Box 3).18
By contrast, the three developed competitor economies considered – i.e. the United States, United Kingdom and Japan – have no revealed comparative advantage in labour-intensive 16 More precisely, we exclude trade flows related to the mining of
coal, extraction of crude petroleum and natural gas, electricity, coke, refined petroleum products and nuclear fuel.
17 Unless otherwise indicated, we focus on extra-euro area trade flows in this paper.
18 Part of the explanation could also clearly relate to the relative arbitrariness of the classification by factor content, including the inability of this approach to take into account differences in skill levels (which could be relatively high in the euro area).
Table 2 Revealed comparative advantage by factor intensity (Index¹); average 1993-2004)
Sources: CHELEM and ECB calculations.
Note: Country and product groups are defined in more detail in Tables A1 and A3 in Annex A. Sectors are aggregated according to the extent to which they require each of the four factors of production.
1) Balassa index of revealed comparative advantage
Exports are predominantly euro United United Japan China Other CEECs
area States Kingdom emerging
Asia
Raw materials-intensive 0.5 0.7 0.6 0.1 0.6 0.7 1.6
Labour-intensive 1.1 0.7 0.9 0.5 2.2 1.2 1.2
Capital-intensive 1.2 0.9 1.0 1.5 0.4 0.5 1.2
exports; they specialise in research-intensive products, in line with their relatively high R&D spending in relation to GDP. In addition to this, Japan is specialised in predominantly capital-intensive goods, reflecting its high capital/labour ratio as seen in Section 1.2. Unsurprisingly, China, but also other emerging Asia and the CEECs, have an export concentration in labour-intensive goods. The other emerging Asia countries are also specialised in research-intensive products. This is not the case for the CEECs, whose lack of revealed comparative advantage in research-intensive goods clearly reflects their low R&D investment shares. The CEECs have an export specialisation in predominantly capital and raw materials-intensive goods.
Overall, the sectoral export specialisation by factor intensity broadly reflects the countries’ relative factor endowments. Most notably, on average, developing countries tend to specialise in exporting labour-intensive products, while capital and research-intensive exports are the main focus of developed economies.
The trade integration of the emerging countries should a priori have led to large changes through
time in comparative advantages and thus specialisation across countries in recent years. Chart 8 shows changes in revealed comparative advantages over time.
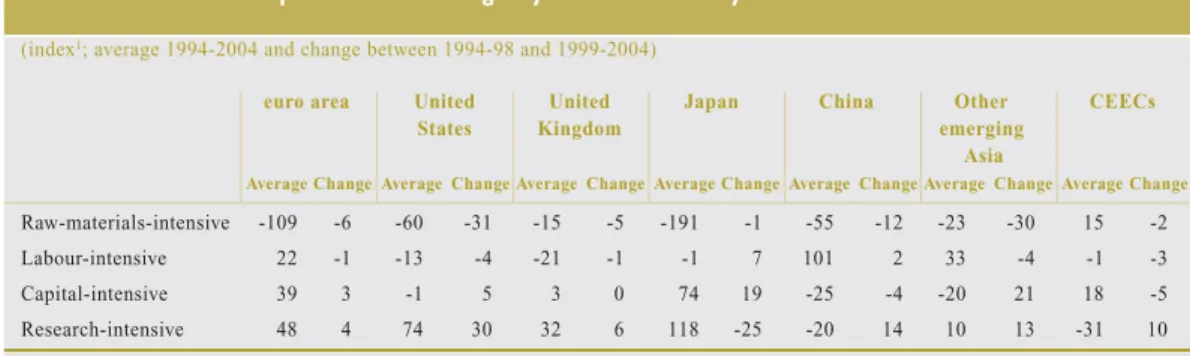
Overall, there have not been major changes in the specialisation in capital or labour-intensive goods, except for some decline in China’s and other emerging Asia’s specialisation in the latter category. It is striking, however, that the euro area’s specialisation in labour-intensive goods exports has hardly moved since 1993, remaining relatively high despite the closer trade integration of the CEECs and emerging Asia. Other emerging Asia has in fact become, in relative terms, less specialised in labour-intensive exports than the euro area. Box 2 argues that this could reflect product and labour markets in the euro area being relatively protected compared with other developed economies, which may have sheltered the manufacturing sectors from competitive pressures, thus delaying potential adjustment processes in industry structures.
As for predominantly research-intensive products, the emerging countries seem to have extended their export specialisation, with a
Chart 8 Developments in revealed comparative advantages (index; annual data)
Sources: CHELEM and ECB calculations.
Note: Balassa index of revealed comparative advantage.
euro area CEECs United Kingdom United States 1993 1995 1997 1999 2001 2003 Japan
Other emerging Asia China
a) Predominantly labour-intensive exports
0.0 0.5 1.0 1.5 2.0 2.5 0.0 0.5 1.0 1.5 2.0 2.5 euro area CEECs United Kingdom United States 1993 1995 1997 1999 2001 2003 Japan
Other emerging Asia China
b) Predominantly capital-intensive exports
0.0 0.2 0.4 0.6 0.8 1.0 1.2 1.4 1.6 1.8 0.0 0.2 0.4 0.6 0.8 1.0 1.2 1.4 1.6 1.8 IN EURO AREA EXPORTS
particularly sharp increase in China (Chart 9). This can be explained by the rising FDI flows that bring the technologies of developed countries to emerging market locations. Moreover, emerging economies, which are far behind in terms of technology than more developed countries, can often imitate technologies that have proven successful elsewhere. This enables them to avoid the risks and costs involved in innovation of their own and thus to enter research-intensive product markets more rapidly. Japan and the United States have broadly retained their already strong positions in this type of exports. By contrast, the euro area has only a relatively weak specialisation in research-intensive products and has not extended this over time, while the
UK’s specialisation in this product group has declined since 2001. Over the years, China and other emerging Asia have become more specialised in this product category than the euro area or the United Kingdom, possibly suggesting more competitive pressure for the developed economies in the future. Nevertheless the reader should bear in mind that the growing specialisation of China and other emerging Asia in research-intensive industries may be partly exaggerated. The classif ication used, which categorises broad industries such as “computer equipment” or “optics” as, overall, research-intensive sectors, is unfortunately unable to distinguish the presence of labour-intensive activities as a result of multinationals operating in these low-wage locations.
Box 2
PRODUCT AND LABOUR MARKET REGULATION ACROSS DEVELOPED ECONOMIES
Excessive product and labour market regulation may slow down the process of adjustment to the forces of globalisation, by constraining firms’ ability to react to a rapidly changing economic environment. In the face of competition-hampering product market regulation, firms may have fewer incentives to reorientate their production to new areas and may be discouraged from innovating. Moreover, the process of market entry and exit of f irms may be slowed down,
Chart 9 Developments in revealed comparative advantages (index; annual data)
Sources: CHELEM and ECB calculations.
Note: Balassa index of revealed comparative advantage
euro area CEECs United Kingdom United States 1993 1995 1997 1999 2001 2003 Japan
Other emerging Asia China
a) Predominantly research-intensive exports
0.0 0.2 0.4 0.6 0.8 1.0 1.2 1.4 1.6 1.8 0.0 0.2 0.4 0.6 0.8 1.0 1.2 1.4 1.6 1.8 euro area CEECs United Kingdom United States 1993 1995 1997 1999 2001 2003 Japan
Other emerging Asia China
b) Predominantly raw materials-intensive exports
0.0 0.2 0.4 0.6 0.8 1.0 1.2 1.4 1.6 1.8 0.0 0.2 0.4 0.6 0.8 1.0 1.2 1.4 1.6 1.8
leading to higher adjustment costs. Employment protection legislation may hinder the creation of new firms and their rapid expansion, while an excessive level of protection may decrease the ability of markets to adjust.
Chart A compares the extent of product market regulation in the manufacturing and services sectors in the euro area with that in the United States, the United Kingdom and Japan, based on an index of product market regulation compiled by the OECD. While it is not possible to gauge the amount of “excessive” regulation, these data suggest that product markets are substantially more regulated in the euro area than in the United States or the United Kingdom, probably making them more insulated from competitive forces. However, since 1992 there has been an increase in the tendency towards deregulation, in part likely to be related to the single European market.
Of the manufacturing sectors, transport equipment and chemicals (including pharmaceuticals) are the most deregulated, see Chart B. The most protected sector is that of other non-metallic mineral products.
Employment protection legislation is also stricter in the euro area than in the United Kingdom or the United States (see Table). Protection has fallen somewhat in Germany and Italy since the late 1980s, but remains broadly unchanged in France. Overall, while this evidence is very tentative, the lower degree of flexibility of product and labour markets in the euro area could suggest that further adjustments in industry and export structures are to be expected, in particular in
Table Summary index of the strictness of employment protection legislation
Late 1980s Late 1990s 2003 euro area 2.9 2.5 2.3 Germany 3.2 2.5 2.2 France 2.7 3.0 3.0 Italy 3.6 2.7 1.9 United Kingdom 0.6 0.6 0.7 United States 0.2 0.2 0.2
Source: OECD Employment Outlook (2004)
Chart A Regulation of goods and services markets across countries
(index)
Sources: OECD and ECB calculations.
Chart B Euro area product market regulation indices across selected manufacturing sectors
(index)
Sources: OECD and ECB calculations. Note: n.e.s. stands for “not elsewhere specified”.
euro area United Kingdom United States Japan 0.10 0.15 0.20 0.25 0.30 0.35 0.10 0.15 0.20 0.25 0.30 0.35 1980 1983 1986 1989 1992 1995 1998 2001
textiles, leather and footwear other non-metallic mineral products transport equipment
chemicals
machinery and equipment, n.e.s.
1980 1983 1986 1989 1992 1995 1998 2001 0.06 0.08 0.10 0.12 0.14 0.16 0.18 0.20 0.06 0.08 0.10 0.12 0.14 0.16 0.18 0.20 IN EURO AREA EXPORTS
2.2.3 SPECIALISATION BY SECTOR ACCORDING TO TECHNOLOGY CONTENT
This section focuses on the more detailed second classification outlined above, which adds useful additional information on technology intensity across export sectors by examining their research content. This breakdown helps to further highlight the strengths and shortcomings of the euro area’s export specialisation, by allowing us to assess how changes in export specialisation are related to the dynamism of world imports and to productivity growth differentials in different sectors across economies.
We first turn to a sectoral assessment of the dynamism and volatility of world import demand, which we will then relate to the export specialisation
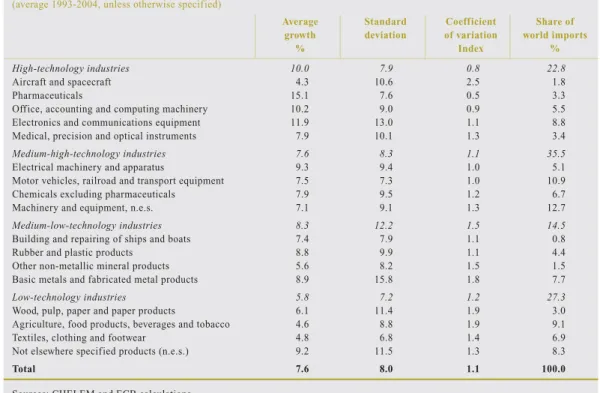
across countries. Table 3 shows that there are large differences in the growth rates of world imports and their volatility across sectors. On average over the period 1993-2004, the most dynamic sector of world demand was the pharmaceutical sector (though starting from a relatively small base at around 3% of world imports), followed by electronics and communications equipment and office and computing machinery.19 These three
sectors grew by an average of above 10% per annum and, according to the OECD (2005) classification, all have a high technological content. The coefficient of variation (defined as the most regulated sectors.1 As the nature and the duration of adjustment costs are determined
by the flexibility of the economy to respond to shocks, this calls for further deregulation of euro area product and labour markets in order to keep transitional losses to a minimum. 1 As regards the industrial structure of the EU, this conclusion is corroborated by van Ark (2005), who confirms that the adjustment
process towards a new industrial structure has developed more slowly in the EU than in the United States.
19 As these data are measured in value terms, and given the generally falling prices of ICT goods, the rise in world trade in ICT goods in volume terms may have been growing at even faster rates.
Table 3 Summary statistics on world imports by sector (average 1993-2004, unless otherwise specified)
Sources: CHELEM and ECB calculations.
Average Standard Coefficient Share of
growth deviation of variation world imports
% Index %
High-technology industries 10.0 7.9 0.8 22.8
Aircraft and spacecraft 4.3 10.6 2.5 1.8
Pharmaceuticals 15.1 7.6 0.5 3.3
Office, accounting and computing machinery 10.2 9.0 0.9 5.5
Electronics and communications equipment 11.9 13.0 1.1 8.8
Medical, precision and optical instruments 7.9 10.1 1.3 3.4
Medium-high-technology industries 7.6 8.3 1.1 35.5
Electrical machinery and apparatus 9.3 9.4 1.0 5.1
Motor vehicles, railroad and transport equipment 7.5 7.3 1.0 10.9
Chemicals excluding pharmaceuticals 7.9 9.5 1.2 6.7
Machinery and equipment, n.e.s. 7.1 9.1 1.3 12.7
Medium-low-technology industries 8.3 12.2 1.5 14.5
Building and repairing of ships and boats 7.4 7.9 1.1 0.8
Rubber and plastic products 8.8 9.9 1.1 4.4
Other non-metallic mineral products 5.6 8.2 1.5 1.5
Basic metals and fabricated metal products 8.9 15.8 1.8 7.7
Low-technology industries 5.8 7.2 1.2 27.3
Wood, pulp, paper and paper products 6.1 11.4 1.9 3.0
Agriculture, food products, beverages and tobacco 4.6 8.8 1.9 9.1
Textiles, clothing and footwear 4.8 6.8 1.4 6.9
Not elsewhere specified products (n.e.s.) 9.2 11.5 1.3 8.3
the standard deviation of annual growth of world imports by sector, normalised by the average growth of world imports in the respective sector) shows that the volatility of import growth for these sectors (in particular pharmaceuticals) was also among the lowest over the 1993-2004 period. After the 2000 recession, however, world import demand for information and communication technology (ICT) goods fell sharply (though it recovered in 2003-04), suggesting that a specialisation in these sectors could perhaps explain weaknesses in export performance in recent years.
In contrast to these rapidly growing industries, world demand in four sectors – including aircraft and spacecraft; agriculture, f ishing, food, beverages and tobacco; textiles, clothing and footwear; and other non-metallic mineral products – has grown at only around half this rate. Three of these sectors have either a low or
medium-low technological content. Moreover, these sectors were also more prone to fluctuations over time in the 1993-2004 period. Overall, it seems that import demand in most high-tech sectors is faster growing and more stable than in low-tech sectors, aside perhaps from the aftermath of the 2000 recession. Against this background, how does the euro area export sector fare in the most dynamic sectors of world demand? Table 4 shows the Balassa index of the euro area’s revealed comparative advantage in the 17 sectors of the technology classif ication in comparison with its main developed and emerging market competitors (for a discussion of export specialisation across individual euro area countries, see Box 3). Three key stylised facts emerge, some of which can provide an explanation as to why the euro area’s export
IN EURO AREA EXPORTS
Table 4 Balassa index of revealed comparative advantage across regions (index, average 1993-2004, based on USD values)
Other
euro United emerging
area USA Kingdom Japan China Asia CEECs
Memo item:
Share in total world exports of goods 17.50 12.0 5.0 8.6 4.40 11.70 5.3
High-technology industries 0.9 1.4 1.4 1.3 1.0 1.7 0.3
Aircraft and spacecraft 1.1 3.2 2.5 0.2 0.1 0.2 0.3
Pharmaceuticals 1.6 0.9 2.0 0.3 0.4 0.2 0.5
Office, accounting and computing machinery 0.7 1.0 1.4 1.4 1.4 2.5 0.2
Electronics and communications equipment 0.7 1.1 0.9 1.7 1.1 2.5 0.3
Medical, precision and optical instruments 1.1 1.7 1.2 1.7 0.9 0.7 0.3
Medium-high-technology industries 1.2 1.1 1.0 1.5 0.6 0.6 0.9
Electrical machinery and apparatus 1.0 1.0 0.9 1.5 1.4 1.1 1.0
Motor vehicles, railroad and transport equipment 1.1 0.9 0.8 1.9 0.2 0.4 0.7
Chemicals excluding pharmaceuticals 1.3 1.2 1.2 0.8 0.6 0.6 1.0
Machinery and equipment, n.e.s. 1.4 1.2 1.0 1.4 0.6 0.6 0.9
Medium-low-technology industries 0.9 0.7 0.7 0.9 0.7 0.9 1.9
Building and repairing of ships and boats 1.0 0.3 0.5 2.9 0.9 1.8 1.4
Rubber and plastics products 1.0 1.0 0.8 0.8 0.7 1.0 0.9
Other non-metallic mineral products 1.2 0.7 0.8 0.7 1.4 0.6 1.9
Basic metals and fabricated metal products 0.7 0.6 0.7 0.8 0.5 0.7 2.6
Low-technology industries 0.9 0.8 0.9 0.3 1.6 1.0 1.2
Wood, pulp, paper and paper products 1.0 1.0 0.8 0.2 0.4 0.7 1.1
Agriculture, food products, beverages and tobacco 0.8 1.0 0.7 0.1 0.8 0.7 1.1
Textiles, clothing and footwear 0.9 0.4 0.5 0.2 3.6 1.7 1.5
Not elsewhere specified products (n.e.s.) 1.1 0.8 1.4 0.7 1.1 0.7 1.1
Sources: CHELEM and ECB calculations
Notes: A value higher than 1 (marked in bold) indicates a comparative advantage in that sector. Euro area exports exclude intra-euro area trade. Total exports exclude exports of energy-related products. For a list of the countries included in each geographical area, see Annex A.
market share has held up relatively well vis-à-vis the other large developed economies (as seen in Charts 5 and 6 above). First, on average, the euro area specialises in medium-tech industries, most notably motor vehicles, railroad and transport equipment; chemicals; and machinery and equipment – all sectors in which imports are growing at a rate close to the world average. As for high-tech industries, the euro area tends to have an uneven record, as it concentrates on just a few of these sectors (two of which, i.e. pharmaceuticals, and medical, precision and optical instruments, are among the fastest-growing sectors of world demand, however). In others, such as computers and electronics, it has a low revealed comparative advantage, which perhaps explains why the euro area has not suffered as much of a loss in export market share following the bursting of the ICT bubble in 2000. Moreover, its specialisation in medium-low and low technology industries is also relatively weak. Second, the Balassa indices computed for the euro area (except perhaps for pharmaceuticals) are relatively close to the index for all sectors, suggesting that the specialisation is spread fairly evenly across industries. This could reflect the fact that, as a relatively large region, the euro area has a more diversified production and export structure than other countries, thus leading to an exhaustion of economies of scale for a larger number of industries. The advantage of this more diversif ied production structure would be that the euro area is perhaps less
strongly affected by a downturn in demand in any single sector than other economies. But such a structure to some extent also reflects different specialisations of individual euro area countries (see Box 3), which could pose the risk of asymmetric shocks in the event of a downturns in particular sectors.
Third, the revealed comparative advantages of the euro area are largely concentrated in sectors where the emerging market competitors are still relatively weak. The latter have mainly entered low and medium-low technology sectors (more specifically textiles, clothing and footwear and basic metals and fabricated metal products as well as other non-metallic mineral products). Emerging Asia is also specialised in electrical machinery and apparatus – the only medium-tech sector on which euro area exports are not strongly focused – and the ICT-related sectors. The euro area thus stands in sharp contrast to other developed economies, which may on average be more exposed to competition from the Asian emerging countries in the ICT sectors.
This is not to say that competition in sectors of traditional euro area stronghold may not become more intense in the future, however. Indeed, the export specialisation of the CEECs, and to a lesser extent also emerging Asia, has already started to increase over the past decade in the medium-high-tech sectors motor vehicles and transport equipment as well as other machinery and equipment, albeit to a generally smaller extent than for the high-tech sectors.
Box 3
EXPORT SPECIALISATION OF EURO AREA COUNTRIES
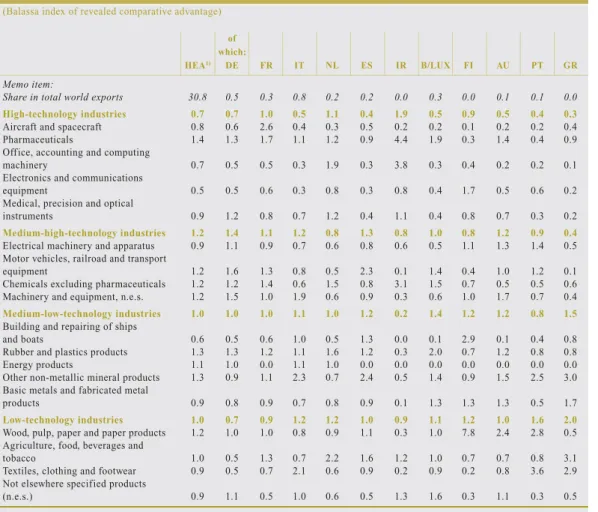
The export specialisation of the euro area as a whole hides considerable differences between individual euro area economies. The euro area’s overall strong specialisation in medium-high-tech exports can largely be explained by the export structures of Germany, France and Italy, which all have their strongest specialisation in medium-high-tech sectors. Some countries, however, are much more specialised in high-tech goods than the euro area average and have benefited from the change in the composition of world trade towards more high-tech products: these include Ireland and the Netherlands. Within high-tech goods, both countries have a revealed comparative advantage in exports of pharmaceuticals; medical, precision and optical
instruments; and off ice, accounting and computing machinery, although in the case of the Netherlands, the specialisation in latter sector may largely reflect re-exports, as the Netherlands is an important logistical centre for ICT exports to other European countries.
Countries with predominantly low-tech export specialisations include Greece and Portugal. The specialisation of these countries is particularly strong in the export of textile products. In this context, Italy – in addition to its specialisation in medium-high-tech products – also stands out as being relatively specialised in low-tech sectors, largely due to its large textile export sector. Unless these countries are able to differentiate their products and exploit high-end markets for textiles, it may happen that these sectors will decline over time in the face of strong competition from exporters in countries with lower labour costs.
The highest specialisation index in any given sector occurs for Finland, which is strongly specialised in the production of wood, pulp, paper and paper products. This can be explained by forestry being the country’s most important natural resource and by the fact that this industry cluster is exploiting economies of scale.
Sources: CHELEM and ECB calculations.
1) EA stands for euro area. In this table, it includes intra- and extra-euro area exports.
Table Export specialisation by euro area country and export sector (Balassa index of revealed comparative advantage)
of
which:
HEA1) DE FR IT NL ES IR B/LUX FI AU PT GR
Memo item:
Share in total world exports 30.8 0.5 0.3 0.8 0.2 0.2 0.0 0.3 0.0 0.1 0.1 0.0
High-technology industries 0.7 0.7 1.0 0.5 1.1 0.4 1.9 0.5 0.9 0.5 0.4 0.3
Aircraft and spacecraft 0.8 0.6 2.6 0.4 0.3 0.5 0.2 0.2 0.1 0.2 0.2 0.4
Pharmaceuticals 1.4 1.3 1.7 1.1 1.2 0.9 4.4 1.9 0.3 1.4 0.4 0.9
Office, accounting and computing
machinery 0.7 0.5 0.5 0.3 1.9 0.3 3.8 0.3 0.4 0.2 0.2 0.1
Electronics and communications
equipment 0.5 0.5 0.6 0.3 0.8 0.3 0.8 0.4 1.7 0.5 0.6 0.2
Medical, precision and optical
instruments 0.9 1.2 0.8 0.7 1.2 0.4 1.1 0.4 0.8 0.7 0.3 0.2
Medium-high-technology industries 1.2 1.4 1.1 1.2 0.8 1.3 0.8 1.0 0.8 1.2 0.9 0.4
Electrical machinery and apparatus 0.9 1.1 0.9 0.7 0.6 0.8 0.6 0.5 1.1 1.3 1.4 0.5
Motor vehicles, railroad and transport
equipment 1.2 1.6 1.3 0.8 0.5 2.3 0.1 1.4 0.4 1.0 1.2 0.1
Chemicals excluding pharmaceuticals 1.2 1.2 1.4 0.6 1.5 0.8 3.1 1.5 0.7 0.5 0.5 0.6
Machinery and equipment, n.e.s. 1.2 1.5 1.0 1.9 0.6 0.9 0.3 0.6 1.0 1.7 0.7 0.4
Medium-low-technology industries 1.0 1.0 1.0 1.1 1.0 1.2 0.2 1.4 1.2 1.2 0.8 1.5
Building and repairing of ships
and boats 0.6 0.5 0.6 1.0 0.5 1.3 0.0 0.1 2.9 0.1 0.4 0.8
Rubber and plastics products 1.3 1.3 1.2 1.1 1.6 1.2 0.3 2.0 0.7 1.2 0.8 0.8
Energy products 1.1 1.0 0.0 1.1 1.0 0.0 0.0 0.0 0.0 0.0 0.0 0.0
Other non-metallic mineral products 1.3 0.9 1.1 2.3 0.7 2.4 0.5 1.4 0.9 1.5 2.5 3.0
Basic metals and fabricated metal
products 0.9 0.8 0.9 0.7 0.8 0.9 0.1 1.3 1.3 1.3 0.5 1.7
Low-technology industries 1.0 0.7 0.9 1.2 1.2 1.0 0.9 1.1 1.2 1.0 1.6 2.0
Wood, pulp, paper and paper products 1.2 1.0 1.0 0.8 0.9 1.1 0.3 1.0 7.8 2.4 2.8 0.5
Agriculture, food, beverages and
tobacco 1.0 0.5 1.3 0.7 2.2 1.6 1.2 1.0 0.7 0.7 0.8 3.1
Textiles, clothing and footwear 0.9 0.5 0.7 2.1 0.6 0.9 0.2 0.9 0.2 0.8 3.6 2.9
Not elsewhere specified products
(n.e.s.) 0.9 1.1 0.5 1.0 0.6 0.5 1.3 1.6 0.3 1.1 0.3 0.5
IN EURO AREA EXPORTS
In what follows we aim to gauge whether the sectoral specialisation of the euro area is moving into the most dynamic sectors of world demand, and how it compares with the sectoral specialisation of its competitors. Charts 10 to 13 thus bring together evidence on recent changes in export specialisation across countries in the last few years and the development of world import growth for the main sectors.20
Using as a discrimination criterion the growth of world imports in a specific sector vis-à-vis the average total world import growth of 7.6%, we can distinguish sectors of increasing specialisation as “rising stars” or “declining stars”, depending on whether they are growing at, respectively, higher or lower rates than world trade average. Alternatively, they are defined as “missed opportunities” or “retreats”, when a falling specialisation in a sector is associated with, respectively, higher or lower import growth than the world average.
Comparing two periods in time (1993-98 and 1999-2004) it would appear that among the fastest-growing sectors of world demand, the euro area has increased its specialisation in pharmaceuticals; electronics and communications equipment; as well as in office, accounting and computing machinery; medical, precision and optical instruments; and chemicals, albeit all to a relatively small extent.21 These developments
would appear to augur well for euro area prospects as all such sectors are intensive in high or medium-high technology and have relatively dynamic world demand, which
Chart 10 Change in euro area specialisation and world trade growth
Note: The change in export specialisation is defined as the change in the Balassa index of revealed comparative advantage on average between 1993-98 and 1999-04. The size of the bubbles is determined by the share of exports in total exports.
Pharmaceuticals Aircraft and spacecraft Office, accounting and computing machinery Medical, precision and optical instruments Electrical machinery and apparatus, n.e.s. Motor vehicles, railroad and transport
equipment, n.e.s. Chemicals excluding pharmaceuticals Machinery and equipment, n.e.s. Building and repairing of ships and boats Rubber and plastics products Other non-metallic mineral products Basic metals and
fabricated metal products
Wood, pulp, paper, printing and publishing Agriculture, food products, beverages and tobacco Textiles, leather and footwear Not elsewhere specified products 0.0 2.0 4.0 8.0 10.0 12.0 14.0 16.0
World trade growth, percentages p.a. 1993-2004
Change in specialisation
Rising stars Missed opportunities
Retreats Declining stars
high-tech medium-high-tech medium-low-tech low-tech Electronics and communications equipment 6.0 -0.15 -0.10 -0.05 0.00 0.05 0.10 0.15
20 These charts are based on charts produced by the International Trade Centre, see http://www.intracen.org/.
21 This finding mirrors earlier findings by the Monetary Policy Committee (MPC) task force of the European System of Central Banks (ESCB) (2004) that the sectoral specialisation of European production had only experienced relatively small changes in over time, and, when changes in specialisation occurred, they happened relatively slowly. The paper found that the speed of reallocation of resources across value added sectors was higher in the United States than in the EU.