...
S
ERVER
D
ESIGNS FOR
W
AREHOUSE
-C
OMPUTING
E
NVIRONMENTS
...
THE ENORMOUS SCALE OF WAREHOUSE-COMPUTING ENVIRONMENTS LEADS TO UNIQUE
REQUIREMENTS IN WHICH COST AND POWER FIGURE PROMINENTLY. MODELS AND METRICS QUANTIFYING THESE REQUIREMENTS, ALONG WITH A BENCHMARK SUITE TO CAPTURE WORKLOAD BEHAVIOR, HELP IDENTIFY BOTTLENECKS AND EVALUATE SOLU-TIONS. AHOLISTIC APPROACH LEADS TO A NEW SYSTEM ARCHITECTURE INCORPORATING VOLUME NON-SERVER-CLASS COMPONENTS IN NOVEL PACKAGING SOLUTIONS, WITH MEMORY SHARING AND FLASH-BASED DISK CACHING....
In recent years, one of the biggest trends in the server market has been the emergence of the large-scale data center, driven by Internet-sector growth. Indeed, recent market research identifies the Internet sector as the fastest-growing segment of the overall server market, growing by 40 to 65 percent every year, and accounting for more than 65 percent of low-end-server rev-enue growth in 2006. Furthermore, several recent news articles and keynote speeches have highlighted this area’s importance.1,2One of the most interesting aspects of this growth is the unique set of challenges it presents for server design. Internet-sector infrastructures have millions of users running on hundreds of thousands of servers, making the ability to scale-out server configurations a key design requirement. Experts have compared these environments to a large warehouse-style computer, with distributed applications such as mail, search, and so on.1For companies in this market, data-center infrastructure— including power and cooling—can be the larg-est capital and operating expense, motivating
companies to focus on the sweet spot of commodity pricing and energy efficiency. Fur-thermore, the high volume of this market and the dominance of a few key players—for example, Google, Microsoft, Amazon— allow for exploring novel approaches such as custom-designed servers in greenfield data centers, newly built from the ground up.
Our work addresses these challenges and opportunities by developing workloads and metrics targeted toward large-scale data centers, and using these tools to build and analyze new system architectures optimized for the Internet sector. We created an evaluation infrastructure including a benchmark suite for warehouse-computing workloads, and detailed performance, cost, and power mod-els and metrics. These tools let us see the contributions of all layers within large-scale data centers, and lead us to the identification of the CPU, cooling, memory, and disk as the key performance-per-cost bottlenecks. Using our understanding of the importance of these components, we created a system architecture that holistically addresses each
Kevin Lim
University of Michigan
Parthasarathy
Ranganathan
Jichuan Chang
Chandrakant Patel
Hewlett-Packard Labs
Trevor Mudge
Steven K. Reinhardt
University of Michigan
...
layer through novel features, including the use of low-cost, low-power components from the high-volume, embedded market; new packaging solutions; memory sharing; and flash-based disk caching. Our results are promising, providing an average twofold improvement in performance per dollar for our benchmarks. More importantly, our work highlights the potential of cost-efficient, ensemble-level design, and suggests the use-fulness of further research in this area.
Evaluation environment
Due to the novelty of warehouse-computing environments and the lack of public informa-tion available, we developed a new workload suite, as well as cost, power, and performance models tailored to this domain. In addition, we propose a performance-per-cost metric for large-scale data centers, and using this metric along with our tools, we perform an analysis to identify the key cost bottlenecks that need to be addressed using new system architectures.
Workloads
One key contribution of our work is the development of a benchmark suite that
models warehouse-computing workloads. Applications in this area are different from traditional benchmarks due to their scale and level of user involvement. This differ-ence is reflected by our benchmark suite’s focus on large data sets, user interactivity, and cluster-level processing. We based our suite on open source software and publicly available real-world traces in the hope that the suite will be useful to other researchers.
The benchmark suite comprises four workloads representative of different services in Internet-sector data centers. Our work-loads include Web search, Web mail, video hosting, and MapReduce,3which emphasize unstructured data, user involvement, rich media types, and the Web as a platform, respectively. Table 1 lists these benchmarks in greater detail, including the software used for each benchmark. To emulate the large data sets typically found in these work-loads, we have used a wide array of sources, including data gathered from public sites (Wikipedia search index), internally collected statistics (e-mail statistics from within the University of Michigan), and previously published data (recorded YouTube traffic at an edge network4). To make simulation Table 1. Details of our benchmark suite representing Internet-sector workloads.
Description
Nutch running on Apache Tomcat with a 1.3-Gbyte index (1.3 million documents) and 25 percent of index terms cached in memory, with a 2-Gbyte Java heap size. Quality of service (QoS) requires more than 95 percent of queries to take under 0.5 seconds.
Front end: Squirrelmail with Apache and PHP4. Back end: Courier-Internet Message Access
Protocol and Exim.
One-thousand virtual users with 7 Gbytes of emails. Email and attachment sizes and use patterns modeled
after MS Exchange 2003 LoadSim for heavy users. QoS requires more than 95 percent requests to take
under 0.8 second.
Modified SPECweb2005 Support workload with YouTube traffic characteristics.
Apache Tomcat with Rock httpd server.
Apache Hadoop with four threads per CPU and 1.5-Gbyte Java heap size.
Two workloads: distributed file write (mapred-wr) and word count (mapred-wc). Emphasis Role of unstructured data Interactive Internet services
Use of rich media
Web as a platform Workload Web search Web mail Video hosting MapReduce Performance metric
Request per second (RPS) with QoS
RPS with QoS
RPS with QoS
Execution time
feasible, we use scaled-down versions of these data sets. One issue adding to the complexity of our workloads is the importance of throughput and latency—in the Internet sector, both the number of requests per sec-ond processed and the network response time are key performance measures. Thus, to drive our workloads, we have developed software clients that change their request rates dynamically to achieve the highest possible throughput while maintaining quality-of-service guarantees for response time. Note that this does not apply to Map-Reduce, which is a cluster-processing job. We believe this benchmark suite is a good representative of Internet-sector workloads for our study, and provides a sound basis for future expansion.
Metrics and models
In addition to using these benchmarks to compare the performance of different server designs, we defined several key metrics and models that give a detailed overview of Internet-sector environments. Our primary metric was the sustainable performance div-ided by total cost of ownership (TCO). For TCO, we assumed a three-year depreciation cycle and consider costs associated with base hardware, burdened power and cooling, and real estate.
Our cost model consists of two main components: base hardware and burdened power and cooling costs. For the base hard-ware costs, we aggregate the costs of the individual components—that is, CPU, memory, disk, board, and power and cool-ing components—at a per-server level. We combine these costs at the rack level, and then consider additional switch and enclo-sure costs for the rack. For the power and cooling costs, we use two subcomponents. We first compute the rack-level power con-sumption (P_consumed) by summing the power used for the CPU, memory, disk, power and cooling, and the rest of the board at the per-server level, and ad-ditional switch power at the rack level. We prorate this by an activity factor of 0.75 because the published power numbers we use are worst-case numbers, which are higher than the actual power consumption. We then use P_consumed to determine the burdened
cost of power and cooling using the methodol-ogy discussed by Patel et al.,5which factors in electricity costs for the system and the cooling, as well as the amortized infrastructure costs for power and cooling.
To evaluate performance, we used Hewlett-Packard Labs’ COTSon simulator,6which is based on AMD’s SimNow infrastructure.7 COTSon is a validated full-system x86/x86-64 simulator, running x86/x86-64-bit Debian Linux with the 2.6.15 kernel. COTSon is flexible enough to let us simulate several server con-figurations and multisystem models.
Cost analysis
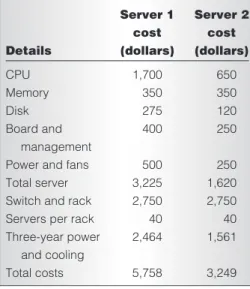
We use these workloads, metrics, and detailed models as tools to evaluate the contri-butions of all layers in a warehouse-computing environment. Tables 2 and 3 list the costs and
Table 2. Servers’ cost models.
1,700 350 275 400 500 3,225 2,750 40 2,464 5,758 Server 1 cost (dollars) CPU Memory Disk Board and management Power and fans Total server Switch and rack Servers per rack Three-year power and cooling Total costs Details 650 350 120 250 250 1,620 2,750 40 1,561 3,249 Server 2 cost (dollars)
Table 3. Servers’ power models.
Details Server 1 power (watts) Server 2 power (watts) CPU Memory Disk Board and management Total server Power and fans
340 50 210 25 15 40 40 105 25 10 35 215
...
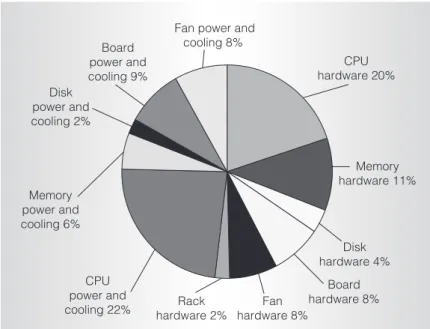
power use for existing midrange (server 1) and low-end (server 2) server configurations. Figure 1 shows a breakdown of the total costs for the low-end server, separated as infrastructure and burdened power and cooling. This data highlights several interesting points. We see that power and cooling costs are comparable to hardware costs. Although the CPU hard-ware and power and cooling are the two largest total costs, several other components including
memory and disk contribute similarly. Thus, to achieve compelling performance-per-dollar advantages, we need solutions to holistically address multiple components.
New server architecture
Based on the insights gained from the pre-vious cost and power-use analysis, we consider three key issues aimed at a holistic solution:
reducing overall CPU-related costs by using lower-cost, lower-power (but also lower-performance) nonserver processors;
reducing the burdened costs of power with novel packaging solutions; and
improving the memory and disk sub-systems using solutions geared toward low power and low aggregate costs. Figure 2 shows our system architecture, which uses novel designs and optimizations to address each of these issues.
Low-power CPUs
Server designs for databases or high-performance computing have traditionally focused on obtaining the highest perfor-mance per server. However, the nature of Internet sector workloads encourages scale-out environments, which use many servers to achieve high performance. This requires instead a focus on performance per cost per server. Indeed, publications by large Internet-sector companies, such as Google,8exhibit the usefulness of building servers using com-modity desktop-PC parts. The logic behind this is that volume drives cost. Compared to servers that have a limited market and higher price margins, commodity PCs have a much larger market that enables lower prices. Additionally, these systems don’t include cost premiums for high-end features that the built-in reliability support of the software stack for Internet-sector workloads makes redundant.
In this section, we evaluate the effective-ness of low-end servers and desktops for the warehouse-computing market. We take the focus on performance per cost one step further, exploring an alternative commod-ity market: the embedded and mobile segment. Trends in transistor scaling and embedded-processor design have brought powerful,
Disk power and cooling 2% Board power and cooling 9% Memory power and cooling 6% Board hardware 8% Memory hardware 11% Disk hardware 4% Rack hardware 2% CPU power and
cooling 22% hardware 8%Fan
CPU hardware 20% Fan power and
cooling 8%
Figure 1. Cost breakdown for server 2, a low-end server-class system configuration. Low-power, low-cost, embedded-class processors offer superior performance/ total-cost-of-ownership results
Novel and efficient packaging enables multiple compact
servers per blade Remote shared memory blades require less total memory, reducing cost and power
Local flash-based disk caching lowers power, boosts performance
Figure 2. Our system’s architecture illustrating a holistic approach to improving component costs.
general-purpose, multicore processors to the embedded arena. Devices using embedded CPUs are shipped in even higher volume than desktops, leading to greater cost savings. Additionally, embedded parts are often designed for minimal power consumption due to their use in mobile systems. Power is a large portion of total lifecycle costs, so greater power efficiency reduces costs. The key open question is whether these cost and power benefits can offset the performance degradation relative to the baseline server.
To perform this evaluation, we consider six system configurations:
server 1 (midrange),
server 2 (low end),
desktop,
mobile,
embedded 1 (midrange), and
embedded 2 (low end).
All the systems are dual core excluding server 1, which is a quad core, and embedded system 2, which is a single core. All have 4 Gbytes of memory. Servers 1 and 2 use fully buffered dual inline memory modules (FB-DIMMs); desktop, mobile, and embedded system 1 use double data rate (DDR) 2 memory; and embedded system 2 uses DDR1 memory. Server 1 has a 15,000-revolutions-per-minute disk
and a 10-Gbit network interface controller, while the other systems have a 7,200-RPM disk and a 1-Gbit NIC. Our goal for these experiments is to isolate the effect of the processor type, so we keep memory and disk capacity constant.
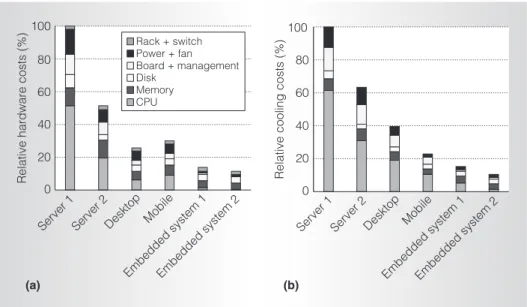
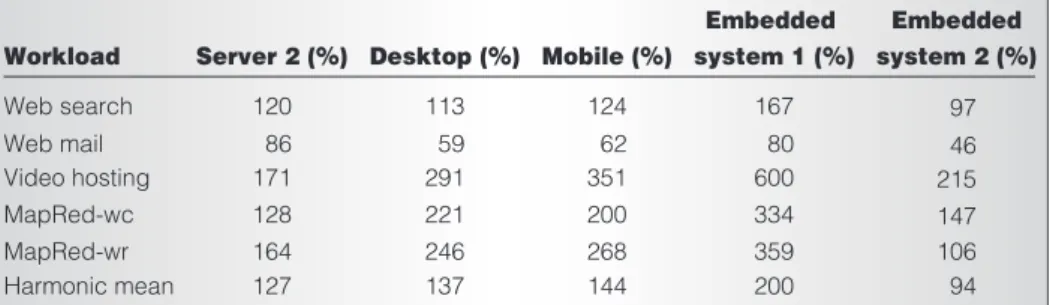
Figures 3a and 3b summarize the break-down of infrastructure costs and the bur-dened power and cooling costs. Table 4 shows the variation in performance per cost for each system. In the table, the harmonic mean row shows the average performance per cost, computed as the harmonic mean of the throughput and reciprocal of execu-tion times divided by total system costs.
As Figure 3a illustrates, at a per-system level, the hardware costs are dramatically lower for the consumer systems. The biggest reduction comes in the CPU component. The use of consumer technologies, such as DDR2 memory, leads to reductions in other components as well. The costs of the desktop system are 25 percent of the costs of the server 1 configuration, whereas the costs of embedded system 1 are only 15 per-cent of the costs of the server 1 configura-tion. In the mobile system, we see higher costs relative to the desktop because of the premium for low-power components in this market. Figure 3b shows similar trends for power and cooling costs. The desktop system has 60 percent lower power and cooling costs
0 20 40 60 80 100 Rack + switch Power + fan Board + management Disk Memory CPU 0 20 40
Relative cooling costs (%)
Relative hardware costs (%)
60 80 100
Server 1 Server 2 Desktop Mobile
Embedded system 1Embedded system 2 Server 1 Server 2 Desktop Mobile
Embedded system 1Embedded system 2
(a) (b)
Figure 3. Summary of benefits from using low-cost, low-power CPUs from nonserver markets: infrastructure costs (a) and cooling costs (b).
than server 1, but the embedded system 1 system does even better, saving 85 percent of the costs.
Table 4 shows significant improvements in performance per cost for the desktop, mobile, and embedded system 1 relative to server 1; however, embedded system 2 doesn’t perform well. Given the relative losses in performance to the benefits in costs, these systems often have superior per-formance per cost compared to server 1. On video hosting and MapReduce, embedded system 1 achieves three- to sixfold improvement in performance per total costs—due to these workloads being primar-ily network or disk bound. Embedded system 1 achieves an improvement of 67 percent for Web search, but has a net deg-radation in performance per cost for Web mail because of a significant performance decrease. Overall, our workloads show a ben-efit from lower-end consumer platforms optimized for power and costs, compared to server 1. A key result from our study is that embedded systems could offer more cost savings at the same performance; but the choice of embedded platform is impor-tant (for example, embedded system 1 versus embedded system 2). It must be noted that these results hold true for our workloads, but more study is needed before we can gen-eralize these results to all variations of Internet-sector workloads.
Cooling and packaging
Our discussion in the ‘‘Cost analysis’’ section notes that after the processor, the next largest cost factor is the burdened cost of cooling. Using lower-power systems presents new opportunities for smaller form factor boards, which in turn allow for
cooling system optimizations. Here, we dis-cuss two such optimizations—dual-entry enclosures with directed airflow and board-level aggregated heat removal—using blade servers as the exemplar for the rest of our dis-cussions, because they’re well known in the market.
Dual-entry enclosures with directed airflow.
Figure 2 shows how we can redesign a server-level enclosure to allow inserting blades from front and back to attach to a midplane within the enclosure. The idea behind this is to partition the airflow and allow directing of cold air vertically through the blades. We achieve this by increasing the enclosure’s volume to create an inlet and exhaust plenum, and direct the airflow in the directions indicated by the arrows in Figure 2. This design maintains airflow through all the blades in parallel from intake plenum to exhaust plenum. Compared to conventional blade enclosures, which force air directly from front to back, this design has a shorter flow length (the distance traversed by the air), lower preheat (the temperature of the air hitting the blades), and reduced pressure drop and volume flow. Our thermomechanical analysis of the thermal-resistance, airflow improvements with this design shows an almost 50 percent improvement in cooling efficiencies. Compared to the baseline that allows forty 1U servers on each rack, our design allows forty 75-watt blades in a 5U enclosure, allowing 320 systems on each rack.
Board-level aggregated heat removal.Figure 4 shows an even more radical packaging design. With low-power systems, we can consider Table 4. Normalized performance per total-cost-of-ownership efficiency.
Workload Web search Web mail Video hosting MapRed-wc Harmonic mean Server 2 (%) 171 128 86 120 127 Desktop (%) 291 221 59 113 137 Mobile (%) 351 200 62 124 144 Embedded system 1 (%) 600 334 80 167 200 MapRed-wr 164 246 268 359 Embedded system 2 (%) 215 147 46 97 106 94
...
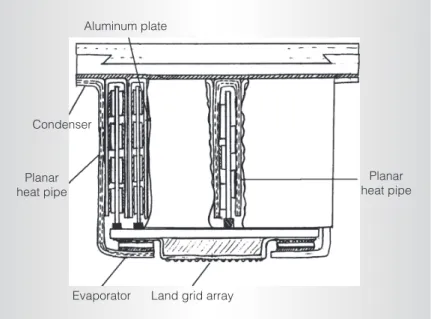
servers with much smaller form factors that are integrated on conventional blades that fit into an enclosure. Figure 4 shows an innovative packaging scheme that aggregates the power-dissipating components at the device and package level. We intersperse the smaller form factor server modules with planar heat pipes that transfer heat to a central location with an effective conductivity three times that of copper. The design removes aggregated heat with a larger, optimized heat sink, which enables channeling airflow through a single heat sink as opposed to multiple separate conventional heat sinks. The increases in conductivity and heat-extraction area lead to more effective cooling. We can connect the smaller blades through different interfaces, such as Computer-on-Module Express or Advanced Mezzanine Card interfaces. With higher power budgets, one large blade can support four smaller modules, allowing 1,250 systems on each rack. These cooling optimizations could improve efficiencies two- to fourfold. Although we use specialized designs, our cooling solutions should perform effectively in other enterprise environments. When combined with the sig-nificant and growing fraction of the market represented by warehouse-computing environ-ments, these designs should have enough vol-ume to drive commoditization.
Other optimizations
Our cost analysis showed that memory and disk are other key factors in server sys-tems’ overall performance per cost. We devel-oped optimized memory and disk subsystems that lower costs and power while maintaining high performance by exploiting memory and disk behaviors and characteristics.
Our memory design leverages the observa-tion that memory demands across workloads can vary widely. Studies have shown that per-server sizing for peak loads can lead to signifi-cant ensemble-level overprovisioning;9,10this problem is exacerbated in large-scale data centers running a variety of applications. To address memory overprovisioning, we provi-sion memory at a coarser, per-blade-chassis granularity, sizing each larger unit to meet the expected aggregate peak demand. In our design, we connect servers within a blade enclosure to a memory blade, which provides
a remote memory pool that is dynamically partitioned among the servers. By exploiting locality while using the remote memory, the systems can have a reduced local memory and still maintain high performance. Within a single enclosure, we connect the server and memory blades via a high-speed inter-connect (for example, PCIe). We provide the servers with simple hardware support and make minor changes to the operating system or hypervisor to let applications transparently use the remote memory.11 This hierarchical design enables further opti-mizations, such as the use of power-down modes and lower-cost DRAM. By provision-ing memory more accurately across servers, our design obtains notable power and cost savings.
Our disk optimizations use low-power, laptop-class disks to reduce power consump-tion, and have flash-based disk caching to pro-vide higher performance. We move the laptop disks to a basic storage area network (SAN) interfaced through the Serial ATA interface. By using a SAN, we can make individual server blades smaller, allowing small module form fac-tors. Although the disks have lower power and a smaller form factor, they come with the trade-offs of lower performance and higher price. To offset this, we use a flash-based disk-caching mechanism,12with the flash located on the server board itself. The flash holds any recently
Aluminum plate
Planar heat pipe Planar
heat pipe
Land grid array Evaporator
Condenser
Figure 4. Aggregated heat removal design.
accessed pages from the disk, and the system checks its contents any time a page is not found in the operating system’s page cache. Flash-based disk caching combined with low-power laptop disks provides performance-per-cost advantages over traditional server-class disks and allows even greater compaction.
Unified design
Our solutions so far have targeted the top performance-per-cost factors we identified in current servers: CPU, cooling and packaging, memory, and disk. Although we’ve discussed their benefits in isolation, we designed all of our optimizations to work in combination, addressing our holistic design motivation.
Figure 2 shows our unified design, which uses embedded-class, dual-core processors and small form-factor blades with aggregated cooling, housed in an enclosure with directed airflow. We use a remote memory blade and remote low-power disks with flash-based disk caching to enable this level of compaction. The use of the low-power com-ponents and efficient cooling and packaging are critical to making this super-dense server feasible for large-scale data centers. Although some of the changes required for this config-uration assume custom components, they’ll likely become cost-effective in a few years, leveraging the volume in this market.
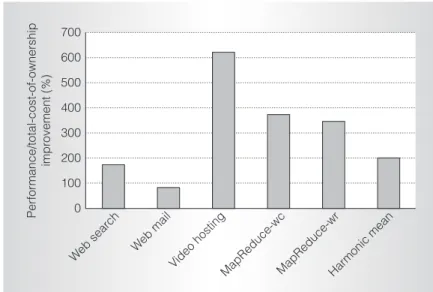
Figure 5 shows how our solution signifi-cantly improves cost and power efficiencies compared to the baseline, midrange server system. For the video hosting and Map-Reduce benchmarks, the performance and TCO improves by 3.5 to 6 times for the next-generation solution. These benefits come equally from infrastructure costs and power savings. Web search gets lower benefits—10 to 70 percent improvement— and Web mail sees degradations (20 percent for the next-generation system). Figure 5 also shows the harmonic mean across our benchmarks. Overall, our solution can improve sustained throughput per total infra-structure dollar by 2 times. That is, for the same performance as the baseline, our solu-tion gets a 60 percent reducsolu-tion in power, a 55 percent reduction in overall costs, and requires 30 percent less rack space (assuming four air-cooled embedded blades on each larger blade).
W
e don’t intend for our proposed techniques to be the final word on warehouse-computing designs, but rather to illustrate the substantial improvements achiev-able when system architects take an ensemble-level view. Overall, as enterprises gravitate toward ever more cost-conscious and data-center-level solutions, holistic approaches such as the ones used in this article will likely be a key part of future system designs. MICRO...
References1. L. Barroso, ‘‘Warehouse-Scale Computers,’’
Usenix Ann. Technical Conf.,Usenix, 2007; http://www.usenix.org/events/usenix07/tech/. 2. R. Bryant, ‘‘Data Intensive Super Comput-ing: Taking Google-Style Computing Beyond Web Search,’’Computing Community Con-sortium at the Federated Computing Research Conf.,2007; http://lazowska.cs. washington.edu/fcrc/Bryant.FCRC.pdf. 3. J. Dean and S. Ghemawat, ‘‘MapReduce:
Simplified Data Processing on Large
Clus-ters,’’ Proc. Symp. Operating System
Design and Implementation(OSDI-6), Use-nix, 2004, pp. 137-150.
4. P. Gill et al., ‘‘YouTube Traffic Characteriza-tion: A View from the Edge,’’Proc. Internet Measurement Conf., ACM Press, 2007, pp. 15-28. 700 600 500 400 300 200 100 0 Web sear ch Web mail Video hosting MapReduce-wcMapReduce-wrHar monic mean Per for mance/total-cost-of-ownership impr ovement (%)
Figure 5. Performance per total-cost-of-ownership improvements from our unified design compared to a baseline midrange server.
5. C. Patel and A. Shah,Cost Model for Plan-ning, Development and Operation of a Data Center,tech. report HPL-2005-107R1, Hewlett-Packard, 2005.
6. A. Falcon, P. Faraboschi, and D. Ortega, ‘‘Combining Simulation and Virtualization through Dynamic Sampling,’’ Proc. IEEE Int’l Symp. Performance Analysis of Sys-tems and Software (ISPASS), IEEE CS Press, 2007, pp. 72-83.
7. R. Bedichek, ‘‘SimNow: Fast Platform Sim-ulation Purely in Software,’’ Proc. Hot Chips 16, IEEE CS Press, 2004; http:// www.hotchips.org/archives/hc16/2_Mon/ 15_HC16_Sess4_Pres1_bw.pdf.
8. L. Barroso, J. Dean, and U. Holzle, ‘‘Web Search for a Planet: The Google Cluster Architecture,’’ IEEE Micro,vol. 23, no. 2, 2003, pp. 22-28.
9. X. Fan, W. Weber, and L. Barroso, ‘‘Power Provisioning for a Warehouse-Sized Com-puter,’’ Proc. 34th Int’l Symp. Computer Architecture(ISCA-34), ACM Press, 2007, pp. 13-23.
10. P. Ranganathan et al., ‘‘Ensemble-Level Power Management for Dense Blade Serv-ers,’’Proc. 33rd Int’l Symp. Computer Architec-ture(ISCA-33), ACM Press, 2006, pp. 66-77. 11. M. Ekman and P. Stenstrom, ‘‘A Cost-Effective
Main Memory Organization for Future Serv-ers,’’Proc. IEEE Parallel and Distributed Proc-essing Symp.(IPDPS), IEEE Press, 2005. 12. T. Kgil and T. Mudge, ‘‘Flashcache: A NAND
Flash Memory File Cache for Low Power Web Servers,’’Proc. Int’l Conf. Compilers, Architecture, and Synthesis for Embedded Systems (Cases), ACM Press, 2006, pp. 103-112.
Kevin Lim is a PhD candidate in the Computer Science and Engineering Depart-ment at the University of Michigan. His research interests include data-center-level architectures, memory systems, and simulators. Lim has an MSE in computer science and engineering from the University of Michigan. Parthasarathy Ranganathan is a distin-guished technologist at Hewlett-Packard Labs. His research interests include systems archi-tecture and power efficiency. Ranganathan
has a PhD in electrical and computer engineering from Rice University. He is a senior member of the IEEE and ACM. Jichuan Chang is researcher at Hewlett-Packard Labs. His research interests include computer systems architecture and memory systems. Chang has a PhD in computer science from the University of Wisconsin-Madison. He is a member of the ACM. Chandrakant Patel is a Hewlett-Packard Fellow and director of the Sustainable Information Technology Laboratory at Hewlett-Packard Labs. His research interests include creating an IT ecosystem to enable net-positive impact on the environment. Patel has an MS in mechanical engineering from San Jose State University and is a licensed professional mechanical engineer in California. He is an IEEE Fellow.
Trevor Mudge is the first Bredt Family Professor of Computer Science and Engineer-ing at the University of Michigan. His research interests include computer architec-ture, VLSI, and compilers. Mudge has a PhD in computer science from the University of Illinois, Urbana-Champaign. He is a member of the ACM, the Institution of Engineering and Technology, and the British Computer Society, and is a Fellow of the IEEE. Steven K. Reinhardtis a Fellow in AMD’s Research and Advanced Development Labs and an adjunct associate professor at the University of Michigan. His research inter-ests include computer system architecture. Reinhardt has a PhD in computer sciences from the University of Wisconsin-Madison. He is a member of the IEEE and ACM.
Direct questions and comments about this article to Kevin Lim, Univ. of Michi-gan, 2260 Hayward St., CSE, Ann Arbor, MI 48109; [email protected].
For more information on this or any other computing topic, please visit our Digital Library at http://computer.org/csdl.