VISUALIZING PIPELINE DREDGE PROJECT SCHEDULES
USING 4D ANIMATION OF OBJECTS IN GOOGLE EARTH
Derek Wilson1
ABSTRACT
Visualizing the relationships between dredged material placement design and pipeline dredge project schedul-ing presents a challengschedul-ing and complex problem in pipeline dredge project management. The Dredgschedul-ing Knowledge Base Expert System (DKBES) Pipeline Scheduling and Visualization Program provides a graph-ical user interface on a Google-Earth platform that can produce a visual time projection of a pipeline dredge project schedule. This graphical user interface produces a 4 dimensional (4D) animation of the dredge project process based on temporal variation of the 3D dredge project features such as the navigation channel and dredged material placement sites. This paper discusses how the graphical user interface accepts user input of the initial dredge project parameters, executes an existing pipeline dredge scheduling methodology to formu-late a range of possible pipeline dredge project scenarios, and transformu-lates a given dredge project schedule into a 4D animation of the 3D project parameters. This paper further compares this visualization methodology to previous efforts of 4D modeling within similar engineering disciplines to gain a current perspective of modeling capabilities and limitations. Furthermore, this paper states how this research effort may prove useful to pipeline dredge project managers who must coordinate many project decisions based on a highly dynamic and constantly shifting project environment.
Keywords: Pipeline Dredge Hydraulic Analysis, Slurry Transport Using Centrifugal Pumps, 4D Project Scheduling and Modeling, Pipeline Dredge Booster Pump Analysis, Expert System Programming
INTRODUCTION
The DKBES Pipeline Dredge Scheduling and Visualization Program uses Google Earth as a platform for a graphical user interface (GUI) for developing a pipeline dredge schedule based on user input. It then outputs the results to an animation sequence that simulates the pipeline dredge process. Bansal and Pal (2008) and Koo and Fischer (2000) developed and analyzed this type of 4D modeling using GIS and CAD, respectively. Their work concentrated in the construction engineering environment and met with encouraging results as a planning, schedule analysis and communications tool. The DKBES Pipeline Dredge Scheduling and Visualization Program attempts to mirror their success by developing a program where users can input the pipeline dredge components of a dredging project and view an animation sequence of the resulting project. The DKBES starts with three fundamental components of a pipeline dredge project: pipeline dredge, naviga-tion channel and dredged material placement site (DMPS). Figure 1 illustrates these components operating in the pipeline dredge project. The attributes of these components determine the performance metrics and feasibility of the dredge project. A rules–based system uses stored procedures to determine performance metrics, filter out invalid solutions, and develop the output display so users can view possible solutions. Performance metrics range from time and cost of project, to environmental benefit resulting from wetlands creation with dredged material, to whether or not a DMPS has the volumetric capacity to accept the dredged material. Slurry transport principles and pump and pipeline hydraulic analysis determine the production rate and energy consumption rate of a pipeline dredge project given the component attributes and geometric data. The DKBES uses a pipeline analysis program to determine the production and energy consumption rates given the dredge component attributes using Wilson et al. (1997) slurry transport principles along with pump and pipeline hydraulic principles. Overall, the DKBES Scheduling and Visualization Program can provide dredge planners with a sound method to develop and simulate a pipeline dredge project from start– to–finish given available resources as well as the ability to explore potentially more ecologically beneficial alternatives within time, resources, and budget.
1Research Hydraulic Engineer, U.S. Army Corps of Engineers, Coastal and Hydraulics Laboratory, 3909 Halls Ferry Road,
Vicksburg, Mississippi 39180, T: 601-634-4174, Fax: 601-634-3080, Email: [email protected]
Figure 1: DKBES pipeline dredge project components in operation.
LITERATURE REVIEW
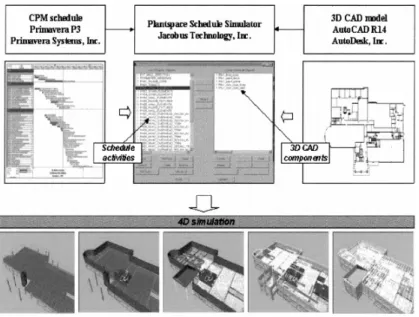
Koo and Fischer (2000) studied the advantages of a 4D CAD model applied to construction engineering. They directly researched building construction that used a 4D CAD model in conjunction with a traditional Critical Path Method (CPM) to plan and evaluate the construction process. The result of their 4D model was a CAD animation sequence of the project area illustrating the construction components as they were built in succession. Figure 2 illustrates this animation sequence based on the construction schedule and components. Koo and Fischer (2000) concluded that this 4D model provided several distinct advantages to the various staff involved in the planning process. First, the “4D model increased the comprehensibility of the project schedule”. Users with various levels of experience could “identify problems with the project schedule” and “allocate resources more effectively” as a direct result of being able to visualize the construction plan more clearly. Furthermore, staff members could “identify problems pertaining to space restrictions” in the construction area far more effectively than by using a CPM bar chart alone which “provides little information pertaining to the spatial context and complexities of the project components” (Koo and Fischer, 2000).
Figure 2: Construction project animation sequence based on schedule and design components in CAD. Taken from Koo and Fischer (2000)
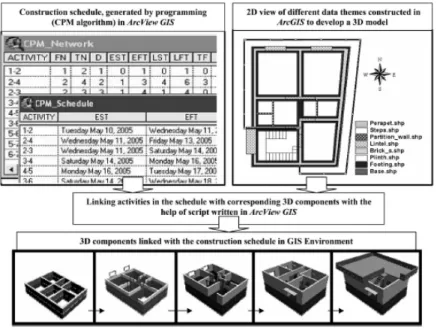
Bansal and Pal (2008) pursued a 4D model construction process model similar to Koo and Fischer (2000). Bansal and Pal (2008), however, used GIS as the platform to build a 4D model by animating the 3D project components over time. Figure 3 illustrates their results. Bansal and Pal (2008) cited that GIS has the advantage as an information system that can “handle both spatial and attribute data”. Spatial data represent a component’s geographical coordinates and geometry while attribute data describe the physical and functional characteristics of a component. Bansal and Pal (2008) concluded that the 4D model simulation of a medium sized building allows “easier understanding of the project as well as identify potential problems”. Furthermore, the GIS interface “allows users to manipulate the schedule and 3D components in a single environment, rapidly generating alternatives” if necessary(Bansal and Pal, 2008).
Figure 3: Construction project animation sequence based on GIS 3D components. Taken from Bansal and Pal (2008)
DKBES PIPELINE DREDGE PROJECT SCHEDULING
The DKBES Pipeline Dredge Scheduling and Visualization Program formulates a resulting dredge project or several possible dredge projects given user input of dredge components. A dredge project may include a navigation channel broken down into several channel sections or stations. The project may also include several DMPS to choose from or schedule in sequence. Furthermore, the scheduling program must calculate the time required to complete the dredging assignment given only the dredge pump and pipeline component attributes. Therefore, the DKBES Pipeline Dredge Scheduling and Visualization Program solves two impor-tant parameters, the sequencing of the dredge components through the dredging project and the resulting dredge pump and pipeline system interaction at each step along this dredge sequence.
Schedule Formulation
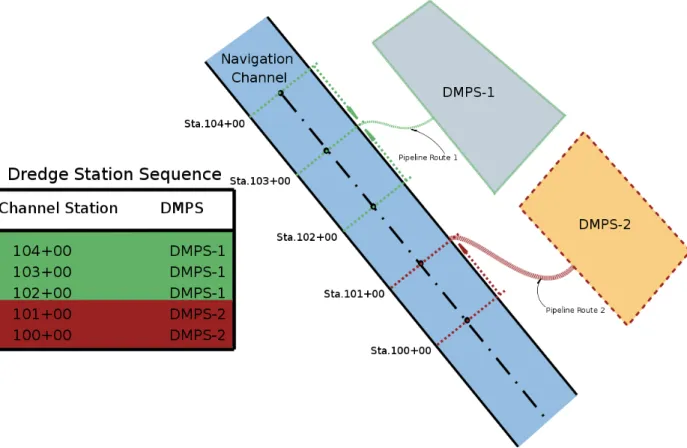
The DKBES Pipeline Dredge Scheduling and Visualization Program determines the operating level of the pipeline dredge at each channel location along its respective pipeline route to the designated DMPS. The DKBES divides these sections along the channel station lines. Figure 4 illustrates this principle. The DKBES starts with a list of channel stations scheduled for dredging, available pipeline routes and DMPS. The pro-gram uses one dredge for each model simulation for simplicity. The DKBES then formulates sequences of all possible combinations of channel stations and available DMPS as candidate dredge projects. ASCE (1987) refers to this process as “Plan–Generate Testing” Each candidate dredge project will correspond to dredging the navigation channel stations in sequence using the available DMPS. Figure 5 illustrates this principle. This concept would help users decide how to schedule DMPS usage. The most economical solution would
Figure 4: Individual channel station with pipeline route and DMPS.
involve the shortest pipeline route from each channel station to DMPS. However, users may consider more ecologically sustainable options such as scheduling a DMPS that has the appropriate designation as a po-tential restored wetland despite its longer pipeline and increased expense. The DMPS formulates multiple dredge station sequences that make up every possible combination of dredge station projects available to accomplish the overall dredge project.
Slurry Transport and Pipeline Hydraulic Analysis
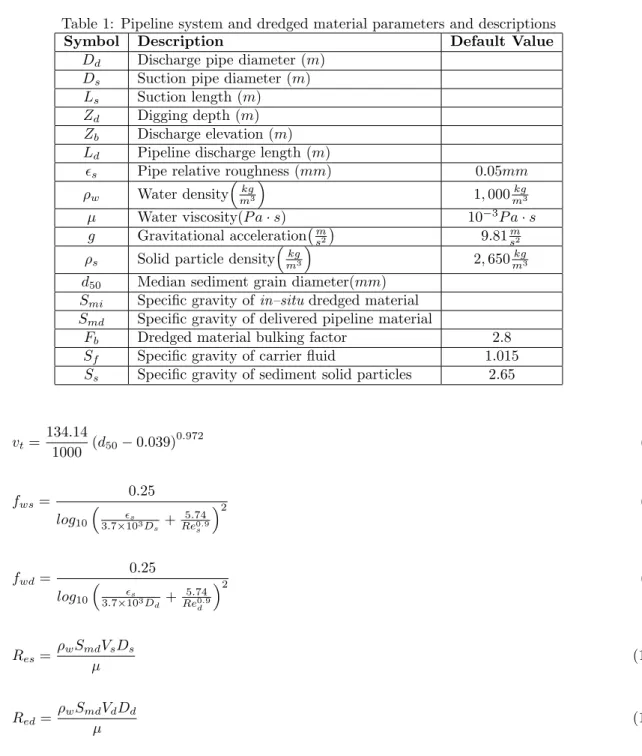
The DKBES analyzes the pump and pipeline hydraulics of each of the dredge station projects to calcu-late the production rate and project time as energy consumption which recalcu-lates to dredging cost. Each pipeline dredge has installed dredge pumps in the hull and on the dredge ladder. In addition, significantly long pipeline routes require booster pumps located along the pipeline route to maintain production. The Pipeline Dredge Analytical Program (Wilson, 2008) uses the fundamental attributes of a pipeline dredge system to compute the operating parameters of a pump and pipeline system. These attributes include the pipeline system parameters and sediment and carrier fluid properties as follows in Table 1.
The program uses these parameters coupled with dredge pump and pipeline hydraulics (Herbich, 2000) and slurry transport principles (Wilson et al., 1997) to determine the total dynamic head (T DH) required of the pump in meters of water as:
T DH=ZbSmd+Zd(Smd−Sf) +Smd
Vd2
2g (1 + Σkd) +Ldimd+SmdΣks Vs2
2g +Lsims (1)
VdandVsare the discharge and suction velocities, respectively inm/s. Σkdand Σksare the sum of all minor
loss coefficients on the discharge and suction pipelines, respectively. Figure 6 diagrams these factors on the pipeline hydraulic system illustrating the energy grade line (EGL) and hydraulic grade line (HGL) of the
Figure 5: Channel station sequence with station numbers corresponding to placement sites.
pump and pipeline system. imdandims are the respective discharge and suction pipeline friction gradients
inm/mof water defined as follows:
imd= fwdVd2 2gDd + 0.22(Smd−1) V 50d Vd 1.7 (2) ims= fwsVs2 2gDs + 0.22(Smd−1) V 50s Vs 1.7 (3)
Friction gradients represent the head loss due to friction over unit length of pipeline. V50dandV50srepresent
the stratification velocity of the solid material in the discharge and suction pipelines, respectively inm/sas follows: V50s=w r 8 fws cosh 60d50 1000Ds (4) V50d=w r 8 fwd cosh 60d50 1000Dd (5) w= 0.9vt+ 2.7 (ρ s−ρw)gµ ρ2 w 13 (6) Table of Contents
Table 1: Pipeline system and dredged material parameters and descriptions
Symbol Description Default Value
Dd Discharge pipe diameter (m)
Ds Suction pipe diameter (m)
Ls Suction length (m)
Zd Digging depth (m)
Zb Discharge elevation (m)
Ld Pipeline discharge length (m)
s Pipe relative roughness (mm) 0.05mm
ρw Water density kg m3 1,000mkg3 µ Water viscosity(P a·s) 10−3P a·s g Gravitational acceleration ms2 9.81ms2
ρs Solid particle density
kg m3
2,650mkg3
d50 Median sediment grain diameter(mm)
Smi Specific gravity ofin–situdredged material
Smd Specific gravity of delivered pipeline material
Fb Dredged material bulking factor 2.8
Sf Specific gravity of carrier fluid 1.015
Ss Specific gravity of sediment solid particles 2.65
vt= 134.14 1000 (d50−0.039) 0.972 (7) fws= 0.25 log10 s 3.7×10³D s + 5.74 Re0.9 s 2 (8) fwd= 0.25 log10 s 3.7×10³D d + 5.74 Re0.9 d 2 (9) Res = ρwSmdVsDs µ (10) Red= ρwSmdVdDd µ (11)
The Pipeline Dredge Analytical Program computes the production rate for a pipeline dredge system given the pump, pipeline and dredged material characteristics as follows:
˙ M =QSmd−Sf Smi−Sf ×3600 (12) Q=Vd πD2 d 4 (13) Smd= Smi−Sf Bf +Fb (14)
Figure 6: Pipeline dredge pump and pipeline system illustrating the energy and hydraulic grade lines.
where ˙M represents production rate (m3/hr) ofin–situdredged material,Qrepresents Volumetric flow rate (m3/s). In addition to these production metrics, the program also calculates the stationary bed velocity of the slurry material in the pipeline. This velocity represents the point where the dredged material begins to settle in the pipe due to insufficient velocity to keep the material in suspension. Wilson et al. (1997) provides an empirical formula for the stationary bed velocity,Vsm, inm/sas:
Vsm=k 0.0018 fwd 0.13q 2gDd(Ss−Sf) (15) k= 6.75c α r(1−cαr) 2 (crm<0.33) 6.75 (1−cr)2β 1−(1−cr)β otherwise (16) cr= 1.67 Smd−Sf Ss−Sf (17) α=−log (3) logcrm (18) β=− log (1.5) log (1−crm) (19) crm = 0.16D0d.40d −0.84 50 S s−Sf 1.65 −0.17 (20)
The output parameters of production and power determine how much time a dredge operation will take and how much fuel and energy it will consume. Such parameters can provide the fundamental attributes of a dredge project to determine the project’s total aggregate cost and duration.
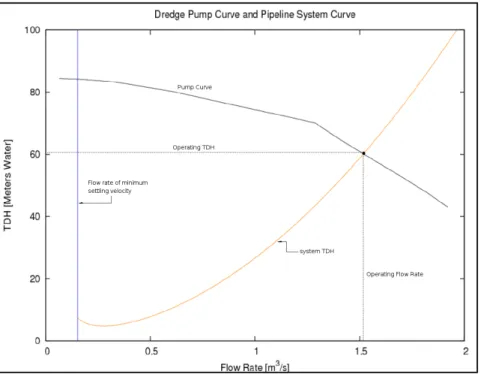
Figure 7: Dredge pump and system performance curves for single pump.
A dredge pump will operate at the point where TDH equals the TDH capability of the pump. Each dredge pump will operate according to its dredge pump performance curve. The Pipeline Dredge Analytical Program uses a pump’s performance curve to determine the operating point of a pump and pipeline system. The pipeline system TDH from Equation 1 will plot on a pump curve as shown in Figure 7.
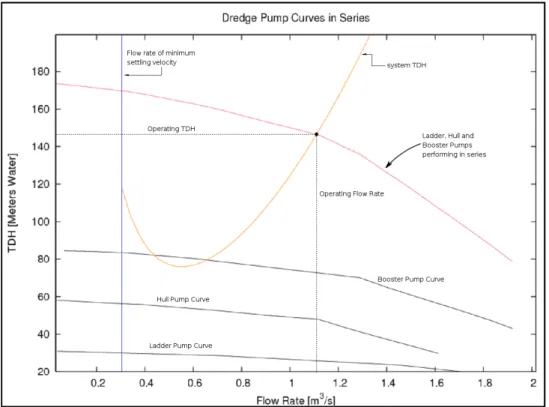
For pumps in series, the DKBES calculates the overall pump system performance by adding the TDH of each pump in the series for a given flow rate. Each pump adds hydraulic head to the pipeline system at the same flow rate in the pipe. Therefore, the pump and pipeline system will interact at the intersection between the system curves for the pipeline and a composite pump curve that sums the TDH of each pump in the series for any given flow rate. Figure 8 illustrates this concept.
The DKBES performs this analysis for each station scheduled for dredging each with a unique set of parame-ters of pipeline length between channel station and DMPS as well as booster pumps along the pipeline routes. As a result, each channel station to DMPS combination will contain attributes for effective production rate, and dredged material volume. The DKBES then calculates the total time, T, in hours required to dredge the volume ofin–situ dredgedmaterial, ∀ol, inm3at each channel station as:
T = ∀ol
˙
M(1/3600) (21)
The DKBES calculates the average power consumption and total energy consumed dredging each channel station as:
E=P×T (22)
P =ρwgQ T DH
Figure 8: Dredge pump and system performance curves for pumps in series.
whereErepresents the energy consumption by the pump inkW·hrandPrepresents the total pump system power inkW andηrepresents Pump efficiency. The DKBES further calculates diesel fuel consumption based on marine diesel engine consumption rates of
Fuel Volume=CrE (24)
where F uel V olume is measured in Liters and Cr is a typical marine diesel fuel consumption rate of
25.44L/kW·hr.
GRAPHICAL USER INTERFACE DISPLAY
The DKBES Pipeline Dredge Scheduling and Visualization Program provides users with a graphical user interface (GUI) to construct a pipeline dredge project for model analysis based on user input of the original dredge components of dredge, navigation channel, and DMPS. The GUI allows users to build these objects on a satellite image of the dredge project area while requiring little computation effort for the project parameters on behalf of the users. The GUI reads in the attributes the user assigns to the dredge components via an attributes window and calculates the remaining parameters based on geographic identities of the components. Google Earth Objects
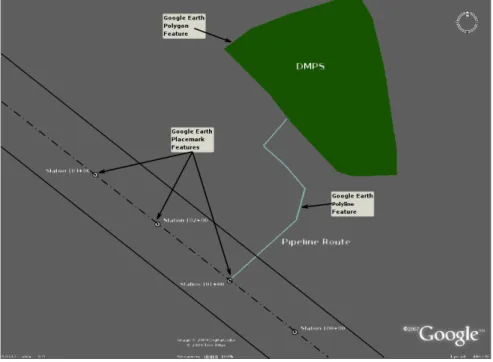
The DKBES uses Google Earth as the platform for the Scheduling and Visualization program. Google Earth is free of charge in the public domain. Google Earth displays high resolution satellite imagery of any point of interest on the globe. Google Earth handles editing of on–screen features in the form of place-marks, polygons and polylines. Figure 9 illustrates these features on the Google Earth interface as dredge components for the dredge, DMPS, navigation channel, pipeline routes and booster pumps.
The DKBES Pipeline Dredge Scheduling and Visualization Program uses placemarks in Google Earth to
Figure 9: Dredge components represented by Google Earth objects.
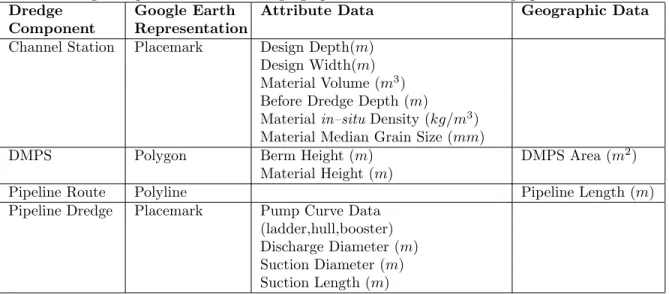
represent point objects such as dredges, navigation channel stations and booster pump locations. The pro-gram uses polygons to represent a DMPS area and polylines to represent pipeline routes from the navigation channel to the DMPS. The user enters the attribute data for these dredge components within the user inter-face. However, the program automatically calculates other important parameters from the geographic data of the dredge components, minimizing the need for user input. Table 2 describes the attribute data and geographic data for each dredge component
Time-Elapse 3D to 4D
The DKBES Pipeline Dredge Scheduling and Visualization Program formulates the dredge station sequences based on the the dredge components the user enters on the Google Earth user screen. The program then displays a list of possible dredge project solutions. Figure 10 illustrates a sample dredging sequence result timeline.
The DKBES Scheduling and Visualization Program can then animate any dredge station sequence from start to finish following the timeline of the dredge station sequence. Figure 11 illustrates the Google Earth animation of a dredge station sequence. The program first translates the DMPS and navigation channels into 3D objects on the Google Earth interface. This representation shows the before dredge channel depths relative to the design depth to give a sense of channel conditions before and after dredging. Furthermore, this representation illustrates the resulting dredged material level in the DMPS relative to the berm level as a result of dredging the channel. Google Earth then animates these 3D objects, displaying the resulting attributes of the DMPS and navigation channel as a result of the dredge project progressing through time.
EXAMPLE APPLICATION
An example application of the DKBES Scheduling and Visualization program illustrates how the program formulates dredge station sequences from user input and stored data. This example starts with the minimum level of user input required to show the versatility of the DKBES visualization program.
Houma Navigation Channel in coastal Louisiana serves as the location for the example navigation dredge project. Figure 12 illustrates the example location and geographic components. Table 3 shows the dredging
Table 2: Dredge component attribute and geographic data obtained from the graphical user interface. Dredge Google Earth Attribute Data Geographic Data Component Representation
Channel Station Placemark Design Depth(m) Design Width(m) Material Volume (m3) Before Dredge Depth (m)
Materialin–situDensity (kg/m3) Material Median Grain Size (mm)
DMPS Polygon Berm Height (m) DMPS Area (m2) Material Height (m)
Pipeline Route Polyline Pipeline Length (m)
Pipeline Dredge Placemark Pump Curve Data (ladder,hull,booster) Discharge Diameter (m) Suction Diameter (m) Suction Length (m)
requirement parameters including channel stations and their respective dredged material volumes. Table 4 shows the dredge system components and dredged material properties. Figure 13 illustrates the dredge pump curves used for the example application.
Table 3: Example application dredged material volumes and channel stations. Station Dredged material
Volume (m3) 1245+00 16,894 1246+00 23,880 1247+00 25,410 1248+00 25,512 1249+00 20,612 1250+00 29,712 1251+00 30,902 1252+00 35,102 1253+00 26,212 1254+00 17,182 1255+00 26,982 1256+00 23,951 1257+00 20,451 Table of Contents
Figure 10: Resulting dredge sequence timeline.
Table 4: Example application pipeline system and dredged material parameters.
Symbol Description Value
Dd Discharge pipe diameter (m) 0.51m (20in)
Ds Suction pipe diameter (m) 0.61m (24in)
Ls Suction length (m) 9.15m (30ft)
Zd Digging depth (m) 3.67m (12ft)
Zb Discharge elevation (m) 3.05m (10ft)
d50 Median sediment grain diameter (mm) 0.1mm
Smi Specific gravity of in–situdredged material 1.53
Fb Dredged material bulking factor 2.0
Application Results
The DKBES Scheduling and Visualization Program determined 14 possible dredge station sequences to dredge the navigation channel with the operating conditions shown in Table 5. Only 8 of these stayed within capacity of the DMPS available. Sequence 7 is the most favorable in terms of project duration and fuel consumption as a result of the dredging process. Table 6 describes the individual channel station dredging project performance metrics. Figure 14 illustrates the animation linked to the dredging schedule with the dredge components to produce the animation sequence of the dredging project.
Figure 11: Google Earth dredging sequence animation frames.
Figure 12: Example application pipeline dredge project components.
Table 5: DKBES Scheduling and Visualization Program Results.
Sequence DMPS-1 DMPS-2 Fuel Project Project
Number Remaining Clearance [m] Remaining Clearance [m] Consumption [L] Duration [days] Valid [T/F] 1 15.01 1.43 6,120.4 4.9200 True 2 12.90 2.60 6,049.1 4.8500 True 3 10.65 3.86 5,971.8 4.7800 True 4 8.39 5.12 5,893.6 4.7100 True 5 6.56 6.13 5,829.3 4.6500 True 6 3.93 7.60 5,735.7 4.5700 True 7 1.19 9.12 5,637.6 4.4800 True 8 -1.92 10.85 5,518.7 4.3800 False 9 -4.24 12.14 5,425.3 4.3000 False 10 -5.77 12.99 5,360.8 4.2400 False 11 -8.16 14.32 5,254.2 4.1400 False 12 -10.28 15.50 5,160.0 4.0600 False 13 -12.09 5,080.1 3.9900 False 14 0.59 6,170.0 4.9700 True
Table 6: Sequence 7 schedule results.
Station DMPS Pipeline Dredged Average Duration Fuel
Number Length Material in–situ [hr] Consumption [m] Volume (m3) Production Rate (m3/hr) [L] 1245+00 DMPS-1 610.0 16,894.0 3,257.2 5.2 276.4 1246+00 DMPS-1 580.0 23,880.0 3,281.9 7.3 387.7 1247+00 DMPS-1 550.0 25,410.0 3,306.5 7.7 409.0 1248+00 DMPS-1 520.0 25,512.0 3,331.1 7.7 407.9 1249+00 DMPS-1 490.0 20,612.0 3,355.8 6.1 327.0 1250+00 DMPS-1 460.0 29,712.0 3,380.4 8.8 468.1 1251+00 DMPS-1 430.0 30,902.0 3,405.1 9.1 483.6 1252+00 DMPS-2 1,270.0 35,102.0 2,736.2 12.8 663.3 1253+00 DMPS-2 1,300.0 26,212.0 2,719.1 9.6 497.3 1254+00 DMPS-2 1,330.0 17,182.0 2,701.9 6.4 327.4 1255+00 DMPS-2 1,360.0 26,982.0 2,684.8 10.1 516.3 1256+00 DMPS-2 1,390.0 23,951.0 2,667.6 9.0 460.3 1257+00 DMPS-2 1,420.0 20,451.0 2,650.4 7.7 394.9 Table of Contents
PROGRAM RESULTS AND DISCUSSION
Similar to the GIS and CAD Scheduling and animation tools Koo and Fischer (2000) and Bansal and Pal (2008) introduced, the DKBES Pipeline Dredge Scheduling and Visualization Program combines engineering principles with graphic visualization to produce a detailed and descriptive schedule and animation of the pipeline dredge project. Similar to GIS and CAD applications, the DKBES offers versatile features that can determine component attributes from geographic data such as DMPS area or pipeline route length. The DKBES translates a DMPS and navigation channel into a 3D objects, giving the user a sense depth and height.
The DKBES Pipeline Dredge Scheduling and Visualization Program currently includes several key compo-nents that require refinement in order to reflect actual field conditions within the dredging environment. The DKBES currently unrealistically displays the DMPS material height and navigation channel before dredge depth as even surfaces. Future endeavors should include incorporating bathymetric surveys of the navigation channel to represent the true channel bed bathymetry. Furthermore, the DKBES requires a more thorough analysis of material in the DMPS to account for mounding as well as drainage, consolidation and dessication. Bulking factors also constitute an important variable relevant to pipeline dredge production. Currently, the DKBES uses a constant bulking factor. The bulking factor depends heavily on the depth of cut of the dredged material, cutterhead diameter and pipeline dredge geometry. Since the DKBES, already incorporates a wide array of pipeline dredge characteristics, future improvements should include using these parameters to more accurately estimate the bulking factor.
Although the Google Earth interface provides a versatile and viable platform on which to formulate a pipeline dredge project and view results in an animation sequence, future endeavors should include GIS development. GIS provides for far more complex analysis involving geospatial applications such as land leasing issues surrounding the DMPS, tighter land and water regulations and better communication with departments and programs already heavily involved with GIS. Further developments should also include a rating system for the multitude of dredge solutions the DKBES formulates from the dredge components. A rating system would assist dredge project planners in filtering out a range of environmentally sustainable dredging solutions. This rating system would weight the output parameters to give more precedence to projects that meet the planners criteria for cost relative to beneficial use of the dredged material. Planners would then have a concise list of pipeline dredging project solutions that place dredged material beneficially within budgetary constraints reaching a balance between ecology and economy.
CONCLUSIONS
The DKBES Pipeline Scheduling and Visualization Program can formulate useful dredge plans and schedules. The program requires minimal user input or calculation, incorporates dredge pump and pipeline hydraulic engineering principles and offers a hands–on GUI to import data and view the output results. The program allows users to input the dredge components as 2D objects, displays the output as 3D objects based on the component attributes, and animates the dredge project in 4D based on production analysis of the dredge components. The DKBES Pipeline Dredge Scheduling and Visualization Program, therefore, can offer a detailed analysis tool for experienced dredge operations managers and planners to seek out the most viable pipeline dredge project solution quickly and efficiently. This program can also serve as a training tool for personnel seeking a better understanding of the hydraulic pipeline dredging process. Furthermore, this program will provide personnel the capacity to more clearly communicate with regulatory agencies or interested public how a dredge project will affect their areas of concern. The development of 4D animation of project scheduling has so far proven highly effective in other engineering applications. The Pipeline Dredge Scheduling and Visualization Program will offer the same applicability to dredge engineering personnel adding a new dimension to pipeline dredge project planning and evaluation.
ACKNOWLEDGEMENTS
This paper summarizes the results of research conducted by the U.S. Army Engineer Research and Develop-ment Center, Waterways ExperiDevelop-ment Station. Funding was provided by the USACE Dredging Operations and Environmental Research Program. Permission to publish this information was granted by the Chief of Engineers.
References
ASCE (1987),Expert Systems for Civil Engineers: Technology and Application, first edn, American Society of Civil Engineers.
Bansal, V. and Pal, M. (2008), “Generating, Evaluating, and Visualizing Construction Schedule with Geo-graphic Information Systems”,J. Computing in Civil Engineering, ASCE.
Herbich, J. (2000),Handbook of Dredge Engineering, second edn, McGraw–Hill.
Koo, B. and Fischer, M. (2000), “Feasibility Study of 4D CAD in Commercial Construction”,J. Construction Engineering and Management, ASCE.
Wilson, D. A. (2008), “Pipeline Dredge Analytical and Scheduling Program”, Proc. Western Dredging As-sociation XXVIII, St. Louis, Missouri.
Wilson, K., Addie, G., Sellgren, A. and Clift, R. (1997),Slurry Transport Using Centrifugal Pumps, second edn, Blackie Academic and Professional.