PLEASE SCROLL DOWN FOR ARTICLE
On: 14 June 2011
Access details: Access Details: [subscription number 938663200]
Publisher Routledge
Informa Ltd Registered in England and Wales Registered Number: 1072954 Registered office: Mortimer House,
37-41 Mortimer Street, London W1T 3JH, UK
Communication Methods and Measures
Publication details, including instructions for authors and subscription information:
http://www.informaworld.com/smpp/title~content=t775653633
The Virtual Worlds Exploratorium: Using Large-Scale Data and
Computational Techniques for Communication Research
Dmitri Williamsa; Noshir Contractorb; Marshall Scott Poolec; Jaideep Srivastavad; Dora Caie
a University of Southern California, b Northwestern University, c University of Illinois at
Urbana-Champaign, d University of Minnesota, e National Center for Supercomputing Applications,
Online publication date: 14 June 2011
To cite this Article Williams, Dmitri , Contractor, Noshir , Poole, Marshall Scott , Srivastava, Jaideep and Cai, Dora(2011)
'The Virtual Worlds Exploratorium: Using Large-Scale Data and Computational Techniques for Communication Research', Communication Methods and Measures, 5: 2, 163 — 180
To link to this Article: DOI: 10.1080/19312458.2011.568373
URL: http://dx.doi.org/10.1080/19312458.2011.568373
Full terms and conditions of use: http://www.informaworld.com/terms-and-conditions-of-access.pdf
This article may be used for research, teaching and private study purposes. Any substantial or systematic reproduction, re-distribution, re-selling, loan or sub-licensing, systematic supply or distribution in any form to anyone is expressly forbidden.
The publisher does not give any warranty express or implied or make any representation that the contents will be complete or accurate or up to date. The accuracy of any instructions, formulae and drug doses should be independently verified with primary sources. The publisher shall not be liable for any loss, actions, claims, proceedings, demand or costs or damages whatsoever or howsoever caused arising directly or indirectly in connection with or arising out of the use of this material.
ISSN: 1931-2458 print / 1931-2466 online DOI: 10.1080/19312458.2011.568373
The Virtual Worlds Exploratorium:
Using Large-Scale Data and Computational
Techniques for Communication Research
Dmitri Williams
University of Southern California
Noshir Contractor
Northwestern University
Marshall Scott Poole
University of Illinois at Urbana-Champaign
Jaideep Srivastava
University of Minnesota
Dora Cai
National Center for Supercomputing Applications
The Virtual Worlds Exploratorium is a multidisciplinary project dedicated to the study of communication-related behaviors using data from massively multiplayer online games (MMOs). In a partnership with a corporation that hosts an MMO, a 20-person team of scholars is engaged in the study of behavior within a game and also game activities that parallel those in “real life” (e.g., economic activity, social networking, group processes). A key aspect of our approach is a unique multidisci-plinary collaboration of social and computational scientists to help advance the state of the research. This article discusses the methodological, measurement and orga-nizational challenges of the project, the game, the data, and several representative research streams. It also articulates several measurement issues that the research
This article was accepted for publication by David Ewoldsen, prior editor of this journal. Correspondence should be addressed to Dmitri Williams, 734 W. Adams Boulevard, Los Angeles CA 90089. E-mail: [email protected]
team has faced in order to provide best practices and lessons learned for others considering similar investigations.
Video games have exploded in popularity over the past decade. In the United States, it is estimated that 53% of adults and 97% of teenagers are now regular players (Lenhart, Jones, & Macgill, 2008), and the U.S. video game industry had nearly $20 billion in sales in 2009 (Satariano, 2010). As the Internet has become a larger part of everyday life (Fallows, 2004; Wellman & Haythornthwaite, 2002), so too have networked games, with 67% of U.S. teens now regularly playing some game online (Rideout, Roberts, & Foehr, 2005). While many games are one-person affairs, 76% of game play among teens is now social (Lenhart, Kahne, et al., 2008). One class of games are so-called massively multiplayer online games (MMOs)—games that are always on, in which players maintain a regular charac-ter who grows and changes, and in which many players participate in long-charac-term social groups. Publicly available data (see mmogchart.com) show that the total user population of massively multiplayer online games reached more than 47 mil-lion subscribers by the middle of 2008, with dramatic increases occurring over the previous five years. Use of these media has moved from a niche to a mainstream activity, with many games hosting several million subscribers.
MMOs present tempting research opportunities and are of interest in their own right as technological and social phenomena. Questions concerning what other activities MMOs replace, their health impacts, and their social impacts are compelling, and these questions are traditional in new media research (Wartella & Reeves, 1985). Castronova (2005) has explored, for example, the economics of MMOs and found massive economies within the games and parallel real economies springing up around games in which players purchase goods for use in the game with real money.
MMOs are also of interest because of what we might be able to learn about the real world from studying virtual ones. In games such asWorld of Warcraft, char-acters interact, engage in conversations, form groups, form networks, undertake various tasks, barter, and perform many other activities that parallel those in real life. It may therefore be possible to learn about many important social phenomena from studying them. This newly forming area of science is known as “mapping” and has a long list of methodological restrictions and validity checks (Williams, 2010). If done correctly, such mapping work may eventually enable social sci-entists to use virtual worlds as controlled test beds for some kinds of behaviors in large-scale experiments. E-commerce organization such as Amazon.com have shown that the Web can be used to conduct very effective studies in consumer psychology, price preference, and so forth (Kim & Srivastava, 2007).
There have been a number of ethnographies (Kendall, 2002; Taylor, 2006) and experimental investigations of virtual world game behavior (Bailenson, Beall,
Blascovich, Loomis, & Turk, 2005; Williams, 2006; Williams, Caplan, & Xiong, 2007), and the literature is growing rapidly. However, there has been little sys-tematic and generalizable research on activities in MMOs, largely due to the difficulties of securing access to game data controlled by profit-making compa-nies. Most basic survey work, for example, has been undertaken in self-selected samples on separate Web sites, while no research team has been able to see the actual logs generated by play (Yee, 2006). The Virtual Worlds Exploratorium Project has obtained access to this proprietary in-game player data for the game EverQuest II(EQII) and can directly studyplayersusing quantitative and, when appropriate, complementary qualitative methodologies. This paper will provide background on this methodology, some of the investigations exploring communi-cation research issues, and the challenges of working with large-scale data from an online system. Many of the issues we confronted were novel ones rising from the twin challenges of working with large data sets and working with an inter-disciplinary team. We are of course not the first group to do the latter, but given that the large-scale data processing required working with computer scientists, it is worth explaining how that relationship worked. We expect that with the rise of ever larger datasets, such relationships and projects will become more common across the social sciences, and not just through gaming. We suggest that many of the lessons we have learned will apply to other large-scale communication activ-ities online. Still, each domain of large-scale social science is going to have its unique features. So, for the sake of background, we begin with a basic overview of the game itself and the theoretical frameworks involved, and then proceed to discuss the methodological challenges and outcomes.
INTRODUCTION TO THE VIRTUAL WORLDS EXPLORATORIUM (VWE) PROJECT
The virtual world under investigation isEQII, an MMO developed by Sony Online Entertainment (SOE). EQII was launched in November 2004 and has roughly 175,000 active members playing across dozens of parallel servers hosted in the United States, Europe, and Asia (Schiesel, 2007). Our research team of about 20 scholars from four universities (plus several collaborators from other universities) with expertise in computer science, social network analysis, online games, and group behavior established a collaboration with SOE to analyze data from its U.S.-dedicated servers.
Because games and online worlds vary, it is important to consider the game’s social context and rules before embarking on a systematic investigation (Williams, 2005). Although no two MMOs are exactly alike, EQII’s features are broadly similar to those of most other popular titles on the market, 85% of which are also fantasy-based titles with the same basic goals, social structures, and mechanisms
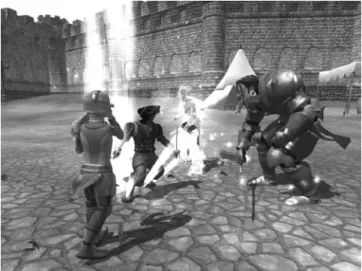
(White, 2008). In all of these games, players create a character and advance that character through challenges in a social milieu, typically banding together with other players for help and companionship. For each character, a class is chosen to fit some variation of the three basic archetypes found in nearly every fantasy MMO: damage-dealer, damage-mitigator, and damage-healer. Each archetypal role has different capabilities, weaknesses, and strengths, and the choice of class then determines how players develop their characters and how they will inter-act with game environment and other players. When banding together, players join organizations called “guilds” that are facilitated by the game software. These guilds have leadership hierarchies and complex organizational tools for mobiliz-ing group events and tasks (Reeves, Malone, & O’Driscoll, 2008), includmobiliz-ing their own private chat channels and private, shared interfaces (see Figure 1).
Performance metrics for groups and individuals inEQII involve the success rates for combat, gaining experience, exploring areas, creating items, and gather-ing resources. As players rise in ability and power, they are prompted to enter new and unexplored areas. New abilities allow players to deal with and fend off ever more exotic and dangerous creatures and to acquire their accompanying treasures. There are also various metrics attached to craftwork, including gaining currency by selling or gaining items through barters. These various “mechanics,” or game incentive schemes (Sellers, 2006), prompt players to act together and give rise to a large number of social and communication phenomena worth studying.
FIGURE 1 Guild members band together to accomplish large tasks that cannot be completed alone, such as defeating a tough enemy.
For example, in an exploratory phase of the VWE project, Williams, Yee, and Caplan (2008) investigated the psychological motivations for game play. Subsequent papers focused on gender differences (Williams, Consalvo, Caplan, & Yee, 2009), gender swapping with avatars (Huh & Williams, 2009), role play-ing, criminal “gold farming” activity (M. Ahmad, Keegan, Srivastava, Williams, & Contractor, 2009), problematic use (Caplan, Williams, & Yee, 2009), and even economic activity (Castronova et al., 2009). These initial explorations drew on the traditional communication science toolkit of understanding why a person engages in the activity (uses and gratifications) and what the effects of the medium are on individuals. Because the records also afforded the construction of social network-ing data, there was an opportunity to focus on the interactions and to draw on the more recently developed body of network theory. As described by Monge and Contractor (2003), the goals of players within EQII can be broadly character-ized as exploring, exploiting, mobilizing, bonding, and swarming—activities that also occur in real life and are part of a well-understood theoretical framework for studying communication networks.
As detailed by Williams et al. (2006), group and guild-based dynamics in almost all MMOs follow a regular series of conventions, norms, and patterns. These various group forms offer intriguing metrics for tracking group-related activities. The basic team unit inEQIIis an ad hoc cluster called a “group,” which can contain up to six players (in some games this base unit is five players). Guilds are the long-term associations within MMOs, and inEQII they come with their own bank, hall, chat system, and hierarchy tree. The highest level of mobilization takes place within a “raid,” which is the assembly of a large group (typically 24 or 25 players in most MMOs now) to take on a large challenge, usually over several hours. A “raid group” is a complex team requiring specific player roles and skills, and its management is often a daunting task. The groups resemble action teams in the real world, for example, an electric line repair crew or operating room teams, in that they have short-term projects with clear goals and standards for evaluation. An example of a raid-based challenge would be a series of quests that unlock a special dungeon called Trakanon’s Lair. Once within the dungeon, the raiding party must confront Trakanon, a large blue dragon, who can only be defeated by carefully timed and coordinated use of player abilities in a fight which lasts around eight minutes. Often, a handful of player mistakes will cause the entire group to fail—in this case being killed by the dragon or lowered into a pit of inhospitable lava.
Using the network theory tools and applying them to this rich set of interaction-based data, the team has reported findings about trust among group members (Ratan, Chung, Shen, Poole, & Williams, 2010, in press), homophily, and prox-imity among group members (Huang, Shen, Williams, & Contractor, 2009), and how experts function within these groups (Huffaker et al., 2009).
THE VWE DATA: TYPES AND EXEMPLAR USES
The EQII dataset contains four major data types, namely, log files, network sources, cumulative cross-sectional files, and standard survey data. It contains cross-sectional and longitudinal data about individuals and their interactions. Combining these different types allows for a rich data set, which is obtained by matching each distinct source to a single universal ID #. It is worth noting that the game-based data are comprehensive; that is, there is no sampling and every action, interaction, and transaction that takes place within the game is recorded. This data are also an unobtrusive measure of behavior in the game, since the data are collected automatically and the collection does not disturb play or alert the players in any way. The data are captured at second resolution and contain approx-imately 500 variables at a much higher level of specificity compared to past work (Webb, Campbell, Schwartz, & Sechrest, 1966). Finally, there are opportunities in this dataset to test the validity of self-report measures more generally, contrasting what someone said about what they did with what they actually did, providing a potent tool to address the usefulness of a self-report measure.
Each of the data types is discussed in turn, with exemplar studies and notes about how the data types should be conceived and can lead to different forms of analysis in other research domains.
Game Server Data: Longitudinal
Each action is recorded as an entry with a tag for the character, the action, some outcome, and fields for location and time. The use of this data is illus-trated through our first project, which dealt with the economy of the game world (Castronova et al., 2009). For macro-level economists, the basic measures of inter-est are based on cumulative data, for example, price indices, inflation, and GDP. In the real world, these measures are difficult to collect with accuracy as they are the sum total of hundreds of millions of individual actions, most of which are not tracked. For example, to estimate car sales in the real world, the government does not track each individual car sold, and instead calls a sample of dealerships and asks for self-reported figures from their lot for the month.
For example, to know the inflationary pressure on a country (or state or city), one needs to track every piece of currency flowing in and out of it. InEQII, the economy log has a variable for this, tracking every incoming and outgoing piece of copper coming to every player as individual entries. To create the data needed at the monthly level for the whole society, we ran SQL queries that aggregated the value of the “incoming” currency and “outgoing” currency variables for one-month periods. With one value for every one-month, we could see the total money flowing into and out of each system and then use economic theory to suggest whether that surplus or deficit of currency would drive prices up or down (inflation or deflation). Prices could be likewise extracted with SQL queries and watched as
an index. These meta-level variables could then be charted in figures showing changes over time and plugged into simple models.
Researchers can also identify serendipitous “real” events and changes in virtual systems. Any large change represents the opportunity for natural experiments and powerful observations that are rare in communication research. Some of the most potent research ever done in communication arose when a city or an area first acquired a communication technology and was then compared to one without that technology (Lowery & DeFluer, 1995). Such large-scale social events are rare in the real world, and impossible on a truly massive scale. Yet this is precisely what virtual worlds afford.
In our case, the economics team benefited from a natural experiment within the data period. Because of increased demand for the game, a new server was launched and slowly populated. Since the servers are built with the same rules and geography and contain nearly identical populations, they function as control groups for one another. In this case, the team was able to test the hypothe-sis that economic behavior was conhypothe-sistent across servers and driven largely by the game itself. By watching the data flows, the team was able to see the new server start from zero and then slowly approach and mimic the other servers’ eco-nomic patterns. These observations were simple extensions of the measures noted above—inflation and price indexes, with the SQL extractions and calculations done a second time on another server’s population. Such large-scale measures and comparisons are not feasible in an offline economy.
Game Server Data: Cross-Sectional
A second form of data is “state” data, that is, a file that shows the accumulation of things as they currently exist within the game world. It is therefore a constantly changing database in that the behavioral logs are always appending and adjusting it. For example, it may show that character X has killed 105 monsters and has 456 pieces of copper over its existence to date. Yet when the player kills a new monster and gets more copper, those values will be changed in the state table. This cross-sectional file represents the opportunity to examine the world at a specific point in time. Totals also allow the calculation of rates since the total time and number of actions are there for use. This allows the calculation of how often someone does something compared to others, for example, how often they attack, how often they form groups, how often they send messages, and so forth. These rate values were instrumental in studying player tendencies and identity issues (Huh & Williams, 2009).
Survey Data
Survey data were well-understood and did not need special explanation as a class. Our survey data were collected from a subsample of 7,000 game players who
were playing the game during the time that the server data were collected. This subsample meant that if we wanted to examine both behavioral and survey data, we would have to limit the research to the 7,000 players. The administration was straightforward and detailed in the cited papers. Participants were identified by an unseen account number in Sony’s databases and so their anonymity was guar-anteed. These account numbers were also used to unobtrusively link the survey data with the game’s databases. Thus, perceptual data collected from the survey could be linked with game-playing data. These connections were made within the database and separate from the survey, so subjects were unaware that their time online, their server residence, or their character use were part of the research.
Survey data were quite useful on its own, and we have written a number of papers describing the social and psychological profile of the players based on it. In a largely descriptive article entitled “Who plays, how much, and why?” (Williams et al., 2008), we made these connections and listed them as a reference piece for others working in the area since no one had the data to answer those fundamental questions with generalizability. Yet the real value of these combinations come from linking why people do something to what they did. For example, linking personality type to rates of behaviors within the game allows a level of insight that is rare in communication research: not just what they think, but how it interacts with what they actually did.
Group and Network Data
An advantage of theEQIIdataset is that it provides complete data on group behav-ior, group outcomes, and networks among groups, making it feasible to study group ecosystems. Moreover, the data contain thousands of groups, enabling much larger sample sizes than are utilized in typical small group research. This last category is the most complex, owing to the combination of methodologies and the difficulty of creating network measures. In almost any online system there are interactions. These can be considered the basic formation of a tie between two or more people. Theory and contextual expertise will guide what kinds of data are most appropriate. For example, in studying gold farmers and their trade networks, we looked at ties created by economic transactions. In studying communication patterns, we looked at ties created by sending messages from person to person. These network data forms are ideal for tests in social network modeling and in programs such as p∗/ERGM (exponential random graph models). However, not all network data are easily extracted. In the case of trading and messaging, these were easy instances of finding the appropriate database for those kinds of interactions and building out a network-enabled file.
The richness of the approach is illustrated by the first network-based anal-ysis. In this project (Huang et al., 2009), players in groups were tied to the demographic data and to real-world locations to see whether similar real-world
players were more likely to gather within the virtual one (they are). This required tying the group interactions to the survey data and also to an IP address from yet another server database, which was then used to locate their real-world location via publicly available lookup tables.
Ethical and Human Subjects Issues
Given the resolution and comprehensiveness of the dataset, there are a number of privacy and other human subject issues that arise. The data set contains details of players’ real-world profile and their in-game behaviors. Both Sony and our own team carefully considered the ethical implications of this data and instituted a number of restrictions and practices before bringing the project to our several campus Institutional Review Boards (IRBs). Our and Sony’s goal from the outset was to ensure the privacy of the players. Towards this, we put several safeguards in place that we think make good examples for similar projects in the future. First, we at no point had real-world identities, and all identifiable information in our data had been filtered out with only an ID linking the various files together. Second, we did not capture or use the text conversations within the game. When we did record text-based interactions, it was only the people, not the content: player X has sent a message to player Y at time Z in channel Q. Third, we signed a legal document with the game company (a nondisclosure agreement) that precluded us from ever connecting in-game data to real-world data.
With those fundamental protections in place, we opened up IRB applications. Although the novelty of our methods took some explanation, each IRB approved our protocols because we translated the traditional values of the process into the new environment: privacy, and minimal or no risk to the subjects. For the survey data, the project was under expedited review but not exempt because we could not verify the ages of the survey takers. For the game data, the projects were expedited because these were existing data sets that were being used without risk to the subjects—thanks to the legally bound non-personally identifiable data.
DATA AND TEAM CHALLENGES
The social scientists on the team previously have worked with (what we thought were) large files. Big data dumps of a hundred megabytes or more from NES or GSS surveys have taxed our desktops and the algorithms within packages such as SPSS and SAS. Yet when the data exceed hundreds of gigabytes and reach into the realms of many terabytes, such approaches are no longer feasible. The chal-lenges are twofold. First, these large files tend to be agglomerations of several distinct databases, each of which may have its own structure and quirks. This is a
problem at any scale. Second, scale itself can be an obstacle. Aside from the obvi-ous issue of storage (where would Iput15 terabytes?), there is the issue of what software can even tackle the files. Assuming a desktop computer had the process-ing power to tackle these files—they do not—standard packages such as STATA, SAS, or SPSS do not scale indefinitely up to larger datasets. The algorithms that drive a basic request for a correlation or a regression in SPSS are optimized for datasets with tens of thousands of entries, not millions or billions. These algo-rithms are also designed to go through the data multiple times, with subsequent passes incorporating information from initial passes. This recursive approach to processing data works well with desktop-sized datasets but is not practical for larger sets where each pass may require going through more than a million rows. Even supercomputing power has its capacity limits for how much can be “held” in memory at a time. As a result, the computer science members of our team have had to develop a series of new algorithms to tackle these issues. The two most successful approaches have been developing new “one pass” algorithms that can handle queries without going back and incremental approaches in which a limited portion of the data is examined thoroughly before the next. These computer sci-ence innovations have enabled the social scientists to work without delving into the particulars of the algorithm development, and they have highlighted the crucial interdisciplinary benefit that the computer scientists have brought to the working teams. As our datasets have grown from the 5–10 terabyte range into the 100s of terabytes, we have had to look forward to newer approaches still. Supercomputing facilities like the one we have utilized at the National Center for Supercomputing Applications (NCSA) use software and operating systems that work well up to about the 10-terabyte range. Files larger than that are starting to require cloud computing technology (Armbrust et al., 2010), which uses new software to dis-tribute the large tasks to several powerful machines. No doubt future readers of an article like this may find such challenges quaint, but for the moment cloud computing is in its infancy and is still an undeveloped and expensive proposition. Separate from the large-file challenge is the organizational and hosting one noted above. Our particular dataset has taken considerable effort to construct and maintain. The main challenges that we faced included:
• The need to upload massive amount of data originally unintended for research purposes. The VWE database was built by uploading more than 4,000 separate log files. To speed up the rate of data loading, we have employed parallel processing techniques. By invoking four data loading pro-grams (written in Java) in parallel, we were able to initially utilize a smaller four-CPU server to upload the data efficiently.
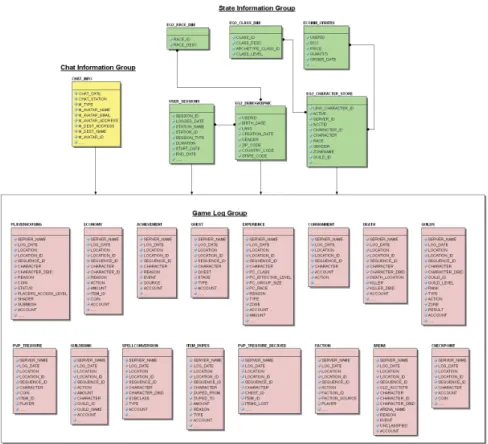
• The need to manage a heterogeneous dataset. Since the game logs are col-lected from several game systems by different versions of software (see the 23 different database sources in Figure 2), the data have different naming
FIGURE 2 VWE database schema. (color figure available online)
conventions for variables and different formats for variable values. The log files are long and complex strings of information and code that are a far cry from a typical matrix-based file used by desktop social science programs such as SPSS. Our programs had to perform data transformation during the data loading process to convert data into a uniform format with a universal identifier.
• The need to maintain data quality. The game logs contained a lot of “noise,” such as invalid characters, incomplete data values, and incorrect formats; therefore, we have had to develop programs for data validation and data cleaning to improve data quality.
• The need for fast response time for user queries. We have a very large database and a project team of more than 20 researchers from four universi-ties. To achieve an acceptable response time for queries submitted by users, we created indexes on database tables based on the pattern of user queries,
and they have substantially improved database performance. We have also implemented some stored database procedures which embed complex com-putation in optimized queries, which have helped users to perform the data analysis more efficiently.
• The need to maintain data integrity. With teams analyzing the data at four different locations, different versions of the database with different transfor-mations can be produced, creating inconsistencies in analyses. We have tried to meet this challenge by maintaining a canonical dataset at the NCSA that incorporates the tables and transformations from the other sites.
As is typical of large social game datasets (and likely for nongame ones as well), the information is complex and not even always stored in one central table. From discussions with data managers at other game companies, theEQIIdata may be on the more complex end of the spectrum. Due to the potential size and complex-ity of the VWE database, we have chosen Oracle as the platform for managing the database. Currently, the database is hosted by a single Linux server with 8 CPUs, 32GB RAM, and 15TB of disk space. The VWE database includes 23 tables with more than 57 relations among them at present. The data are composed of more than 500 variables ranging from location of an action to sending a text message to slaying a monster to buying a cup of mead. As noted above, the tables can be cate-gorized into different kinds of data: (1) theState Informationgroup with six tables that store state information at one point in time, such as user demographics, the character’s profile and inventory, cumulative accomplishments, and lists of skills and abilities; (2) theGame Loggroup of 16 game log tables that are collected dur-ing games based on various loggdur-ing attributes, such as whether a character killed a beast and received experience points or whether an economic transaction took place; and (3) theChat Informationgroup of a single table that keeps the chat logs between characters. Figure 2 shows the current database schema (only part of the table attributes are shown to simplify the diagram). Thirteen of these 23 tables contain more than 10 million rows, and six of them have more than 100 million rows. The largest table is the Economy log, which has more than one billion rows.
Informatics Challenges
Many communication researchers, if they are like us, will not be particularly inter-ested in the vagaries of database design and algorithm construction. We have found, however, that understanding and working on these issues has been key to our ability to measure communication concepts and test our hypotheses, and to keeping the computer scientists interested. A successful team requires symbiosis rather than service. Indeed, the computer science element has gone from being a necessary evil to a crucial and valued part of the process. Many of the theoretical
frameworks used by communication group researchers turn out to be compatible or identical to those used by computer scientists also studying group behaviors.
Tracking and building groups provides an example of the interdisciplinary challenges and benefits. The main activity in an MMO is killing a monster, and the social scientists wanted to know who was doing it and who was doing it in groups. The problem was that there is no variable or label in the dataset for “group.” Worse, groups could add and remove members and morph over time. Clearly, there needed to be a marriage of theory-driven group definition and significant data manipulation to create the correct group labels. This was something that had to be constructed and inferred from the other data—a task clearly outside the reg-ular expertise of our social scientists. For example, if two players were each in the same area and each killed a level 18 spider at the exact same second, there is little likelihood that they were killing two different spiders. If we then observed a similar matched-second pairing of outcomes for the same players a minute or two later, we made the working assumption that that was indeed a formal group. This enabled us to build our own separate database of player-group interactions. Then, we had to construct a rule set for which of these interactions constituted a group that lasted long enough to be a long-term group. This is where the contex-tual and theory-driven side of communication research has to meet the accontex-tuality of database structures.
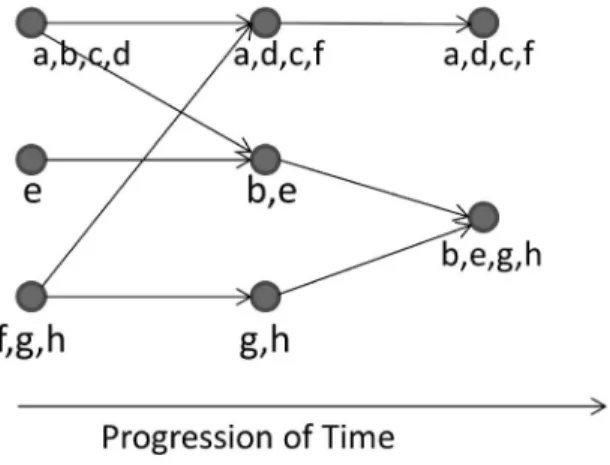
Player-player, player-group, and group-group relationships were all con-structed based on the joint activity timers. Then, the relationship or interaction between players in a MMO was then modeled as a graph (see Figure 3) which represents the interactions of the members of a group. The graph is layered in temporal order, going from left to right; that is, the leftmost layer shows activity that happened the earliest in time. A node represents the activity that a group
FIGURE 3 Identifying groups over time.
of players are engaged at any given iteration. The edges model transition from one activity to another, that is, iterations at which players become involved in an activity or leave an activity. If multiple players are engaged in the same activity simultaneously, then the node reflects this arrangement. For example, players b and e are engaged in different activities initially, and then join together into the same activity after that.
The activity graph can be analyzed to compute the required relationships. The problem of determining player-player relationships now reduces to one of ana-lyzing thetemporal tracks (history of activity over time) of pairs (or groups) of players to determine temporal intersections, correlations, and other similar-ity measures between them. The problem of determining the membership of a player in a group now reduces to one of analyzing the player’s temporal track, measuring the time he or she spends in each group, and looking at the activities in which he or she participates. The problem of determining group-group rela-tionship can be reduced to the problem of frequent subgraph mining (Srikant & Agrawal, 1996) on the activity graph. The greater the number of frequent activ-ity subgraphs between two groups, the greater is the similaractiv-ity between the two graphs. A key challenge is the construction of the activity graph itself, since the information required for it is not directly available from the game logs. Since the only available information is samples of activities of the group, it is non-trivial to determine points in time when the group came together and when it disbanded. Obtaining groups from social network data is an active area of research in computer science (Girvan & Newman, 2002; Newman, 2004; Pathak, DeLong, Banerjee, & Erickson, 2008; Reichardt & Bornholdt, 2006; Tyler, Wilkinson, & Huberman, 2003), and theEQIIdata provide us with unique challenges to push the state of the art.
Testing of various hypotheses regarding trust, social capital, and expertise requires developing quantitative metrics for them, since computing these variables is not easy given their subjective nature. However, by defining a scope for specific situations, such as defining the “knowledge base” for an expert (e.g., knowledge regarding developing a character inEQII), does help in concretizing the problem. Despite this, deriving a true indicator of subjective concepts such as trust, social capital, and expertise, even in specific situations, is a problem (M. A. Ahmad & Srivastava, 2008; Kim et al., 2008; Kim & Srivastava, 2007; Liu et al., 2008). Such techniques will also require additional computational methods for tracking dynamics over time. Because it is difficult to operationalize such concepts, we have sometimes had to use only survey data and then looked to behavioral data for validity checks only.
Challenges in Managing the Collaboration
Managing a project with more than 20 members of the research team spread across four campuses is also a challenge. Moreover, this is a multidisciplinary
team, and different disciplines are likely to view the data from unique lenses. Taking advantage of this diversity is a fortunate but formidable challenge. Our major cultural challenges come from having different terms for the same concepts, different target journals in mind, and different mindsets in general. Terminology is an easy fix as it requires only stopping and asking for a definition (usually followed by an “Ohhh”). Publishing is stickier because while the team members may be willing to push into new areas, their home disciplines might not be as open minded. This is an area for compromise and for educating tenure committees. The different mindsets represent an opportunity and a place for true interdisciplinarity to shine. For example, the computer scientists on our team are not often concerned with what they would call “domain knowledge.” Their preference is to have a “feature set” given to them and to tackle the algorithms. The social scientists are not concerned with how the calculations will scale on the cloud array. Their preference is to get good, clean, and trustworthy results. So long as each group spends some time listening to the other, these issues are more complementary than divisive.
The measures we have taken to build a resilient team and to capitalize on the diverse expertise of team members include:
• Conducting biweekly meetings of the entire team using online screen-sharing conferencing and an audio-conferencing service.
• Holding biweekly meetings of the Principal Investigators to coordinate project management and to set strategic directions for the project.
• Convening a face-to-face conference of the team twice a year.
• Setting up more than eight project teams composed of personnel from differ-ent physical locations to ensure that we integrate perspectives across sites. Each team addresses different issues, such as economics, group dynamics, etc., and each must have a faculty member and at least one computer scientist and social scientist.
• Developing a data management plan to prioritize and manage requests relevant to the database.
CONCLUDING THOUGHTS
As the examples indicate, one hallmark of this project is the great potential it has for yielding new knowledge about virtual worlds, and potentially about the real world. Whether the latter can be delivered depends on proving the verisimilitude of behavior in the world ofEQIIand the real world, which remains to be tested. This “mapping” principle is explored in greater detail in Williams (in press). A second hallmark is the extreme complexity of the computational tasks involved. This project continues to require innovative approaches, both in terms of data
management and data processing. There are also challenges in managing a team that is very dispersed and interdisciplinary.
This leads us to our main methodological conclusion about the effort. The unobtrusive nature is of course a great boon to data quality, but the sheer com-prehensiveness of the data is both a blessing and a curse as well. The project in a sense offers a reminder of the old saw “be careful what you ask for because you just might get it.” Social scientists like us have for years wished we could have large and perfect datasets describing social and group phenomena, but we had also always assumed that our current tools would let us tackle such data seam-lessly. Not so. New data will continue to require new methods as well because our current ones do not always scale. We suspect that this issue is not going away. Indeed, we expect that it will become more common. The future no doubt holds ever-larger behavioral datasets as more of our daily lives becomes incorporated into online experiences and simple online storage. These massive data are troves for researchers, but they will offer a non-standard series of challenges as we try to operationalize our core theories into new tests.
ACKNOWLEDGEMENTS
This work was supported by National Science Foundation award number IIS-0729505, and Army Research Institute award number W91WAW-08-C-0106.
REFERENCES
Ahmad, M., Keegan, B., Srivastava, J., Williams, D., & Contractor, N. (2009, August 29–31).Mining for gold farmers: Automatic detection of deviant players in MMOGs. Paper presented at the IEEE Social Computing, Vancouver, Canada.
Ahmad, M. A., & Srivastava, J. (2008).An ant colony optimization approach to expert identifica-tion in social networks. Paper presented at the First International Workshop on Social Computing, Behavioral Modeling, and Prediction, Phoenix, Arizona.
Armbrust, M., Fox, A., Griffith, R., Joseph, A. D., Katz, R., Konwinski, A., . . . . Zaharia, M. (2010). A view of cloud computing.Communications of the ACM,53(4), 50–58.
Bailenson, J., Beall, A., Blascovich, J., Loomis, J., & Turk, M. (2005). Transformed social interaction, augmented gaze, and social influence in immersive virtual environments.Human Communication Research,31, 511–537.
Caplan, S., Williams, D., & Yee, N. (2009). Problematic Internet use and psychosocial well-being among MMO players.Computers in Human Behavior,25, 1312–1319.
Castronova, E. (2005).Synthetic worlds: The business and culture of online games. Chicago, IL: University of Chicago Press.
Castronova, E., Williams, D., Shen, C., Ratan, R., Xiong, L., Huang, Y., & Keegan, B. (2009). As real as real? Macroeconomic behavior in a large-scale virtual world.New Media & Society,11, 685–707.
Fallows, D. (2004).The Internet and daily life. Washington, DC: Pew Internet & American Life Project.
Girvan, M., & Newman, M. (2002). Community structure in social and biological networks.
Proceedings of the National Academy of Science, 7821–7826.
Huang, Y., Shen, C., Williams, D., & Contractor, N. (2009).Virtually there: The role of proximity and homophily in virtual world networks. Paper presented at the IEEE-SocialComm-09, Vancouver, Canada.
Huffaker, D., Wang, A., Treem, J., Ahmad, M., Fullerton, L., Williams, D., . . . . Contractor, N. (2009).
The social behavior of experts in massive multiplayer online role-playing games. Paper presented at the IEEE SocialComm-09, Vancouver, Canada.
Huh, S., & Williams, D. (2009). Dude looks like a lady: Online game gender swapping. In W. Bainbridge (Ed.),Online worlds: Convergence of the real and the virtual. Guildford, England: Springer.
Kendall, L. (2002).Hanging out in the virtual pub: Masculinities and relationships online. Berkeley, CA: University of California Press.
Kim, Y., Le, M.-T., Lauw, H. Y., Lim, E.-P., Liu, H., & Srivastava, J. (2008).Building a web of trust without explicit trust ratings. Paper presented at the Workshop on Data Engineering for Blogs, Social Media, and Web 2.0 at the International Conference on Data Engineering, Cancun, Mexico. Kim, Y., & Srivastava, J. (2007, August).Impact of social influence in e-commerce decision making. Paper presented at the The Ninth International Conference on Electronic Commerce (ICEC ’07), Minneapolis, MN.
Lenhart, A., Jones, S., & Macgill, A. (2008).Pew Internet project data memo: Over half of American adults play video games. Washington, DC: Pew Internet & American Life Project.
Lenhart, A., Kahne, J., Middaugh, E., Macgill, A., Evans, C., & Vitak, J. (2008).Teens, video games, and civics. Washington, DC: Pew Internet & American Life Project.
Liu, H., Lim, E.-P., Lauw, H. Y., Le, M.-T., Sun, A., Srivastava, J., & Kim, Y. A. (2008).Predicting trust among users of online communities — an epinions case study. Paper presented at the Proceedings of ACM Conference on Electronic Commerce, Chicago, Illinois.
Lowery, S., & DeFluer, M. (1995).Milestones in mass communication research: Media effects. White Plains, NY: Longman Publishers USA.
Monge, P. S., & Contractor, N. S. (2003).Theories of communication networks. Oxford, England: Oxford University Press.
Newman, M. (2004). Fast algorithms for detecting community structure.Physics Review, E, 69. Pathak, N., DeLong, C., Banerjee, A., & Erickson, K. (2008).Social topic models for community
extraction. Paper presented at the 2nd ACM Workshop on Social Network Mining and Analysis, 13th ACM SIGKDD Conference, Las Vegas, Nevada.
Ratan, R., Chung, J., Shen, C., Poole, M. S., & Williams, D. (2010, in press). Schmoozing and smiting: Trust, social institutions and communication patterns in an MMOG.Journal of Computer Mediated Communication.
Reeves, B., Malone, T. W., & O’Driscoll, T. (2008). Leadership’s online labs.Harvard Business Review,86(5), 58–59.
Reichardt, J., & Bornholdt, S. (2006). Statistical mechanics of community detection.Physics Review, E, 74.
Rideout, V., Roberts, D., & Foehr, U. (2005).Generation M: Media in the lives of 8–18 year-olds. Washington, DC: Kaiser Family Foundation.
Satariano, A. (2010).OnLive game system to start in June at $14.95 a month. Retrieved from http://www.bloomberg.com/apps/news?pid=newsarchive&sid=aVe3aVC2rWTQ
Schiesel, S. (2007). Game on: Hero returns to slay his dragons.New York Times,p. 1.
Sellers, M. (2006). Designing the experience of interactive play. In P. Vorderer & J. Bryant (Eds.),
Video games: Motivations and consequences of use. Mahwah, NJ: Erlbaum.
Srikant, R., & Agrawal, R. (1996). Mining sequential patterns: Generalizations and performance improvements.Extending Database Technology, 3–17.
Taylor, T. L. (2006).Play between worlds: Exploring online game culture. Cambridge, MA: The MIT Press.
Tyler, J., Wilkinson, D., & Huberman, B. (2003). Email as spectroscopy: Automated discovery of community structure within organizations. In M. Huysman (Ed.),Communities and technologies
(pp. 81–96). Amsterdam, the Netherlands: Kluwer Academic Publishers.
Wartella, E., & Reeves, D. (1985). Historical trends in research on children and the media: 1900–1960.
Journal of Communication,35, 118–133.
Webb, E., Campbell, D., Schwartz, R., & Sechrest, L. (1966).Unobtrusive measures: Nonreactive research in the social sciences. Chicago, IL: Rand McNally and Company.
Wellman, B., & Haythornthwaite, C. (2002).The Internet in everyday life. Malden, MA: Blackwell Publishing.
White, P. (2008).MMOGData: Charts. Gloucester, England.
Williams, D. (2005). Bridging the methodological divide in game research.Simulation & Gaming,36, 447–463.
Williams, D. (2006). Virtual cultivation: Online worlds, offline perceptions.Journal of Communi-cation,56, 69–87.
Williams, D. (2010). The mapping principle, and a research framework for virtual worlds. Communi-cation Theory,20, 451–470.
Williams, D. (in press). The mapping principle, and a research framework for virtual worlds. Comm-unication Theory.
Williams, D., Caplan, S., & Xiong, L. (2007). Can you hear me now? The impact of voice in on online gaming community.Human Communication Research,33, 427–449.
Williams, D., Consalvo, M., Caplan, S., & Yee, N. (2009). Looking for gender (LFG): Gender roles and behaviors among online gamers.Journal of Communication,59, 700–725.
Williams, D., Ducheneaut, N., Xiong, L., Zhang, Y., Yee, N., & Nickell, E. (2006). From tree house to barracks: The social life of guilds in World of Warcraft.Games & Culture,1, 338–361. Williams, D., Yee, N., & Caplan, S. (2008). Who plays, how much, and why? A behavioral player
census of a virtual world.Journal of Computer Mediated Communication,13, 993–1018. Yee, N. (2006). The demographics, motivations and derived experiences of users of massively
mul-tiuser online graphical environments.PRESENCE: Teleoperators and Virtual Environments,15, 309–329.