TESTS OF INDEPENDENCE IN
SEPARABLE ECONOMETRIC MODELS:
THEORY AND APPLICATION
By
Donald J. Brown, Rahul Deb and Marten H. Wegkamp
December 2007
COWLES FOUNDATION DISCUSSION PAPER NO. 1395RR
COWLES FOUNDATION FOR RESEARCH IN ECONOMICS
YALE UNIVERSITY
Box 208281
New Haven, Connecticut 06520-8281
http://cowles.econ.yale.edu/
APPLICATION
DONALD J. BROWN, RAHUL DEB, AND MARTEN H. WEGKAMP
ABSTRACT. A common stochastic restriction in econometric models separable in the latent variables is the assumption of stochastic independence between the unobserved and observed exogenous vari-ables. Both simple and composite tests of this assumption are derived from properties of indepen-dence empirical processes and the consistency of these tests is established. As an application, we simulate estimation of a random quasilinear utility function, where we apply our tests of indepen-dence.
1. INTRODUCTION
Recently, Brown and Wegkamp (2002) proposed a family of extremum estimators for semipara-metric econosemipara-metric models separable in the latent variablesW, whereW =ρ(X, Y, θ),Xa random vector of observed exogenous variables,Y a random vector of observed endogenous variables,W is drawn from a fixed but unknown distribution andθ is a vector of unknown parameters. An important special case is the implicit nonlinear simultaneous equations model, where a reduced form function Y = ρ−1(X, W, θ) exists. Of course, in general Y = ρ−1(X, W, θ) is non-additive inW, e.g., consider the random quasilinear utility modelV(Y, W, θ)proposed by Brown and Cal-samiglia (2007), whereV(Y, W, θ) = U(Y, θ) +W ·Y +Y0. In this case the structural equations defined by W = ρ(X, Y, θ) are equivalent to the first order conditions of maximizingV(Y, W, θ)
subject to the budget constraintP·Y +Y0 =I (P andIstand for prices and income, respectively andY0is the numeraire good). The details can be found in Section 2 below.
The principal maintained assumption in Brown and Wegkamp (2002) is the stochastic indepen-dence betweenW andX. In this paper we propose tests of this assumption using the elements of empirical independence processes. We present both simple tests, i.e., the null hypothesis states that for a givenθ0,ρ(X, Y, θ0) andX are independent, as well as composite tests where the null hypothesis is that there exists someθ0 ∈Θ, the set of possible parameter values, such thatXand ρ(X, Y, θ0)are independent.
Here we extend the analysis of Brown and Wegkamp (2002) beyond the characterization of the independence of random vectors in terms of their distribution functions. In particular, we define a family of weighted minimum mean-square distance from independence estimators in
Date: October 19, 2007.
Key words and phrases. Cramér–von Mises distance, empirical independence processes, random utility models, semi-parametric econometric models, specification test of independence.
terms of characteristic or moment generating functions. The latter characterization is well suited for estimating separable econometric models with non-negative endogenous and exogenous vari-ables. These estimates are computationally more tractable than the ones considered by Brown and Wegkamp (2002). We show asymptotic normality, and consistency of the bootstrap for our estimates and consistency of the tests for independence.
The paper is organized as follows. In Section 2 of this paper we present both the general econo-metric model and the example which motivated this research. Properties of empirical indepen-dence processes are reviewed in Section 3. Asymptotic properties of our estimators are derived in Section 4, and Section 5 discusses tests of independence between the observed and unobserved exogenous variables. Simulations results are in the Appendix.
2. THEECONOMETRICMODEL
In this paper we consider semiparametric econometric models, which are separable in the latent variables. In these models we have a triple(X, Y, W)∈Rk1×
Rk2×Rk2of random vectors, whereX andW are stochastically independent. The exogenous variableW =ρ(X, Y)∈Rk2 is unobserved
and drawn from a fixed but unknown distribution. In this paper we consider structural equations ρof the parametric formρ(x, y) =ρ(x, y, θ)for someθ∈Θ⊆Rp.
In general, two random vectorsX∈Rk1 andW ∈
Rk2 are independent if and only if
IEf(X)g(W) = IEf(X)IEg(W)for allf ∈ F1, g∈ F2, (2.1) whereF` (`= 1,2) are (2.2) F`= n 1(−∞,t](·), t∈Rk` o .
Note that each F` in (2.2) is a universal Donsker class, indexed by a set of finite dimensional
parameters(s, t) ∈ Rk1 ×Rk2 only. This situation has been considered in Brown and Wegkamp (2002). Indeed, there are other classesF`, for which (2.1) holds as well. For example, the classes
(2.3) F` =nexp(< t,·>), t∈Rk` o , or the classes (2.4) F` =nexp(i < t,·>), t∈Rk` o wherei=√−1,
or the classes of all C∞ functions on Rk`. The first two sets of classes are Donsker, provided t ranges in a bounded subset. In (2.3) we compare the joint moment generating functions (m.g.f.’s) with the product of its marginal m.g.f.’s, and in (2.4) the comparison is based on characteristic functions. The class of allC∞ functions is not finite dimensional, and therefore is uninteresting from a computational perspective. We note in passing that this formulation using expected values
does not allow for comparison between the joint density ofXandρ(X, Y, θ), and the product of its marginal densities. In fact, our estimators can be viewed as moment estimators as (2.1) is a family, albeit infinite, of moment conditions.
Let(X1, Y1),· · ·,(Xn, Yn)be independent copies of the pair(X, Y). Motivated by the
equiva-lence (2.1), we compare the empirical version
1 n n X i=1 f(Xi)g(ρ(Xi, Yi, θ)) = 1 n n X i=1 f(Xi) · 1 n n X i=1 g(ρ(Xi, Yi, θ)),
for allf ∈ F1 andg ∈ F2. LettingPn = n−1
Pn
i=1δXi,Yi be the empirical measure based on the sample(X1, Y1),· · ·,(Xn, Yn), we can write the preceding display more compactly as
Pnf(x)g(ρ(x, y, θ)) =Pnf(x)Png(ρ(x, y, θ))for allf ∈ F1, g∈ F2.
Observe that this amounts to comparing the joint cumulative distribution functions (c.d.f.’s) with the product of the marginal c.d.f.’s.
In order to obtain a tractable large sample theory, we consider the statistics Mn(θ;Pn;µ)≡
Z Z
Rk1×Rk2
{Pnfs(x)gt(ρ(x, y, θ))−Pnfs(x)Pngt(ρ(x, y, θ))}2 dµ(s, t),
whereµis a c.d.f. acting as a weight function. We require thatµhas a strictly positive density. In this way, we guarantee that all valuessandt, that is, all functionsf` ∈ F`, are taken into account.
The heuristic idea is that the unique minimizer (if it exists, conditions are necessary to guarantee this) ofMn(θ;Pn;µ)should be close to the unique minimizer of
M(θ;P;µ)≡
Z Z
Rk1×Rk2
{P fs(x)gt(ρ(x, y, θ))−P fs(x)P gt(ρ(x, y, θ))}2 dµ(s, t),
where P is the probability measure of the pair (X, Y). The unique minimizer of this criterion is denoted by θP = θ(P;µ). Observe that M(θ;P;µ) is finite for all θ since µ is a distribution
function, and thatM(θP;P;µ) = 0if and only ifρ(X, Y, θP)andXare independent. In this case
θ(P;µ) does not depend onµand we say that the model is identified. We can interpretM(θ)as the Cramér-von Mises distance between the actual distribution of the pair(X, ρ(X, Y, θ))and the (product) distribution of(X, Wθ), where the marginalsXandWθare independent andWθhas the
same distribution asρ(X, Y, θ). Observe that M(θbn) = M(θP) +
1
2(bθn−θP) 0
M00(θn)(θbn−θP),
providedM ∈ C2(Θ), for someθn betweenθP andθbn, wherebθnis the estimator ofθP as defined
in section 4. We can view the first term on the right as the approximation error due to the fi-nite dimensional model, and the last term can be thought of as the estimation error, which has an asymptoticχ2p distribution (cf. Theorem 4.1 below) under some regularity assumptions. For
instance, suppose thatρ(X, Y)andXare independent for someρwhich we approximate by some finite series ρ(x, y)∼=ρ(x, y, θ)≡ p X i=1 θiψi(x, y)
based on some finite dimensional basisψ1,· · · , ψp.
We end this section with an example of an implicit nonlinear simultaneous equations model separable in the latent variables, which motivated our research. In this example, we show that the econometric model is identified for the class of extremum estimators proposed in this paper and hence can be estimated by these methods.
Example. (A Random Quasilinear Utility Model of Consumer Demand)
We consider a consumer with a random demand functionY(P, I, W, θ0)derived from maximiz-ing a random utility functionV(Y, W, θ0)subject to her budget constraintP·Y +Y0 =I. First, the consumer drawsW from a fixed and known distribution. Then nature drawsX = (P, I), from a fixed but unknown distribution. The main model assumption is thatW andX are stochastically independent. The consumer solves the following optimization problem:
maximizeV(y, w, θ0)overysuch thatp·y+y0=I. (2.5)
The econometrician knowsV(y, w, θ)andΘ, the set of all possible values for the parameterθ, but does not knowθ0, the true value of θ. Nor does the econometrician observeW or know the distribution ofW. The econometrician does observeX = (P, I). The econometrician’s problem is to estimate θ0 and the distribution of W from a sequence of observations Zi = (Xi, Yi) for
i= 1,2, ..., n. The structural equations for this model are simply the first-order conditions of the consumer’s optimization problem. These conditions define an implicit nonlinear simultaneous equations model of the formW = ρ(X, Y, θ), where the reduced form function is the consumer’s random demand functionY(P, I, W, θ0)for the specification ofV(y, w, θ)proposed by Brown and Calsamiglia (2007), i.e.,V(y, w, θ) =U(y, θ) +w·y+y0. They assume that for allθ∈Θ,U(y, θ)is a smooth monotone strictly concave utility function on the positive orthant ofRk, i.e.,DU(y, θ)>0 andD2U(y, θ)is negative definite for allyin the positive orthant ofRk, andW ≥0.
Our examples are suggested by their model, where first we consider: V(y, w, θ) =y0+ K X k=1 θkgk(yk) + K X k=1 wkyk, (2.6)
whereθk∈(0,1)andy0is the numeraire good. Then the first-order conditions for this
optimiza-tion problem can be written asW =ρ(X, Y, θ), whereX = (P1, P2, . . . , PK),Y = (Y1, Y2, . . . , YK)
our utility is linear in the numeraire and we assume an interior solution, our variableXdoes not include the incomeIandY does not includeY0. Our first order conditions are thus
wk=pk−θk
∂gk(yk)
∂yk
(2.7)
Because of our assumptions ongkthe above system can be solved uniquely for the random
de-mand functionsYk(X, W, θ). This verifies that there exists a unique reduced formY =γ(X, W, θ)
such that W = ρ(X, γ(X, W, θ), θ). Clearly an important special case of the above form is the Cobb-Douglas function where we can take eachgk(yk) = lnyk.
We now need to show that the above system is identified. We will use the necessary and suf-ficient condition for observational equivalence in an econometric model, where W and X are independent, from Matzkin (2005)1. If we can find anxandysuch that Matzkin’s identity is not satisfied for differentθ,θ˜then our model is identified.
Matzkin’s Identity is given by ∂log(fW(ρ(y, x, θ))) ∂w " ∂ρ(y, x, θ) ∂x − ∂ρ(y, x, θ) ∂y ∂ρ(y, x,θ˜) ∂y !−1 ∂ρ(y, x,θ˜) ∂x # (2.8) + " ∂ ∂xlog ∂ρ(y, x, θ) ∂y ! − ∂ ∂xlog ∂ρ(y, x,θ˜) ∂y !# − " ∂ ∂ylog ∂ρ(y, x, θ) ∂y ! − ∂ ∂ylog ∂ρ(y, x,θ˜) ∂y !! ∂ρ(y, x,θ˜) ∂y !−1 ∂ρ(y, x,θ˜) ∂x # ≡0
wherefW(w)is the fixed but unknown distribution of our parameterW and the functionρis the
system of first order conditions.
The identity (2.9) ∂ ∂ylog ∂ρ(y, x, θ) ∂y ! = ∂ ∂ylog ∂ρ(y, x,θ˜) ∂y ! = g 000 1 (y1) g001(y1) g2000(y2) g200(y2) . . . !
follows from (2.7). Hence the third term is zero. The second term is also zero, since ∂ ∂xlog ∂ρ(y, x, θ) ∂y ! = ∂ ∂xlog ∂ρ(y, x,θ˜) ∂y ! = 0
1Lenkard and Berry (2006) show that the necessary and sufficient conditions for identification, proposed by Brown
(1983) and Roehrig (1988), which are widely cited in the literature and used in Brown and Wegkamp (2002), are incor-rect. This paper corrects the error in Brown and Wegkamp (2002).
Simplifying the remaining term we get the following equation: ∂log(fW(ρ(y, x, θ))) ∂w " I− θ1 ˜ θ1 0 0 . . . 0 θ2 ˜ θ2 0 . . . .. . ... . .. # = 0 (2.10)
Sinceθandθ˜are different, there exists aksuch thatθk6= ˜θk. Assuming that thekthcomponent of
the derivative offW is not identically zero implies there existxandysuch that Matzkin’s identity
is not satisfied. That is, the model is identified.
This is the example we compute in the Appendix. We can show that general utility functions of the form V(y, w, θ) =y0+U(y1, . . . , yK, θ1, . . . , θK) + K X k=1 wkyk, (2.11)
(where U is some concave, monotone function ofy which does not contain linear terms iny, as they can be absorbed in the error term) are identified under the following restrictions:
Theorem 2.1. The systemwk =pk−∂U(y1,y∂y2,...,yk K,θ)is identified if
(1) w=ρ(y, x, θ)or equivalentlywk =pk− ∂U(y1,y∂y2,...,yk K,θ)is an invertible function inyandw. (2) For any fixedθ6=θ0and∀c,∃ysuch thatU(y1, y2, . . . , yK, θ)−U(y1, y2, . . . , yK, θ0)6=c.
(3) ∀y, x ∂x∂ ∂log(fW(ρ(y,x,θ)))
∂w is invertible.
Proof. The proof follows from the following observation - Matzkin’s identity holds only if all derivatives of the identity w.r.t. x andy are also zero. We differentiate Matzkin’s identity with respect toxand examine the individual terms.
For allx, y (2.12) ∂ ∂x " ∂ ∂ylog ∂ρ(y, x, θ) ∂y ! − ∂ ∂ylog ∂ρ(y, x,θ˜) ∂y !! ∂ρ(y, x,θ˜) ∂y !−1 ∂ρ(y, x,θ˜) ∂x # = 0
because the term inside the square brackets does not depend onx. Similarly the second term is independent ofx, hence
" ∂ ∂xlog ∂ρ(y, x, θ) ∂y ! − ∂ ∂xlog ∂ρ(y, x,θ˜) ∂y !# = 0 (2.13)
This leaves the first term. Once again the term inside the square brackets does not depend on x, thus our sufficient condition for identification is that for somey, x
(2.14) ∂ ∂x " ∂log(fW(ρ(y, x, θ))) ∂w #" ∂ρ(y, x, θ) ∂x − ∂ρ(y, x, θ) ∂y ∂ρ(y, x,θ˜) ∂y !−1 ∂ρ(y, x,θ˜) ∂x # 6 = 0
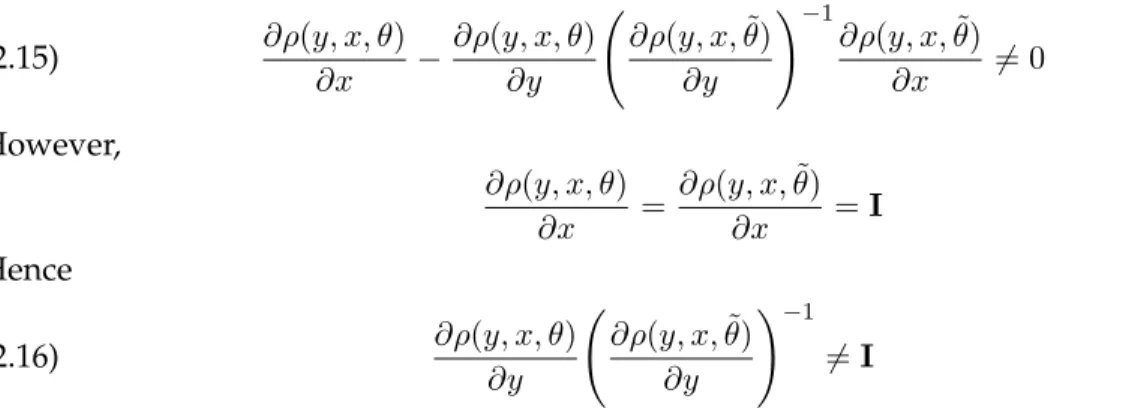
But using assumption (3) we need only consider the claim: ∂ρ(y, x, θ) ∂x − ∂ρ(y, x, θ) ∂y ∂ρ(y, x,θ˜) ∂y !−1 ∂ρ(y, x,θ˜) ∂x 6= 0 (2.15) However, ∂ρ(y, x, θ) ∂x = ∂ρ(y, x,θ˜) ∂x =I Hence ∂ρ(y, x, θ) ∂y ∂ρ(y, x,θ˜) ∂y !−1 6 =I (2.16)
for someyandxsuffices for identification. Suppose not, then(∀y), U(y1, y2, . . . , yK, θ)−U(y1, y2, . . . , yK,θ˜) =
a constant, asU does not contain linear terms iny; which contradicts assumption (2).
As an example assume that thew’s are independent and half normally distributed with param-eterθor fW(w) = K Y k=1 2θk π e −w2 kθ2k/π (2.17) Then ∂log(fW(w)) ∂w = " −2θ 2 1w1 π , . . . ,− 2θ2KwK π # and therefore ∂ ∂x ∂log(fW(ρ(y, x, θ)) ∂w = −2θ21 π 0 . . . 0 −2θ22 π . . . .. . ... . .. (2.18)
which is invertible for ally, x.
Table 1 summarizes the distributions for which our assumption (3) holds. Note that for the checked distributions it holds for all values of parameters. For the other distributions our as-sumption holds only if we consider a restricted subset of parameters.
TABLE1. List of Distributions Weibull (Exponential) X
Gamma (Chi Square) √ Half Normal √ Log Normal X Pareto √ Rayleigh √ Type 2 Gumbell X Wald X Levy X
3. INDEPENDENCEEMPIRICALPROCESSES Given the classesF1andF2, we defineF ≡ F1and
G ≡ {f(ρ(·,·, θ)) : f ∈ F2, θ∈Θ}={gt(ρ(·,·, θ)) : t∈Rk2, θ∈Θ}.
As before, we denote the joint probability measure of the pair (X, Y) by P, and the empirical measure based on the sample(X1, Y1),· · · ,(Xn, Yn)byPn. For anyf ∈ F andg∈ G, set
Dn(f, g)≡Pnf g−PnfPng and D(f, g)≡P f g−P f P g, so that Mn(θ) = Z Z Rk1×Rk2 D2n(fs, gt,θ)dµ(s, t)
in the new notation. Finally, we define the independence empirical processZnindexed byF × G
by
Zn(f, g)≡
√
n(Dn−D)(f, g).
Observe that [cf. Van der Vaart and Wellner (1996, page 367)] Zn(f, g) = √ n{(Pn−P)(f g)−(Png)(Pn−P)(f)−(P f)(Pn−P)(g)} = √n(Pn−P)((f−P f)(g−P g))− √ n(Pn−P)(f)(Pn−P)(g) (3.1)
The minor difference with the original formulation of independence empirical processes in Van der Vaart and Wellner (1996, Chapter 3.8) is that we consider the marginal distributions of(X, ρ(X, Y, θ))
rather than(X, Y). The next result states sufficient conditions for weak convergence of the inde-pendence empirical processZnin`∞(F × G). LetkPkF be the sup-norm on`∞(F)for any class
F, i.e.kPkF = supf∈FP|f|.
Theorem 3.1. LetF,GandF × GbeP-Donsker classes, and assume thatkPkF <∞andkPkG <∞. ThenZnconverges weakly to a tight Gaussian processZP in`∞(F × G)asn→ ∞.
Proof. The first term on the right in (3.1) converges weakly asF ×GisP-Donsker. The second term in this expression is asymptotically negligible, sinceFandGareP-Donsker. We invoke Slutsky’s
lemma to conclude the proof.
We can also bootstrap the limiting distribution of Zn. Let(X1∗, Y1∗),· · ·,(Xn∗, Yn∗) be an i.i.d.
sample from Pn, and letP∗n be the corresponding bootstrap empirical measure. Then we define
the bootstrap counterpart ofZnby
Z∗n(f, g) =
√
whereD∗n(f, g) =
√
n(P∗nf g−P∗nfP∗ng).
Theorem 3.2. LetF,GandF × GbeP-Donsker classes, and assume thatkPkF <∞andkPkG <∞. ThenZ∗nconverges weakly to a tight Gaussian processZP in`∞(F × G), givenP∞-almost every sequence (X1, Y1),(X2, Y2),· · ·, asn→ ∞.
Proof. We first note that Z∗n(f, g) =
√
n(P∗n−Pn)((f−Pnf)(g−Png))−
√
n(P∗n−Pn)(f)(P∗n−Pn)(g)
and recall that√n(P∗n−Pn) converges weakly [cf. Theorem 3.9.11 in Van der Vaart and Wellner
(1996)].
4. ESTIMATION OFθP
4.1. A general result. GivenP-Donsker classesF ={fs : s∈Rk1}andG ={g
t,θ : t∈Rk2, θ∈
Θ}and a c.d.f.µ, we can define
Mn(θ) = Z Z Rk1×Rk2 D2n(fs, gt,θ)dµ(s, t) and M(θ) = Z Z Rk1×Rk2 D2(fs, gt,θ)dµ(s, t).
We propose to estimate θP = θ(P;µ) by θbn = θ(Pn;µ) which minimizes the random criterion
functionMnoverΘ. Then, providedMhas a unique, well-separated minimum at an interior point
θP ofΘ, it follows immediately by the weak convergence ofZn(cf. Theorem 3.1) and Theorem 5.9
in Van der Vaart (1998, page 46) that
b
θn∈arg minMn(θ)→arg minM(θ) =θP,
in probability. We will now show the asymptotic normality of the standardized distribution
√
n(θbn−θP).
We impose the following set of assumptions:
(A1) M has a unique global, well-separated minimum atθP in the interior ofΘandM(θ;P) ∈
C2(Θ)andM00(θP;P)is non-degenerate.
(A2) D(fs, gt,θ)is differentiable with respect toθfor alls, t, and its derivative satisfies
˙ D(s, t, θ)−D˙(s, t, θP) ≤ |θ−θP|∆(s, t) for some∆∈ L2(µ). (A3) sups,tP|fsgt,θ−fsgt,θP| 2→0asθ→θ P.
(A4) The mapρ(·,·, θ)is continuously differentiable inθ. (A5) The classesF,GandF × G areP-Donsker.
We have the following result:
Theorem 4.1. Assume (A1) – (A5). Then,√n(θbn−θP)has a non-degenerate Gaussian limiting
distribu-tion, asn→ ∞.
Proof. The result follows from Theorem 3.2 in Wegkamp (1999, page 48). We need to verify the following three conditions:
(i) θbn→θP in probability.
(ii) Mhas a non-singular second derivative atθP.
(iii) √n(Mn−M)(θ)is stochastically differentiable atθP.
As noted above, (i) follows from general theory. Condition (ii) is subsumed in (A1). It remains to establish (iii). Let the symbol denote weak convergence in general metric spaces. (A3) implies that, for alls, t,
Zn(fs, gt,θ)−Zn(fs, gt,θP) 0 asθ θP, n→ ∞. Consequently, by the continuous mapping theorem
Z Z Rk1×Rk2 Z2n(fs, gt,θ)−Z2n(fs, gt,θP) dµ(s, t) 0
asθ θP, n→ ∞. (A2), (A3) and the continuous mapping theorem yield also that
Z Z Rk1×Rk2 [D(fs, gt,θ)Zn(fs, gt,θ)−D(fs, gt,θP)Zn(fs, gt,θP) −(θ−θP)0D˙(s, t, θP)Zn(fs, gt,θP) i dµ(s, t) 0 asθ θP, n→ ∞. Conclude that √ n(Mn−M)(θ) = Z Z Rk1×Rk2 Z2n(fs, gt,θ)dµ(s, t) + 2 Z Z Rk1×Rk2 D(fs, gt,θ)Zn(fs, gt,θ)dµ(s, t) = Z Z Rk1×Rk2 Z2n(fs, gt,θP)dµ(s, t) + 2 Z Z Rk1×Rk2 D(fs, gt,θP)Zn(fs, gt,θP)dµ(s, t) + +2(θ−θP)0 Z Z Rk1×Rk2 ˙ D(s, t, θP)Zn(fs, gt,θP)dµ(s, t) +op(1 +kθ−θPk) =√n(Mn−M)(θP) + 2(θ−θP)0 Z Z Rk1×Rk2 ˙ D(s, t, θP)Zn(fs, gt,θP)dµ(s, t) +op(1 +kθ−θPk),
which establishes (iii).
In fact, the asymptotic linear expansion
√ n(θbn−θP) (4.1) =−2 M00(θP) −1 Z Z Rk1×Rk2 ˙ D(s, t, θP)Zn(fs, gt,θP)dµ(s, t) +op(1)
holds. This expression coincides with the one derived in Brown and Wegkamp (2002, page 2045). In addition, the conditional distribution of the bootstrap estimators√n(θb∗n−θbn)has the same
limit in probability. Hereθb∗nis based on i.i.d. sampling fromPn, see Section 3. The proof of this
assertion follows from similar arguments as Theorem 4.1, see Brown and Wegkamp (2002, pages 2046 - 2048) and is for this reason omitted.
Theorem 4.2. Assume (A1) – (A5). Then, sup h∈BL1 IE ∗h√n( b θ∗n−θbn) −IEh√n(θb−θP) →0
in probability, asn→ ∞. HereIE∗means the conditional expectation given the data(X1, Y1), . . . ,(Xn, Yn) andBL1is the space of all functionsh:R→[−1,1]with|h(x)−h(y)| ≤ |x−y|for allx, y∈R.
We apply the developed theory to the special cases whereF andG are indicator functions of half-spaces(−∞,·]or exponential functionsexp(t0x).
4.2. Estimators based on the distribution functions. For everys∈Rk1, t∈Rk2 andθ∈Θ, define the empirical distribution functions
Fn(s) = 1 n n X i=1 {Xi≤s}, Gnθ(t) = 1 n n X i=1 {ρ(Xi, Yi, θ)≤t}and Hnθ(s, t) = 1 n n X i=1 {Xi≤s, ρ(Xi, Yi, θ)≤t}.
The criterion functionMnbecomes in this case
Mn(θ)≡M(θ;Pn;µ) =
Z Z
Rk1×Rk2
{Fn(s)Gnθ(t)−Hnθ(s, t)}2 dµ(s, t).
This is essentially the empirical criterion proposed by Brown and Wegkamp (2002). We obtain its theoretical counterpart M(θ) = M(θ;P;µ) by replacing the empirical distributions Fn,Gnθ and
Hnθby the population distributions.
Assumption (A3) is verified ifρ(x, y, θ)is Lipschitz inθ, see Brown and Wegkamp (2002, page 2043, proof of Lemma 3). Assumptions (A2), and (A4) follow from smoothness assumptions on
ρ(·,·, θ)andP. For (A1), we refer to Brown and Wegkamp (2002, Theorem 3, page 2038). We now show how to verify (A5).
We define the sets Aθ,t=
n
(x, y)∈Rk1+k2 : ρ(x, y, θ)≤t
o
, t∈Rk2, θ∈Θ, and the associated collection
A=nAθ,t :θ∈Θ, t∈Rk2
o
.
Note thatG corresponds to the indicators IA of sets A ∈ A, andF corresponds to corresponds
to the indicatorsIBof setsB ∈ B ≡
{x∈Rk1 : x≤t}, t∈
Rk1 , which is universally Donsker. Condition (A5) becomes in this specific setting
(A5’) The classes of setsA,A × BareP-Donsker.
Sufficient conditions forAto beP-Donsker are either smoothness ofρ(x, y, θ)(with respect to xandy, notθ) or thatρranges over a finite dimensional vector space. See Brown and Wegkamp (2002) for a discussion.
Example 4.3. Let {ρ(·,·, θ), θ ∈ Θ} be a subset of a finite dimensional vector space. Then both
AandBare VC-classes, see Van der Vaart and Wellner (1996, section 2.1.1) for a description and many examples of VC classes. From Van der Vaart and Wellner (1996, page 147) it follows that and
A × B, the product of two VC-classes, is again VC. HenceA,BandA × Bare universally Donsker.
Example 4.4. Let the support of (X, Y) be a bounded, convex subset ofRk1+k2 with non-empty interior, and, for each θ, ρ(x, y, θ) have uniformly bounded (by K) partial derivatives through orderβ =bαc, and the derivatives of orderβ satisfy a uniform Hölder condition of orderα−β, and with Lipschitz constant bounded byK. For a complete description of the spaceCKα[X× Y], we refer to Van der Vaart and Wellner (1996), page 154. Ifα > dandP has a bounded density, thenAandA × BareP-Donsker. To see why, we first notice thatA × Bhas constant envelope1, and that
Q|f g−f˜g˜|2 ≤2Q|f−f˜|2+ 2Q|g−˜g|2, and thatfL≤f ≤fU andgL≤g≤gUimpliesfLgL≤f g≤fUgU. Hence
NB(2ε, L2(Q),F × G)≤ NB(ε, L2(Q),F)NB(ε, L2(Q),G),
whereNB(ε, L2(Q),F)is theε-bracketing number of the setF with respect to theL2(Q) norm. SincelogNB(ε, L2(Q),B) .log(1/ε), the bound on the bracketing numbers in Corollary 2.7.3 in Van der Vaart and Wellner (1996) onAimplies thatA × BisP-Donsker.
4.3. Estimators based on the moment generating functions. Assume that X andρ(X, Y, θ) are bounded, so that in particular their m.g.f.’s exist. For everys∈Rk1, t∈Rk2 andθ∈Θ, define the empirical m.g.f.’s φn(s) = 1 n n X i=1 exp(< s, Xi >), ψnθ(t) = 1 n n X i=1 exp{< t, ρ(Xi, Yi, θ)>} and ζnθ(s, t) = 1 n n X i=1 exp{< s, Xi >+< t, ρ(Xi, Yi, θ)>}.
Letk = k1 +k2, andCε > 0be such thatµ[−Cε, Cε]k = 1−ε. In this case we take the random
criterion functionMn
Mn(θ)≡M(θ;Pn;µ) =
Z Z
[−Cε,+Cε]k
{φn(s)ψnθ(t)−ζnθ(s, t)}2 dµ(s, t).
This setting corresponds to
Fε={exp(< t, x >), t∈[−Cε,+Cε]k1}
and
Gε={exp(< t, ρ(x, y, θ)>), t∈[−Cε,+Cε]k2, θ ∈Θ}.
Van de Geer (2000, Lemma 2.5) shows that the box[−Cε, Cε]k1 can be covered by 4Cεδ−1+ 1
k1
manyδ-balls inRk1. Since
Pn|exp(< s, X >)−exp(< t, X >)|2.PnkXk2ks−tk2,
it follows from the above covering number calculation that the uniform entropy condition (cf. Van der Vaart and Wellner (1996, page 127) is met, and consequently the classFε isP-Donsker.
Re-stricting the integration over[−Cε, Cε]k, which hasµ-probability equal to1−ε, forces the function
M to be withinεof the original criterion function, since
Z Z Rk1×Rk2 D2(s, t)dµ(s, t)− Z Z [−Cε,Cε]k D2(s, t)dµ(s, t) ≤µRk\[−Cε, Cε]k ≤ε.
Assumption (A1) will force the corresponding unique minimizers to be close as well. Notice that
Fεis not a Donsker class if we takeCε= +∞.Gεwill be aP-Donsker class if{ρ(·,·, θ) : θ∈Θ}has
this property. This is a consequence of the fact that the Donsker property of a class is preserved under Lipschitz transformations, see Theorem 2.10.6 in Van der Vaart and Wellner (1996, page 192).
Assumptions (A2) and (A3) follow from (A4), smoothness ofρ(·,·, θ), and the smoothness of the exponential function. Again, for (A1) we refer to Brown and Wegkamp (2002, Theorem 3, page 2038).
5. TESTS OF INDEPENDENCE
Our null hypothesis is thatρ(X, Y)andX are independent for some specified structural equa-tion ρ(x, y) = ρ(x, y, θ0). Following the discussion in Van der Vaart and Wellner (Chapter 3.8, 1996), a reasonable test is based on the Kolmogorov-Smirnov type statistic
Kn≡sup s,t
√
n|Pnfs(x)gt(ρ(x, y))−Pnfs(x)Pngt(ρ(x, y))|.
ProvidedF × G,F andGareP-Donsker, the limiting distribution ofKnunder the null is known
and can be bootstrapped (see Van der Vaart and Wellner, 1996, pages 367 -369).
Alternatively, we propose tests based on the criteriaMndefined above. Given observations(Xi, Yi)
we can compute(Xi, Wi)≡(Xi, ρ(Xi, Yi)). Next, we note that
Zn(f, g) ≡ √ n(Dn−D)(f, g◦ρ) = √1 n n X i=1 {f(Xi)g(Wi)−IEf(Xi)IEg(Wi)} −√1 n n X i=1 {f(Xi)−IEf(Xi)} 1 √ n n X i=1 {g(Wi)−IEg(Wi)}
is the same independence empirical process discussed in Van der Vaart and Wellner (1996, Section 3.8). Theorem 3.8.1 in Van der Vaart and Wellner (1996, page 368) states thatZn(f, g)converges
weakly to a tight Gaussian processZH inF × G. Consequently, under the null hypothesis
(5.1) nMn= Z Z Rk1×Rk2 Zn(fs, gt) + √ nD(fs, gt) 2 dµ(s, t) converges weakly to (5.2) Z Z Rk1×Rk2 ZH2(fs, gt)dµ(s, t)
by the continuous mapping theorem. However,
nMn→+∞ (in probability)
under any alternativePX,W with
Z
D2(fs, gt)dµ(s, t)>0,
which, providedFandGare generating classes as in (2.2), (2.3) or (2.4), is equivalent withXand W =ρ(X, Y)are dependent. This implies that the power of the test converges to one under each alternative, that is, the test is consistent.
In lieu of the normal limiting distribution (5.2), we can also rely on the following bootstrap approximation for the distribution of the test statistic under the null. LetPX andPW be the
prob-ability measures ofXandW, respectively, with empirical counterparts denoted byPXn andPWn ,
respectively. Under the null hypothesis, the joint distribution of(X, W)is the product measure PX ×PW, and a natural estimate for the joint distribution of(X, W)isPXn ×PWn . In order to
imi-tate the independence structure under the null hypothesis, we sample from the product measure PXn ×PWn . Let(X1∗, W1∗),· · · ,(Xn∗, Wn∗)be the resulting i.i.d. sample fromPXn ×PWn , and define
1 √ nZ ∗ n(f, g) = 1 n n X i=1 f(Xi∗)g(Wi∗)− 1 n n X j=1 f(Xj∗)1 n n X k=1 g(Wk∗).
Since the bootstrap sample is taken fromPXn ×PWn and not the ordinary empirical measurePn, the
variablesZ∗n(f, g)have conditional mean zero. Van der Vaart and Wellner (1996, Theorem 3.8.3)
obtain sufficient conditions (F × Gsatisfies the uniform entropy condition (cf. Van der Vaart and Wellner (1996, page 171) for envelope functionsF, GandF ×GinL2(P)) thatZ∗n(f, g)converges
weakly toZPX×PW almost surely. Since this limit coincides with the limiting distribution of Zn under the null hypothesis, nM∗n =
R
{Z∗n(fs, gt)}2dµ(s, t) can be used to approximate the finite
sample distribution of nMn in a consistent manner (under the null hypothesis). Note that this
procedure is model based as the resampling is done from the estimated model under the null hypothesis.
In addition, we present a specification test where the composite null hypothesis is the existence of aθ0 ∈ Θsuch that X andρ(X, Y, θ0)are independent. We base the test on the statisticTn ≡
nMn(θb), and we show thatTn equals in distribution approximatelynMn(θ0)plus some drift due
toθbn. In general the limiting distribution depends onθ0, but it can be bootstrapped.
Theorem 5.1. Assume (A1) – (A5) andM(θ0) = 0. Then
nMn(θbn)− Z h Zn(fs, gt,θ0) + √ n(ˆθn−θ0)0D˙(s, t, θ0) i2 dµ(s, t) 0, (5.3) and Z h Zn(fs, gt,θ0) + √ n(ˆθn−θ0)0D˙(s, t, θ0) i2 dµ(s, t) (5.4) is asymptotically tight.
Proof. First, we note thatZn(fs, gt,θ) is stochastically differentiable in θ for all s, t by Condition
(A3). An application of the functional continuous mapping theorem yields that
Z Z
Rk1×Rk2
The stochastic equicontinuity, weak convergence ofθbnand (A2) yield the following expansion of Mn(ˆθn): nMn(θbn) = Z nD2n(fs, gt,θbn)dµ(s, t) = Z hn Zn(fs, gt,θbn)−Zn(fs, gt,θ0) o +Zn(fs, gt,θ0) + √ nD(fs, gt,θbn) i2 dµ(s, t) = Z h Zn(fs, gt,θ0) + √ n(bθn−θ0)0D˙(s, t, θ0) i2 dµ(s, t) +op(1).
Sinceθbnis asymptotically linear [cf. (4.1)], the vector
Zn(fs, gt,θ0),
√
n(θbn−θ0)
converges weakly to a tight limit. Claim (5.3) and (5.4) follow from the continuous mapping
theorem.
Notice that we may write under the null hypothesis Tn=nMn(θb) =
Z h√
n{Dn(fs, gt,θb)−D(fs, gt,θ0)} i2
dµ(s, t).
Motivated by this expression, we propose the following bootstrap procedure. Let(X1∗, Y1∗), . . . ,(Xn∗, Yn∗)
be an i.i.d. bootstrap sample fromPn. The distribution ofTncan be approximated by
T∗n= Z h√ n{D∗n(fs, gt,θ∗)−Dn(fs, g t,θb)} i2 dµ(s, t).
Theorem 5.2. Assume (A1) – (A5) andM(θ0) = 0. Then
sup h∈BL1
|IE∗h(T∗n)−IEh(Tn)| →0
(5.5)
in probability, asn→ ∞.
Proof. By Theorems 3.1, 3.2 and 4.2, the functional continuous mapping theorem and condition (A2), we find T∗n = Z h Z∗n(fs, gt,θ∗) +Zn(fs, gt,θ∗)−Zn(fs, g t,θb) + √ n{D(fs, gt,θ∗)−D(fs, g t,θb)} i2 dµ(s, t) = Z h Z∗n(fs, gt,θ∗) + √ n(θ∗−θb) ˙D(s, t, θ0) i2 dµ(s, t) +op(1) = Z h Z∗n(fs, gt,θ0) + √ n(θ∗−bθ) ˙D(s, t, θ0) i2 dµ(s, t) +op(1)
Finally invoke Theorems 3.1, 3.2 and 4.2 and the conclusion follows easily.
This result says that the distribution ofT∗n can be used to approximate the finite sample
dis-tribution of our test statisticsTn. Again, we note that the power of the test converges to one, as
nMn(θbn)→+∞under any alternativePX,Wwith R
Remark:A model based bootstrap as described in the introduction would resampleX1∗, . . . , Xn∗ fromX1, . . . , Xn andW1∗, . . . , Wn∗ fromWc1 = ρ(X1, Y1,θb), . . . ,Wcn = ρ(Xn, Yn,bθ). LetDb∗n be the
bootstrap equivalent of Dn based on this bootstrap sample. The bootstrap equivalent of Tn,
namely nR
[Db∗n(fs, gt)]2 has the same limiting distribution as Tn following section 2.8.3 in Van
der Vaart and Wellner (1996, pp 173-174).
APPENDIXA. SIMULATIONRESULTS: ESTIMATINGA ONEPARAMETERMODEL We simulate a data set for the simple one-dimensional parameter model
U(y0, y1, y2) =θlogy1+ (1−θ) logy2+W1y1+W2y2+y0 subject to
p1y1+p2y2+y0=I
where0≤θ≤1is the parameter. We set the true parameterθ0 =.4. The first order conditions are w1=p1−
θ y1 w2=p2−1−θ
y2
We use the estimator based on the moment generating functions (section 4.3) to compute our estimate θ. Because of the exponential form of the mgf’s, the random criterion function has aˆ simple exponential form which is computationally inexpensive to evaluate, since the integral is not explicitly computed. To minimize the random criterion function, we use a simple grid search. Below we give the expression forMn(θ)for thekdimensional version of the above 2 dimensional model. In this section we setk= 2whereas in Section B of the appendix we setk= 4.
Mn(θ) =
Z Z
[−2,+2]k
Plugging in values forφ,ψandζ, and settingWi(θ) =ρ(Xi, Yi, θ), we get Mn(θ) = Z Z [−2,+2]k ( 1 n2 n X i1=1 n X i2=1 k Y l=1 eslXil1etlWil2(θ)− 1 n n X j1=1 k Y l=1 eslXjl1etlWjl1(θ) )2 dµ(s, t) = Z Z [−2,+2]k ( 1 n4 n X i1=1 n X i2=1 n X i3=1 n X i4=1 k Y l=1 eslXil1etlWil2(θ)eslXil3etlWil4(θ) + 1 n2 n X j1=1 n X j2=1 k Y l=1 eslXjl1et lWl j1(θ)es lXl j2et lWl j2(θ) − 2 n3 n X i1=1 n X i2=1 n X j1=1 k Y l=1 eslXli1etlWil2(θ)eslXjl1etlWjl1(θ) ) dµ(s, t) = 1 n4 n X i1=1 n X i2=1 n X i3=1 n X i4=1 Z Z [−2,+2]k ( k Y l=1 esl(Xil1+Xil3)etl(Wil2(θ)+Wil4(θ)) ) dµ(s, t) + 1 n2 n X j1=1 n X j2=1 Z Z [−2,+2]k ( k Y l=1 esl(Xjl1+Xjl2)etl(Wjl1(θ)+Wjl2(θ)) ) dµ(s, t) − 2 n3 n X i1=1 n X i2=1 n X j1=1 Z Z [−2,+2]k ( k Y l=1 esl(Xil1+Xjl1)etl(Wil2(θ)+Wjl1(θ)) ) dµ(s, t)
We take forµthe uniform distribution on[−2,+2]k. This makes computing the integral computa-tionally inexpensive since it is simply the integral of exponentials.
In this simulation we draw parameterW from a uniform distribution. This seems to contra-dict Theorem 2.1 which requires the distribution forW to be smooth, but we can approximate a uniform distribution arbitrarily closely by a smooth distribution.
We run two simulations:
(1) The first simulation corresponds to Theorem 4.1. It demonstrates that our estimates are normally distributed around the true value of the parameter we are estimating.
(2) The second simulation corresponds to Theorem 4.2. It demonstrates that the bootstrap estimates are normally distributed around the estimated value of the parameter.
In the first simulation, we randomly sample p1, p2 from U[1,2] and we sample w1, w2 from U[0,1]. The true valueθ0allows us to calculate the corresponding consumer demands. We pick a 100 price and corresponding consumer demands. The supports of the uniform distributions are chosen to ensure an interior solution. We resample values ofp andwa 1000 times and calculate
FIGURE1. Resampled histogram
the estimatedθˆeach time. Recall thatθ0 =.4. We obtain the following results θ= 1 1000 1000 X n=1 ˆ θn= 0.406116 std= v u u t 1 999 1000 X n=1 (ˆθn−θ)2= 0.051247 mse= 1 1000 1000 X n=1 (ˆθn−θ)2 = 0.00266103
and plot the standardized histogram centered aroundθ0(Figure 1)
In our second simulation, we samplep,W (100 points) only once from the same uniform dis-tributions. We estimate our parameterθ, bootstrap the sample a thousand times and obtain the
FIGURE2. Bootstrapped histogram
following results
ˆ
θ=estimated value without bootstrapping= 0.405
θ= 1 1000 1000 X b=1 ˆ
θb =mean of bootstrapped estimates= 0.400463
std= v u u t 1 999 1000 X b=1 (ˆθb−θ)2= 0.051756 mse= 1 1000 1000 X b=1 (ˆθb−θˆ)2 = 0.00269659
And finally we plot the standardized histogram of the bootstrapped estimates centered around our estimateθˆto get Figure 2.
APPENDIXB. SIMULATION RESULTS: ESTIMATINGA THREEPARAMETERMODEL
The purpose of this section is to show that the estimator works well even with as little as 100 data points. The estimator naturally works better with larger data sets. Due to computational complexity we estimate only up to 3 parameters. We also estimate up to second decimal place
accuracy for the same reason. It is possible to make the computations relatively inexpensive using the fast Laplace transform and more sophisticated optimization techniques.
We simulate a data set as in Appendix A with multiple parameters. Hence, our multidimen-sional model is U(y0, y1, y2, y3, y4) = 4 X i=1 θilogyi+ 4 X i=1 Wiyi+y0 subject to
p1y1+p2y2+p3y3+p4y4+y0=I
where0≤θi ≤1,i∈ {1,2,3}are the parameters we must estimate, sinceθ4 = 1−(θ1+θ2+θ3).
The true parameters values are:θ1=.2,θ2 =.3andθ3 =.4.
First, we samplep1, p2, p3, p4 fromU[1,2]andw1, w2, w3, w4 fromU[0,1]. Then we choose 100 price vectors and the corresponding consumer demands. The supports of the uniform distribu-tions are chosen to ensure an interior solution. We obtain the following estimates for our parame-ters:
b
θ1=.23 θ2b =.27 bθ3 =.4
APPENDIXC. SIMULATIONRESULTS(TESTSFORINDEPENDENCE)
We will simulate both the simple and composite null hypotheses outlined in Section 5. Below is an outline of the simulations
(1) The first set of simulations are for the null hypothesis thatρ(X, Y)andXare independent for some specified structural equation ρ(x, y) = ρ(x, y, θ0). We test both when the null hypothesis is true and also some local alternatives when the null is false.
(2) The second set of simulations are for the composite null hypothesis i.e. the existence of a θ0 ∈ Θsuch thatX andρ(X, Y, θ0)are independent. We test separately the independent case as well as cases where there is perfect and slight correlations.
In the first simulations we test the two parameter model used in appendix A. In particular we fix the true valueθ=.4. We generateXandW independently and then back out theY’s using the true value ofθ, and then test for independence ofρ(X, Y)andXfor specified structural equations ρ(x, y) =ρ(x, y, θ0), where we allowθ0to take the true value.4as well as local alternatives.3and .5. We approximate the distribution of the test statistic by bootstrapping the sample and ordering the values of the test statistic from the bootstrapped distribution in ascending order, where we take the95th percentile value as the critical value. The null is rejected if the value of the test statistic
from the original sample is greater than this critical value and repeat this for various sample sizes. Our results are summarized in the following tables
TABLE2. Independence Test Resultsθ0=.4(Trueθ=.4) Sample Size No of Simulations No of Accepts
500 1000 892
1000 1000 989
TABLE3. Independence Test Resultsθ0=.3(Trueθ=.4) Sample Size No of Simulations No of Rejects
500 1000 924
1000 1000 984
TABLE4. Independence Test Resultsθ0=.5(Trueθ=.4) Sample Size No of Simulations No of Rejects
500 1000 887
1000 1000 971
The second simulations requires the generation of independent random vectorsX andW and testing their independence. We generate independent data, dependent data as well as correlated data and test for various sample sizes. The details of the tests are summarized in the tables below.
We first test for dependence
TABLE5. Independence Test Results (wk=pk−1)
Sample Size No of Simulations No of Rejects
500 1000 997
1000 1000 1000
For correlated data we generate multivariate(X1, X2, W1, W2)with mean(0,0,0,0)and covari-ance matrix X1 X2 W1 W2 X1 1 0 σ 0 X2 0 1 0 σ W1 σ 0 1 0 W2 0 σ 0 1
TABLE6. Independence Test Results (σ =.5) Sample Size No of Simulations No of Rejects
500 1000 986
1000 1000 998
TABLE7. Independence Test Results (σ =.1) Sample Size No of Simulations No of Rejects
500 1000 541
1000 1000 712
TABLE8. Independence Test Results (σ= 0) Sample Size No of Simulations No of Accepts
500 1000 935
1000 1000 972
Remark:The parameter estimation procedure works well for small samples sizes ofn= 100,200
but the tests for independence are not effective for these values ofn. REFERENCES
[1] Benkard, C. and Berry, S. (2006). On The Nonparametric Identification Of Nonlinear Simultaneous Equations Models: Comment On Brown (1983) And Roehrig (1988).Econometrica, 74(5), 1429-1440.
[2] Brown, B. W. (1983). The Identification Problem in Systems Nonlinear in the Variables.Econometrica, 51, 175-196. [3] Brown, D. and Calsamiglia, C. (2007). The Nonparametric Approach to Applied Welfare Analysis.Economic
Theory, 31, 183-188.
[4] Brown, D. and Wegkamp, M. (2002). Weighted Minimum Mean-Square Distance from Independence Estima-tion.Econometrica, 70(5), 2035-2051.
[5] Matzkin, R.L. (2005). Identification in Nonparametric Simultaneous Equations.Mimeo. Northwestern Univer-sity.
[6] Roehrig, C. S. (1988). Conditions for Identification in Nonparametric and Parametric Models.Econometrica, 56, 433-447.
[7] Vaart, A. van der (1998).Asymptotic Statistics. Cambridge: Cambridge University Press.
[8] Vaart, A. van der and Wellner, J. (1996).Weak Convergence and Empirical Processes. New York: Springer-Verlag. [9] Wegkamp, M. (1999)Entropy Methods in Statistical Estimation. CWI-tract 125, Amsterdam.
DEPARTMENT OFECONOMICS, YALEUNIVERSITY, BOX208268, NEWHAVEN, CT 06520-8268
E-mail address:[email protected]
DEPARTMENT OFECONOMICS, YALEUNIVERSITY, BOX208268, NEWHAVEN, CT 06520-8268
E-mail address:[email protected]
DEPARTMENT OFSTATISTICS, FLORIDASTATEUNIVERSITY, TALLAHASSEE, FL 32306-4330