The affective state of a player when playing a game has a significant effect on the players motivation and engagement. Recognizing players emotions during games can help game designers improve the user experience by providing sophisticated behaviors to the game characters and the system itself. This thesis presents work towards novel recognition of players emotions using posture skeleton data as input from non-intrusive interfaces. A database of samples of non-acted posture skeleton data was captured during active game playing using Microsoft Kinect sensor.
Four observers were asked to annotate the selected postures with an emotion label from a given emotion set. Based on Cohen’s kappa, the agreement level of the observers was above or equal to good with overall agreement levels that outperform existing bench-marks. The data was used in a series of experiments for training the system in recognizing emotions. The results indicate that the compiled database of postures annotated with emo-tion labels performs considerably above chance level recogniemo-tion of emoemo-tions and offers interesting research questions for improvements and future directions in the area.
AFFECTIVE RECOGNITION FOR GAMES USING BODY POSTURES
Theocharis Zacharatos
A Thesis
Submitted in Partial Fulfillment of the Requirements for the Degree of
Master of Science at the
University of Cyprus
Recommended for Acceptance by the Department of Computer Science
Master of Science Thesis
AFFECTIVE RECOGNITION FOR GAMES USING BODY POSTURES
Presented by Theocharis Zacharatos Research Supervisor Yiorgos Chrysanthou Committee Member Christos N.Schizas Committee Member Efstathios Stavrakis University of Cyprus June, 2012 ii
ACKNOWLEDGEMENTS
I would like to thank my supervisor Dr. Yiorgos Chrysanthou for his significant help and guidance throughout my thesis.
A big thanks to Dr.Christos Gatzoulis for all his help through the duration of imple-mentation and experimental part of my thesis.
In addition i would like to thank Dr. George Pallis and Dr. Chryssis Georgiou for their support.
Furthermore I would like to thank all the people that participated in the experimen-tal part of this project , Panayiotis Charalambous, Nikolas Ladas, Dr. Efstathios Stavrakis, Panayiotis Hadjichristodoulou, Konstantinou Konstantinos, Demetriou Ioannis and Mitrousis Vasileios.
Last but not least, I would like to thank my wife Maria, for her support, love and tolerance.
Chapter 1: Introduction 1
1.1 Project Rationale . . . 1
1.2 Project Objectives . . . 1
1.3 Proposed Solution . . . 2
1.4 Thesis structure . . . 3
Chapter 2: Project Background 4 2.1 Related Theory. . . 4
2.1.1 Affective Computing . . . 4
2.1.2 Emotion in games and adaptive gameplay . . . 6
2.1.3 Motion Capture Systems. . . 9
2.1.4 Body skeleton data. . . 10
2.2 Project Technology . . . 11
2.2.1 Microsoft Kinect Hardware . . . 11
2.2.2 Kinect SDK . . . 14
2.2.3 WEKA - Waikato Environment for Knowledge Analysis . . . 14
Chapter 3: Related studies of affect recognition 16 3.1 Affect Recognition . . . 18
3.1.1 Designing an Affect Recognition System . . . 18
3.1.2 Multimodality . . . 22
3.2 Facial Expression Recognition . . . 23
3.3 Audio Based Affect Recognition. . . 25
3.4 Affective Neuroscience Brain Imaging and EEG. . . 26
3.5 Posture and Motion Data Recognition . . . 27
3.5.1 Role of bodily information play in affect recognition . . . 27
3.5.2 An Architecture of a Posture Recognition System . . . 28
3.5.3 Ground truth labeling . . . 29
3.6 Multimodal Affect Recognition . . . 29
3.6.1 Audio - Visual Multimodal Affect Recognition . . . 31
3.6.2 Using Face and Body Gestures for Affect Recognition . . . 33
Chapter 4: Method 37 4.1 Training & Testing Process . . . 37
4.2 Participants . . . 38 4.3 Training . . . 39 4.4 Data collection . . . 39 4.5 Emotion Annotation . . . 40 4.6 Cohen’s Kappa . . . 41 4.7 Benchmark creation . . . 42 4.8 Recognition Testing . . . 44
4.8.1 Building and testing an emotion recognition model in WEKA . . 44
Chapter 5: Experiment Implementation 49 5.1 Data Files . . . 50
Chapter 6: Results and Discussion 52
6.1 Conclusion . . . 53
6.2 Summary of Achieved Objectives . . . 54
6.3 Project Issues(with proposed Solutions-Actions) . . . 55
6.4 Future Work . . . 55
Bibliography 57
Appendix A: Weka Sample Data file 62
Appendix B: Back propagation algorithm 64
Appendix C: Paired Agreement among all observers - Kappa 67
Appendix D: Generalising for new postures: WEKA Back Propagation Built
Model and Results 70
Appendix E: Informed Consent Form 75
Appendix F: Affective posture observation quiz - sample 76
LIST OF TABLES
1 Paired observer agreement strength . . . 43
2 Agreement score for Observer 2 . . . 43
3 Equipment needed for the experiment . . . 50
4 Detailed Accuracy By Class . . . 74
5 Confusion Matrix . . . 74
1 Paul MacLeans triune brain [35]. . . 5
2 Snapshot at the 5th second of the game . . . 9
3 Joints of the skeleton data and coordinate system . . . 11
4 The Kinect Device . . . 11
5 Acted and Non acted posture examples . . . 28
6 The Affective Posture Recognition System . . . 28
7 A Multi Modal Example . . . 31
8 Accuracies of different methods under various audio SNR conditions . . . 33
9 Flow chart of expression recognition from both face and body gesture modalities . . . 34
10 ASM facial landmark points . . . 34
11 MHI-Image tracking . . . 34
12 Hand tracking by skin color-based tracker . . . 36
13 Position of hands using skin color tracking & position of head using ASM model . . . 36
14 Extract motion areas of hand and head regions. . . 36
15 Comparison of affect recognition methods . . . 36
16 Training how to playing football in kinect . . . 39
17 Screenshot example used by human observers . . . 41 18 Distribution of emotion labels for the 147 postures, according to observer 2 44
19 WEKA’s GUI chooser . . . 45
20 The explorer starting window . . . 46
21 The WEKA explorer with the file loaded . . . 46
22 Selecting back-propagation for the model . . . 47
23 WEKA results . . . 48
24 Experiment environment schematic . . . 49
25 software to capture skeleton and video data from kinect . . . 51 26 Recognition rates for new postures using the back-propagation algorithm . 52 27 Recognition rates for new players using the back-propagation algorithm . 53
Introduction
1.1 Project Rationale
The affective state of a player during a game has a significant effect on their moti-vation and engagement. Often, players lose their interest and stop playing a game, due to negative emotions such as frustration, anger, and so on. On the other hand, players who experience positive emotions during game playing are more likely to continue play-ing the specific game. Therefore, a system that recognizes players emotions durplay-ing game playing can be a useful tool for designing games that can receive affective feedback from the player and respond to this through sophisticated artificial intelligence behavior to the game characters and the game itself.
1.2 Project Objectives
The main purpose of this work is to design and evaluate a system that can recognize emotions using posture data. The objectives of the project are to (a) investigate how
2
to construct a database of postures labeled with emotions. (b) Record data from both single and multiplayer competitive games to capture the rich expressiveness of both game scenarios (c) Utilize state of the art non-intrusive interfaces such as Microsoft Kinect [32] to capture data and provide a system that can be used in todays games. This is particularly important as commercial systems are increasingly adopting such interfaces in contrast to traditional motion capture systems that are expensive, and have unrealistic space requirements to operate. Taking into consideration the limitation of movements and postures that an interface like Kinect can recognize due to its simple setup, it is interesting to see whether it performs similarly to other motion capture systems in terms of recognition accuracy.
1.3 Proposed Solution
The solution proposed contains the following steps:
1. Capture kinect’s motion (video) and skeleton data from different participants (at least 5) playing kinect sports game.
2. Edit the video scenes in which emotion can be recognized by going frame by frame.
3. Annotate the captured data to 3 categories (Concentrating, Defeated or Frustrated and Triumph) with the help of two or more observers.
4. Run statistical test Cohen’s Kappa to evaluate the agreement between the two ob-servers
5. Given that the agreement is satisfactory, use one set of the data, to train the system with various classification algorithms and test the results against another set.
1.4 Thesis structure
The thesis is divided into sections. Chapter 2 contains the related theory of affective computing including emotion in games, and the explanation of how the skeleton data are captured. Then we describe the technology used in the experiments and finally the related work in the field separated by modality. In chapter 3 define the method that was used, participants selected, the training, the data collection emotion annotation and benchmark creation and finally how we make the recognition by using WEKA[31]. Next in chapter 4, we present the system installation for the live environment and system components and integration of the experiment. In chapter 5 we present the experiment implementation, the method and tips used before, during and after the experiment. Finally in chapter 6 we present the results and conclusion about the objective, project issues with proposed solutions and future work.
Chapter 2
Project Background
2.1 Related Theory
2.1.1 Affective Computing
The latest scientific findings indicate that emotions play an essential role in decision making, perception and learning, that is, they influence the very mechanisms of rational thinking. Not only too much, but too little emotion can impair decision-making. Ac-cording to Rosalind Picard[34], if we want computers to be genuinely intelligent and to interact naturally with us, we must give computers the ability to recognize, understand, even to have and express emotions.
Affective computing is the study and development of systems and devices that can recognize, interpret, process, and simulate human affects.
Emotion is fundamental to human experience, influencing cognition, perception, and everyday tasks such as learning, communication, and even rational decision-making. However, technologists have largely ignored emotion and created an often-frustrating
experience for people. Affective Computing research combines engineering and com-puter science with psychology, cognitive science, neuroscience, sociology, education, psychophysiology, value-centered design, ethics, and more.
The actual seat of emotion in human brain is not unambiguous. Paul MacLean has modeled the human brain as three regions: neocortex, limbic system(s), and reptilian brain [35]. The neocortex is traditionally the best studied, and contains the visual cortex and auditory cortex; it is where the majority of perceptional processing has been assumed to occur. The limbic system is the primary seat of emotion, attention, and memory.
Figure 1: Paul MacLeans triune brain [35].
Emotions can hijack our rationality in situations of fear, panic, or love. They can strongly affect our decision-making even in normal situations, someone might be called very emotional person.
Evidence indicates that laws and rules do not operate without emotion in two highly cognitive tasks: decision making and perception. Detecting emotional information begins with passive sensors that capture data about the user’s physical state or behavior without interpreting the input. The data gathered is analogous to the cues humans use to perceive emotions in others. For example, a video camera might capture facial expressions, body posture and gestures, while a microphone might capture speech. Other sensors detect
6
emotional cues by directly measuring physiological data, such as skin temperature and galvanic resistance.
Recognizing emotional information requires the extraction of meaningful patterns from the gathered data. This is done using machine learning techniques that process different modalities speech recognition, natural language processing, or facial expression detection, and produce either labels (i.e. frustrated) or coordinates in a valence-arousal space.
2.1.2 Emotion in games and adaptive gameplay
Adaptive Gameplay[36] is an upcoming research area with the goal of making it possi-ble for videogames to automatically adapt themselves to the preferences of the individual player. Adaptive Gameplay focuses on the possibilities to adapt, based on the personality of each player.
Over the years video gaming market has been growing explosively. The developers of a game create the game with a specific goal in mind. While for most games this goal is simply to present the players with a pleasurable and enjoyable experience, there are also games that are designed to give players an intellectual challenge or games that try to simulate realistic situations. The game offers the same gameplay experience for everyone and for that reason Adaptive Gameplay offers a tool to make videogames dynamic and able to adapt to the individual player.
The possibilities of adapting gameplay are wide. Almost every detail of a game can be changed based on a huge amount of information that can be gathered from the player. The
Adaptive Gameplay aims on changing the actual gameplay content, making it possible to serve the player with situations he prefers playing. Changing the affective side of a videogame can ensure a more complete, immersive, and engaging gameplay experience and can also be a very important tool for the future of Games.
Affective Gaming aims at augmenting the emotions experienced in the game and can be used in any situation imaginable where an interaction takes place. These are, however, changes that do not really influence the course or content of the game, but rather the overall feeling that it gives. Research is based around the emotions and the way they can be delivered through a virtual game, and focuses on the preferences of people with different personality traits.
2.1.2.1 Personality and Games
Whilst there is almost no research indicating that a player’s personality will increase his entertainment, there is a link between personality and the environment the person is in[10]. Games take place in a virtual world. Players take on a virtual role and can do anything in this virtual world without having consequences on their actions. The personality of someone in a game, differs from their personality in the real world.
2.1.2.2 The future of Adaptive Gameplay
The more knowledge about players and respective personalities is essential to the improvement of Adaptive Gameplay [11]. Also the lack of a standardized measurement for entertainment should be addressed. The lack of such an instrument makes it very difficult to assess the functionality of adaptations.
8
• When the gameplay should be changed
a) More information about the state of the player could help out.
b) Gathering external, real-time information can be done in various ways.
• Revolution of large online communities
2.1.2.3 Game Adaptivity Impact on Affective Physical Interaction
Affective gaming has recently attracted significant attention within the affective com-puting community. Emotion recognition has been seen when monitoring children and adults playing. Some scientists over the years examined correlations between physio-logical signals, galvanic skin response, jay electromyography (EMG), respiration and cardiovascular measures and reported adult user experiences in computer games [36].
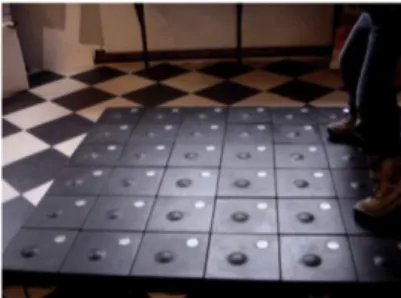
A sample game that used for experiments, is called Bug-Smasher[36]. The game is developed on a 6x6 square playground [12], comprising 36 tiles each incorporating pro-cessing power, communication, input (force pressure sensor) and output (light) as in Fig-ure 2. During the game, different colored lights appear sequentially on the game surface and disappear again after a short period of time as a tiles light turns on and off respec-tively. The light position is picked randomly according to a predefined level of spatial diversity, measured by the entropy of the visited tiles and the goal is to smash as many lights as possible. Some characteristics of experiment are: normal weight participants, Heart rate, blood volume pulse and skin conductance recorded in real time.
Results of the experiment demonstrate the robustness and generality of the model in predicting reported entertainment preferences, even in adaptive physical interactive
Figure 2: Snapshot at the 5th second of the game
games. Also it shows that adjustments of internal game controls (challenge, curiosity) have an impact on the performance of the adaptation mechanism and furthermore on expressed preferences of children.
2.1.3 Motion Capture Systems
Motion capture is a system that records movement of one or more objects or persons. It is used in military, entertainment, sports, and medical applications, and for validation of computer vision and robotics. In filmmaking, and games, it refers to recording actions of human actors, and using that information to animate digital character models in 2D or 3D computer animation. A performer wears markers near each joint to identify the motion by the positions or angles between the markers.
Optical motion capture systems utilize data captured from image sensors to triangu-late the 3D position of a subject between one or more cameras calibrated to provide over-lapping projections. Data acquisition is traditionally implemented using special markers attached to an actor; however, more recent systems are able to generate accurate data by tracking surface features identified dynamically for each particular subject. Tracking a
10
large number of performers or expanding the capture area is accomplished by the addi-tion of more cameras. These systems produce data with 3 degrees of freedom for each marker, and rotational information must be inferred from the relative orientation of three or more markers; for instance shoulder, elbow and wrist markers providing the angle of the elbow.
2.1.4 Body skeleton data
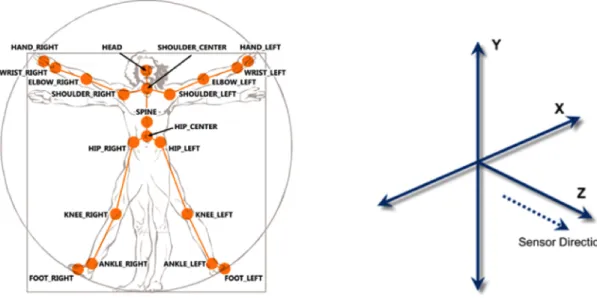
Skeleton tracking can be processed by depth image data, to establish the positions of various skeleton joints on a human form. For example, skeleton tracking determines where a user’s head, hands, and center of mass are. Skeleton tracking provides X, Y, and Z values for each of these skeleton points as in Figure 3. Skeleton tracking systems ana-lyze depth images employing complicated algorithms that use matrix transforms, machine learning, and other means to calculate skeleton points.
The skeleton data can be captured as a set of joints and the coordinate system is a full 3D system with values in meters. There are operations for converting between Skeleton Space and Depth Image space. The SDK supports up to two players (skeletons) being tracked at the same time. A player index is inserted into the lower 3 bits of the depth data so that you can tell which depth pixels belong to which player.
Figure 3: Joints of the skeleton data and coordinate system 2.2 Project Technology
2.2.1 Microsoft Kinect Hardware
Figure 4 displays the Kinect sensor[32]. It is a horizontal unit with a motorized pivot at the base. The device contains an RGB camera, a multi-array microphone and a depth sensor. Using these systems the Kinect is capable of full body 3D motion capture, face and voice recognition.
12
2.2.1.1 Kinect Camera
The Kinect camera is an RGB device with a resolution of 640x480 and a 32 bit color range. Working at a rate of 30 frames per second this camera, with the aid of software can recognize human gestures, facial expressions and 20 human joint movements per player. The response time of the camera is 33ms. A maximum of 6 players can be tracked, but only two players are monitored for skeleton capture.
The Kinect sensor is limited as to how far it can see and has a working range of between 1.2 and 3.5 meters. The horizontal field of view is 57◦ wide, which means at its maximum range it will be able to scan a scene 3.8 meters wide. The sensor has a vertical field of view of 43◦. This field of view is enhanced by the vertical pivot system that allows
the sensor to be tilted up or down by as much as 27◦in either direction.
2.2.1.2 Kinect depth sensor
The Kinect consists of two parts: the IR laser emitter and the IR camera. The IR laser emitter creates a known noisy pattern of structured IR light at 830 nm.
The depth sensing works on a principle of structured light. Theres a known pseudo-random pattern of dots being pushed out from the camera. These dots are recorded by the IR camera and then compared to the known pattern. Any disturbance are known to be variations in the surface and can be detected as closer or further away. This approach creates three problems, all derived from a central requirement: light matters.
• The wavelength must be constant
• Distance is limited by the emitter strength
The wavelength consistency is mostly handled by the Kinect itself. Within the sensor, there is a small peltier heater/cooler that keeps the laser diode at a constant temperature. This ensures that the output wavelength remains as constant as possible (given variations in temperature and power).
Ambient light is the base of structured light sensors, and there are measures put in place to mitigate this issue. One is an IR-pass filter at 830 nm over the IR camera. This prevents stray IR in other ranges (like from TV remotes and the like) from blinding the sensor or providing spurious results. However, even with this in place, the Kinect does not work well in places exposed to a lot of light since sunlights wide band IR has enough power in the 830 nm range to blind the sensor.
The distance at which the Kinect functions is also limited by the power of the laser diode. The laser diode power is limited by what is eye safe. Without the inclusion of the scattering filter, the laser diode in the Kinect is not eye safe; its about 70 mW. This is why the scattering innovation by Prime Sense is so important: the extremely bright center dot is instead distributed amongst the 9 dots, allowing a higher powered laser diode to be used.
The IR camera operates at 30 Hz and pushes images out at 1200x960 pixels. These images are downsampled by the hardware, as the USB stack cant handle the transmission of that much data (combined with the RGB camera). The field of view in the system is 58◦ degrees horizontal, 45◦ degrees vertical, 70◦ degrees diagonal, and the operational range
14
1 cm in Z (depth). The camera itself is a MT9M001 by Micron, a monochrome camera with an active imaging array of 1280x1024 pixels, showing that the image is resized even before downsampling.
This system enables the Kinect to see in 3D in all kinds of ambient lighting conditions. The sensor range is automatically adjusted by software and the range can be tuned to take account of the room size and obstructions such as furniture.
2.2.1.3 Kinect Microphone
The Kinect microphone is capable of localizing acoustic sources and suppressing am-bient noise. Physically the microphone consists of an array of 4 microphone capsules. Each of the four channels processes sound at in 16 bit audio at a rate of 16 KHz.
2.2.2 Kinect SDK
Kinect for Windows SDK supports applications built withC++, C#, or Visual Basic by using Microsoft Visual Studio 2010. The newly release Kinect for Windows SDK version 1 offers skeletal tracking, speech recognition, modified API, and the ability to support up to four Kinect for Windows sensors plugged into one computer. It enables raw sensor streams like depth sensor and there is also improved synchronization between color and depth, mapping depth to color, and a full frame API.
2.2.3 WEKA - Waikato Environment for Knowledge Analysis
Weka[31] is a software made by the University of Waikato, and contains collection of machine learning algorithms for data mining tasks. The algorithms can either be applied
directly to a dataset or set using your own Java code. Weka contains a collection of visualization tools and algorithms for data analysis and predictive modeling, together with graphical user interfaces for easy access to this functionality. It also contains tools for data pre-processing, classification, regression, clustering, association rules, and visualization. It is also well-suited for developing new machine learning schemes.
WEKA was used for kinect skeleton and motion data classification. We give as an input an ARFF (Attribute Relationship File Format) text file that contains two sections. The header and the data section. In the header section is the list of attributes, each one associated with a unique name and type. The latter describes the kind of data contained in the variable and what values it can have. The classification attribute is the last in the list. In the data section there are skeleton data frames, that we want to classify line by line.
Chapter 3
Related studies of affect recognition
To date, many computer software solutions that can recognize a persons identity by us-ing specific data such as video, voice, images, etc. have been proposed. But no sufficient explanation has been found in which the computer can accurately determine a persons feelings. Affective computing (AC) is the solution that will bring computer systems into a new era where they can recognize and respond to human feelings. The idea behind Affective Computing is that if a computer can adjust the software interface based on the users affective state, the quality of the interaction will enhance making the interface more enjoyable, usable and effective.
The last few years, the only people interested in human emotion were phychologists. In 1980 for the first time Turkle[14] suggested that computers might be used to study emotions but it took ten years for systematic research programs to emerge in this front. Picard[34] describes three types of Affective Computing Applications:
1. systems that detects the emotions of the user
2. systems that express what a human would perceive as an emotion and
3. systems that actually feel an emotion
There has been research in the field of emotion recognition using various modalities. The most widely used technique has been through facial expressions [30]. Nevertheless, body posture and movement recently started to interest researchers in the field. One approach uses cyclic arm movements to recognize fundamental emotions [24]. A number of experiments that use acted data as the training set for the recognition system have already been presented. Coulson [25] investigates recognition accuracy, confusions, and viewpoint difference while attributing emotions to postures. Kleinsmith et al. [28] use emotion recognition from low level posture data to report cross-cultural differences.
In another study [27], [29], automatic recognition models grounded on low-level pos-ture descriptions were built and tested for their ability to generalize to new observers and postures using random repeated subsampling validation. The automatic recognition models achieve recognition percentages comparable to the human base rates.
Another approach deals with movement qualities such as amplitude, speed and fluidity of movement to infer emotions instead of low level posture data [26]. Similar to this, Savva and Bianchi-Berthouze use non-acted data captured during Nintendo Wii game playing to extract movement features to recognize emotion from animation rather than posture [33]. In this approach, human recognition of emotion is taken through observation of skeletal information only. In our approach, both video and skeleton data is given to the human observers during labelling, as during experimentation, a number of postures
18
could not be predicted using skeleton data only, as humans are capable of using multiple modalities at the same time to express emotions.
Moreover, all the above approaches use body posture or animation data captured from traditional motion capture equipment, which is not as ubiquitous as Kinect. Kinect is not as accurate as traditional motion capture devices so this raises a question about whether it is practicable to capture training data for the recognition system using Kinect.
3.1 Affect Recognition
Recognizing human emotions is a very ambiquous and challenging process since they cannot be measured accurately, because the vary between individuals. We need to show how we can blend the complex scientific theories of human emotions with the practicality of engineering in order to develop affect sensitive interfaces.
3.1.1 Designing an Affect Recognition System
3.1.1.1 Databases
The most important issue to be addressed before designing an Affecting Computing application is the structure and the description of an affect. Both together provide critical information for the affect displays that emotion recognition systems are design to detect. In affect detection we will use the most common and old way that physiologists used to describe emotions which is in terms of discrete categories. An example of this description is the prototypical emotions categories such as happiness, sadness, fear, anger, disgust and surprised. One can argue (and will be right) that emotions are not limited to these six
categories[37]. Further more it can also be argued that in many situations these categories appear together at the same instance. So what is the accurate size of labels to be used for emotions in an applications database? Are those six sufficient? What are the emotions we are interested in for the application we are going to develop? The size of the descriptions to be used, or labels as we are going to refer on them for now on, is the first and the most important characteristic of the systems database. If we choose a large size of labels we will increase the complexity of recognition, choosing a very small one on the other hand we might end up with a very simple and at the end not very useful system.
Another way of categorizing emotions is the use of dimensions. These dimensions include evaluation, power, activation, control etc. The evaluation dimension measures the persons feeling from positive to negative. The activation measures whether a person is more likely to take an action under an emotional state from active to passive. We mostly use this representation if we want to label a range of emotions.
The next question to be answered is what data we should use as a basic reference for the system to decide about an emotion. Data were collected consisting of videos and sound1 from several different sources. Sound data are collected from interviews recordings, customer support recordings and meeting recordings. Those data are later analyzed by dictionaries, spectral characteristics, prosody, frequency of repeated words or phrases, speaker voice tension and pauses in speech. Dictionaries are used in order to search for words or phrases that suggest an emotion. Spectral characteristics describe the relation of a given audio weave with certain behaviors. Prosody, frequency of repeated word or phrases, speakers voice tension and pauses are the common everyday used criteria
20
in deciding emotions from speech. Video data are collected from video recordings during certain activities (also known as video kiosk), video recording of interviews and videos that can be found on the web2 . To analyze video data facial expressions, such as muscle movement in various parts of the face, are observed. But in many cases, video data suffer from poor lighting and bad angle of capture. In order to eliminate these phenomena, if they occur, we develop a 3D reconstruction of the video and later we proceed in analyzing it. The decision about what label should be given to each sound or video data is made by an expert in the field of psychology. This procedure may take a lot of type especially if we want to use a very large set of labels.
Spontaneous emotions do not always give us the clarity we need in order to decide about a certain emotion and at the end are not suited for the purposes of the system we design. A common approach in collecting data as mentioned above is the interviews recordings. In these interviews we deliberately present to the individual appropriate cho-sen material in order to record his reactions. An example of these is gathering a number of people to watch a comedy play in a theatre and during the play a camera records their reactions. However, increasing evidence suggests that deliberate behavior differs in visual appearance, audio profile, and timing from spontaneously occurring behavior.
Another important characteristic of a database is the number of entries. A large num-ber of entries could lead to more accurate decisions but also in large computational or training time. Choose to use a very small number of entries in the database and you might end up with a wrong judgment, due to insufficient recordings. Choosing the correct size
of the data entries lays many times in a trial and error procedure or the experience of the designer.
The last but not least of the issues of database characteristics is the accessibility of the database. Databases which contain these types of data can be either public or private. A very large effort is being made for a collection of databases containing both spontaneous emotions and deliberate emotions3 .Public databases are more commonly to contain de-liberate emotions. Databases which contain spontaneous emotions in many cases are dimmed of being published due to the lack of appropriate agreement of subjects. The reason is that spontaneous displays of emotions reveal personal and intimate experience. So privacy issues jeopardize their public accessibility.
3.1.1.2 Decision Techniques
Many techniques have been proposed over the years for decision making in Affect Recognition Systems. The most important technique used in a variety of different sys-tems comes for the field of Artificial Intelligent. The first technique, is to train a neural network to work with a set of data which comes from the database described above in order to decide about the human emotions. A neural network can also be trained for classification of data. Mota and Picard[41] used this technique in their Tekscans Body Pressure Measurement System (BPMS).
The second technique that is used to evaluate a humans emotion via a system, is by using heuristics. In more precise terms, heuristics are strategies using readily accessible, though loosely applicable, information to control problem solving in human beings and
22
machines. Scherers GENESE expert system was built on a knowledge base that mapped appraisals to different emotions as predicted by Scherers heuristics and theory[8]. The system was successful in achieving a high accuracy (77.9 %) at predicting the target emotions for 286 emotional episodes described by subjects as a series of responses to situational questions.
3.1.2 Multimodality
It is a common observation that emotions can be expressed by multiple physiological response systems. So trying to correctly decide for a persons emotions from by gathering information from a single modality may lead you to a false outcome. Think of a person being upset about a particular thing. That person will raise their voice, the motion of their hands will increase, their face probably will turn red etc. The hallmark of emotion theory is that during an emotion episode we have responses from multiple systems bound in space and time. Multimodality was widely advocated but rarely implemented until few years before. The problem was the unisensory detection that was needed which increase in multisensory environments.
To combine signals from different sensors we use the following 3 methods[23]:
• Data Fusion: Data Fusion is performed on the raw data for each signal and can only be applied when the signals have the same temporal resolution. This technique can be used for intergrading psychological signals coming from the same recording equipment. It could not be used to intergrade a video signal with a text subscript.
The main reason though that is not widely used is the sensitivity that has on noise when noise is produced by malfunction or misalignment of the different sensors.
• Feature Fusion: Feature fusion is performed on the set of features extracted from each signal.
• Decision Fusion: Decision Fusion is performed by merging the output of the clas-sifier for each signal. Hence, the affective states would first be classified from each sensor and would then be integrated to obtain a global view across the various sen-sors. It is the most commonly used approach for multimodal HCI.
3.2 Facial Expression Recognition
The face plays an important role to emotion expression so most of the vision based affect recognition studies focus on facial expression analysis. In the current research on the machine analysis of facial expressions, we can distinguish two main streams. The first is the recognition of affect and the second the recognition of facial muscle action.
Most of the work done on the automatic facial expression recognition was based on deliberate or in many times exaggerated facial displays. However, several efforts have been recently reported on the automatic analysis of spontaneous facial expression data. Some of them study the automatic recognition of action units, rather than emotions, from spontaneous data displays. Studies have also been made in order to detect the differences between a spontaneous and an exaggerated data display. As an example of such studies is the system proposed by Valstar[5], which characterizes temporal dynamics of facial actions and employ parameters like speed, intensity, duration, and the co-occurrence of
24
facial muscles activations to classify facial behavior present in a video as either deliberate or spontaneous. Other work includes the study of Zeng [37] for separating emotional state from non emotional state, separating posed from genuine smiles, and studies for the recognition of pain from facial behavior.
The best facial expression recognizers employ various pattern recognition approaches and are based on 2D spatiotemporal facial features. The most common facial features extracted are either geometric features such as the shapes of the facial components (eyes, mouth, etc.) and the location of facial salient points (corners of the eyes, mouth, etc.) or appearance features representing the facial texture, including wrinkles, bulges, and furrows. The best solution would be to use both geometric and appearance features. The best examples for this practice are those proposed by Tian[42] who used facial component shapes and the transient features like crow-feet wrinkles and nasal-labial furrows, and that of Zhang and Ji[43] who used 26 facial points around the eyes, eyebrows, and mouth, and the transient features proposed by Tian. Its worth to mentioning that most of the existing 2D Feature Based methods are suitable for the analysis of facial expressions under a small range of head motions hence the recognition is based on recordings in near frontal view. As last we mention the facial expression analysis based on 3D face models. One state of the art implementation on this field is the work of Huang and his colleagues[44]. They used features extracted by a 3D face tracker called the Piecewise Bezier Volume Defor-mation Tracker[45]. Given that the subject can be recorded in less controlled real-world settings, the progress of this methodology may yield view- independent facial expression recognition, which is important for spontaneous face recognition.
3.3 Audio Based Affect Recognition
The most common method of detecting emotions is through audio. This states that the system is recognizing a subset of basic emotions from speech signals. However recently new methods have found that propose interpretation of speech signals in terms of certain application-dependent affective states. Devillers and Vidrascu[4] are using lexical cues resulting in a better performance than using paralinguistic cues to detect relief, anger, fear, and sadness in human to human medical conversations. Also some studies introduce the idea of using a combination of acoustic and linguistic features to improve vocal affect recognition. [17],[46]
Although this can show an improvement on vocal recognition in many cases the auto-matic extraction of these related features can be a very difficult problem. Existing systems based on this idea cannot reliably recognize the verbal content of emotional speech. Fur-thermore extracting semantic discourse information is even more challenging. Most of these features are either extracted manually or by transcripts.
The state of the art in research at the moment for Audio Based Affect Recognition is including:
• Detect non-basic affective states, including coarse affective states such as negative and non- negative states, application-dependent affective states, and nonlinguistic vocalizations like laughter and cry.
• Integrate paralinguistic features and linguistic features such as lexical, dialogic, and discourse features.
26
• Use of contextual information to improve the affect recognition performance.
• Affective states across languages.
• Influence of ambiguity of human labeling on recognition performance and proposed measures of comparing human labelers and machine classifiers.
• Advanced techniques in feature extraction, classification, and natural language pro-cessing.
3.4 Affective Neuroscience Brain Imaging and EEG
Neuroscientists new techniques in brain imaging help map the neural circuitry that underlies emotional experience. An example of the contribution of neuroscience in un-derstanding human emotions and detect them are the evidence provided to the discussions on dimensional models where valence and arousal might be supported by distinct neural pathways. One of the most popular methods that neuroscientists use is the Functional Magnetic Resonance Imaging [47]. Immordino-Yang and Damasio[48] used evidence from brain damaged subjects to prove that emotions are very important in decision mak-ing. Scientists observed that patients with a lesion in a particular section of the frontal lobe showed normal logical reasoning but yet they could not see the consequences of their actions and were unable to learn from their mistakes. By that observation scientist then could conclude that emotion related processes were required for learning, even in areas that had previously been attributed to cognition.
Unfortunately the cost, time resolution, and the complexity of setting up protocols that can be used in real world activities are still problematic issues that put the application development with use of these techniques to a hold. Nevertheless, signal processing[49] and classification algorithms[50] for EEG have been developed in the context of building Brain Computer Interfaces.
3.5 Posture and Motion Data Recognition
With the emergence of the affective computing field, various studies have been car-ried out to create systems that can recognize the affective states of their users by analyzing their body expressions in order to recognize, understand and model human emotion. Hu-man understand emotions with language & sound of the voice, context and non-verbal communication, than includes facial expressions and body postures and movement.
3.5.1 Role of bodily information play in affect recognition
Bodily expressions have been recognized as more important for nonverbal commu-nication and changes in a persons affective state are also reflected by changes in body posture. The type of information about the body that is necessary for recognizing the af-fective state displayed, according to a neuroscience study by Giese and Poggio[51], there are two separate pathways in the brain for recognizing biological information, one for form information (i.e. the description of the configuration of a stance) and one for the motion information.
28
Studies showed[52] that combination of face and gesture is 35% more accurate than facial expression alone. There are two type of Body Motion based affect recognition, using acted data which the entirety of the movement encodes a particular emotion and non acted data which are more natural data like knocking door, lifting hand, walking etc.
Figure 5: Acted and Non acted posture examples
3.5.2 An Architecture of a Posture Recognition System
An architecture of a system to recognize affect from non-acted subtle body expres-sions represented as a sequence of postures like Figure 5, of a person playing a video game by using only the information about the configurations of the postures without con-sidering the temporal information[33]. A motion capture system is used to record the sequences of postures from the players. The system is implemented as a combination of an affective posture recognition module and a sequence classification rule to finalize the affective state of each sequence as you can see in Figure 6.
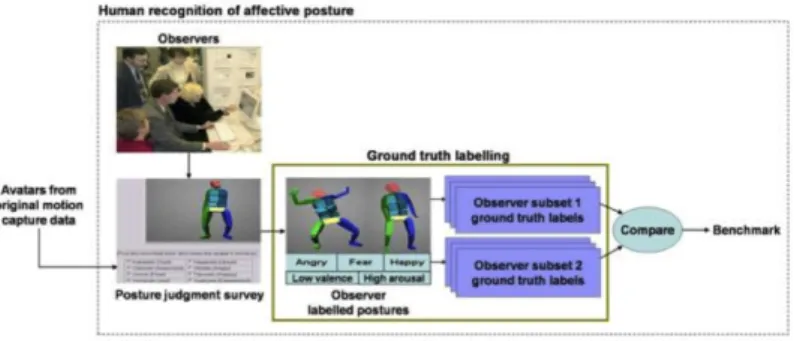
3.5.3 Ground truth labeling
To test human performance in recognizing affect from posture, the ground truth must be built; labels need to be assigned to the affective postures. In the acted postures study, the actors labels and dimension ratings are not used because the actors may not portray what they intend to portray as they are not professional actors. In the non-acted postures study, the players are not used to label their own postures because self-reported feelings at the end of a task are notoriously unreliable, and it is not feasible to stop the players during the gaming session to ask them their current affective state. Furthermore, because the complete affective state is expressed through the combination of a variety of modalities in the non-acted scenario in particular, it is difficult for the players to be aware through which modality affect was expressed or if their bodies were expressing their true feelings. Thus, the approach used in this research is to build ground truth labels from outside observers judgments of the postures using posture judgment surveys.
3.6 Multimodal Affect Recognition
The past few years, scientists are focusing towards multimodal affect recognition for several reasons. Firstly, some psychological researches indicated that judging someones affective state, people mainly, rely on facial expressions and vocal intonations. Hence more than one method of recognition is insufficient. Another motivation for multimodal recognition is the fair engineering prospect of improved reliability. More specifically, cur-rent techniques for detection and tracking of facial expressions are sensitive to head pose,
30
clutter, and variations in lighting conditions, while current techniques for speech process-ing are sensitive to auditory noise. Due to complementarity and redundancy of the data coming from the two channels, audiovisual human affect recognition is expected to per-form more robustly than uni-modal methods. Thus, affect recognition should inherently be the issue of multimodal analysis.
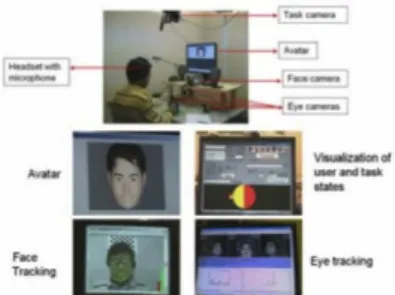
An example of such a system is shown in Figure 7. This figure illustrates a proto-type of such an affect-sensitive, multimodal computer-aided learning system.[53] In this learning environment, the user explores Lego gear games by interacting with a computer avatar. Multiple sensors are used to detect and track the users behavioral cues and his or her task. More specifically, a camera is used to record the users facial expressions, a set of cameras are used to track eye movements, another camera is used to monitor the progress of the task, and a microphone is used to record the speech signals employed subsequently to recognize the speech and analyze prosody. Multisensory information is then processed and visualized, including the users emotional state, engagement state, the utilized speech keywords, and the gear state. Based on this information, the avatar offers an appropriate tutoring strategy in this interactive learning environment.
To build a testing set for automatic recognition, posture sequences were automatically extracted from the remaining replay windows (i.e., those not used to build the training set). The automatic extraction yielded posture sequences ranging from two to 40 frames in length. 836 posture frames across 75 posture sequences were extracted. A set of observers recruited for labeling the set of sequences. As opposed to labeling each individual posture within a sequence as was done for the training set preparation, the observers viewed each
sequence in the testing set as an animated clip of a simplistic humanoid avatar and were asked to assign a unique label to the sequence. This approach was taken to set the target system performance as the level of agreement obtained by observers who considered both form and temporal information.[29]
The within observers agreement was 66.67% with kappa reaching 0.162, indicating slight agreement. There were 14 posture sequences with the defeated ground truth label, 8 triumph, 39 neutral and 14 ties. In the case of ties, the ground truth was randomly selected between the two tied labels.
Figure 7: A Multi Modal Example
3.6.1 Audio - Visual Multimodal Affect Recognition
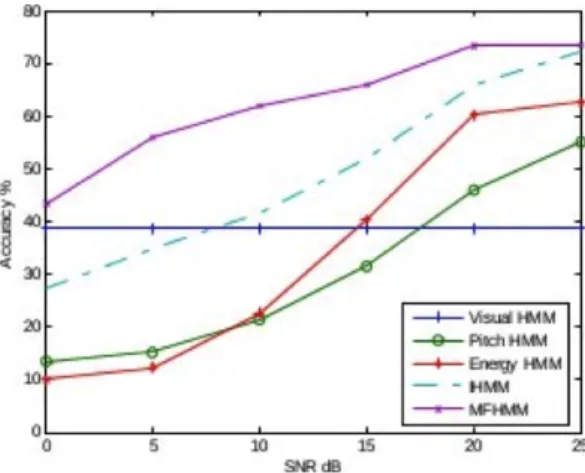
In this first application, we are focusing on the development of a computing algorithm that uses both audio and visual sensors to detect and track a users affective state to aid computer decision making[53]. Using a new Multi-stream Fused Hidden Markov Model (MFHMM), coupled audio and visual streams were analyzed to detect 4 cognitive states (interest, boredom, frustration and puzzlement) and 7 prototypical emotions (neural, hap-piness, sadness, anger, disgust, fear and surprise). The MFHMM allows the building of an
32
optimal connection among multiple streams according to the maximum entropy principle and the maximum mutual information criterion.
This application was tested in a person- independent affect recognition problem by using leave-one- out cross validation scheme. For this test, all of the sequences of one subject were used as the test sequences, and the sequences of the remaining 19 subjects were used as training sequences. The test was repeated 20 times, each time leaving a different person out. The evaluation metric which was being used was the accuracy of each method. Five different cases were used to evaluate the ability of this algorithm. These cases were the following:
• The use of only face features
• The use of only audio features
• The use of an energy Hidden Markov Model
• The use of an independent Hidden Markov Model which assumes that face and pitch features are independent
• The use of the present application, of the Multistream Fused Hidden Markov Model which assumes statistical dependency between face and audio features and energy.
The results were very encouraging for this new method, MFHMM. As Figure 8 shows, the accuracies achieved from this new method under various audio SNR4 conditions are the best between the five cases we have examined. As a result, it is clearly shown that
these new multi modal methods have better results than using methods with only uni-modal information.
Figure 8: Accuracies of different methods under various audio SNR conditions
3.6.2 Using Face and Body Gestures for Affect Recognition
In this second application the Histogram of Oriented Gradients on the MHI-HOG 5 is combined with the Image-HOG 6 [54] to capture both motion and appearance infor-mation of. The MHI-HOG captures motion direction of an interest point as an expression evolves over the time. The Image-HOG captures the appearance information of the corre-sponding interesting point. Combination of MHI-HOG and Image-HOG can effectively represent both local motion and appearance information of face and body gesture for af-fect recognition. The temporal normalization method explicitly solves the time resolution issue in the video-based affect recognition.
5Motion History Image
34
Figure 9 shows the general method to incorporate the temporal dynamics in expression recognition from both face and body gesture modalities. So, this method is separated into the following layers:
Figure 9: Flow chart of expression recognition from both face and body gesture modalities
3.6.2.1 Facial Feature Extraction and Representation Layer
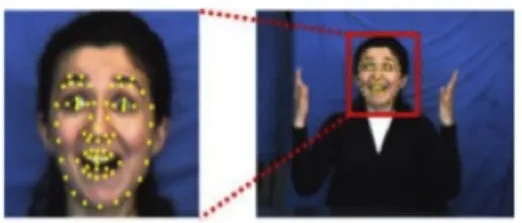
There are three steps to extract facial features. The first step is to track the facial landmark points using the ASM[55] model as shown in Figure 10. The second step is to extract the Image-HOG and the third step to extract the MHI-HOG descriptors of the facial landmark points. As shown in Figure 11, the MHI image captures motion informa-tion of the facial landmark points, while the original image can provide the corresponding appearance information.
3.6.2.2 Body Gesture Feature Extraction and Representation Layer
For body gesture, the Image-HOG and MHI-HOG are being extracted for both hand regions. In addition, the positions and motion areas of both hand and head regions are employed to measure their trajectory and motion intensity. Before we extract the body gesture features, a simple skin color-based hand tracking is applied to detect hand regions as shown in Figure 12[56]. The center position of the head is extracted based on the ASM facial landmark points, as shown in Figure 13. Then the center points of the hand and head regions are employed, with reference to the neutral frames corresponding positions, to describe the location of the hands and the head respectively.
The hands and head positions are further normalized with the subjects height, which is measured from the center of the head to the bottom of each frame image. Motion areas of the hands and head regions are measured by counting the number of motion pixels from the MHI image within an NxN size window at each center, as shown in Figure 14.The MHI-HOG and the Image-HOG of both hand regions are extracted in the following steps. Firstly, uniform grid interest points within both hands skin regions are selected, which are also within the patch at each hands center. Secondly, the Image-HOG and the MHI-HOG descriptors for each selected skin interest point are extracted and finally a bag of words representations of the Image-HOG feature and the MHI-HOG feature respectively for each frame is being formed.
To evaluate this method, the accuracy gained from the combination of face and body gestures with the accuracy gained from face only and gesture only methods have been
36
compared. The results shown in Figure 15 clearly show that Multi Modal methods of affect recognition have much better results than uni-modal methods.
Figure 12: Hand tracking by skin color-based tracker
Figure 13: Position of hands using skin color tracking & position of head using ASM model
Figure 14: Extract motion areas of hand and head regions
Figure 15: Comparison of affect recognition methods
Method
4.1 Training & Testing Process
Before recording
• Decide and set the emotion set (confirm as Concentrating, Defeated/Frustrated, Tri-umphant)
• Decide a game (or more) to use in recording of non-acted data
• Develop the software to capture synchronized motion data, face and body video, and game video
• Test recording functionality and synchronization
• Confirm students participation in playing the game. Students should not be in-formed about the project purpose during recording
38
During recording
• Set up the system on good lighting conditions and with sufficient space for game-play
• Provide students with a consent form and collect demographics info (Appendix E)
• Record more than 30 mins for each player both during gameplay and replay session
• Organise stored data in folders by student
After recording
• Develop a user interface for the observers (C# programming)
• Get observers determine motion clips with affective states both during gameplay and replay session.
• Get the observers to annotate postures with emotion labels. Method - online evalu-ation.
• Create a benchmark using observation agreement.
• Run cross-validation and compare results on all data types.
4.2 Participants
For the current experiment, seven different participants were instructed to play with Kinect sports game, while capturing their skeleton data and video. After the data collect, two observers were instructed to seperate the videos into image postures that according
to their oppinion expressed some kind of emotion. Four different observers were used, in order to evaluate and annotate the postures into 3 different emotion categories.
4.3 Training
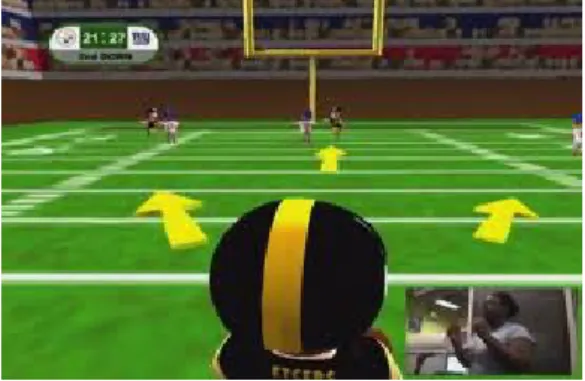
Participants were given instructions how to play the kinect sports game, and practiced a couple of times in order to familiarize themselves with it. They tried different sport games, like football, volleyball, running, javeling and bowling.
Figure 16: Training how to playing football in kinect
4.4 Data collection
The first step was to collect posture data. The Kinect SDK skeleton representation data was used to measure and store the posture of the players in each frame. Six male univer-sity students were recruited to take part in the data collection. The players were asked to play games with the Xbox integrated with a Kinect. A second Kinect was connected to a PC and was used separately to record the motion data for the players. The software used for the motion capture also had the capacity to capture and display both video and
40
skeleton data in real-time. The PC screen was captured to provide replay capacity for the extraction of the apex poses.
In contrast to [27], skeleton and emotion postures were recorded during both actual game play sessions and replay sessions, as it may not be sufficient for an emotion recog-nition system to be trained with different data than the one it is aimed to recognize. After the data was recorded, the observers replayed the captured video to determine and select possible affective postures for four emotional states: Triumph, Concentrating, Frustrated and Defeated[27].
The observers were given the option to identify emotional states based on both video and skeleton data, watching captured video. Both observers agreed that the actual video made it easier for them to decide on the emotional state in many instances that the skele-ton data was not sufficient enough. A total of 147 postures were extracted using this technique.
4.5 Emotion Annotation
For all the postures that were extracted, a screenshot of the corresponding frame of the software was taken for each posture. A digital questionnaire (Appendix F) was created and four observers were asked to annotate the screenshots (Figure 17) with an emotion label of one of the three above mentioned emotional states. After the questionnaire, all the observers expressed a concern on selecting a label between frustrated and defeated, as they all considered these emotional states very similar in many circumstances. For
this reason, the emotion label set was reduced to three (triumph, concentrating, frus-trated/defeated).
Figure 17: Screenshot example used by human observers
4.6 Cohen’s Kappa
Kappa[38] provides a measure of the degree to which two judges, A and B, concur in their respective sortings of N items into k mutually exclusive categories. A ’judge’ in this context can be an individual human being, a set of individuals who sort the N items collectively, or some non-human agency, such as a computer program or diagnostic test, that performs a sorting on the basis of specified criteria.
Comparison between the level of agreement between two sets of dichotomous scores or ratings (an alternative between two choices, e.g. accept or reject) assigned by two raters to certain qualitative variables can be easily accomplished with the help of simple percentages, i.e. taking the ratio of the number of ratings for which both the raters agree to the total number of ratings. But despite the simplicity involved in its calculation, per-centages can be misleading and does not reflect the true picture since it does not take into account the scores that the raters assign due to chance.
42
Using percentages result in two raters appearing to be highly reliable and completely in agreement, even if they have assigned their scores completely randomly and they ac-tually do not agree at all. Cohens Kappa overcomes this issue as it takes into account agreement occurring by chance.
How to compute Cohen’s Kappa
The formula for Cohens Kappa is:
k = P r(a)−P r(e) 1−P r(e)
where Pr(a) is the relative observed agreement among raters, and Pr(e) is the hypothet-ical probability of chance agreement, using the observed data to calculate the probabilities of each observer randomly saying each category. If the raters are in complete agreement then k = 1. If there is no agreement among the raters other than what would be expected by chance (as defined by Pr(e)), k=0
4.7 Benchmark creation
Table 1 presents observer agreement for all possible pairs among the four observers. As can be seen, agreement strength is above or equal to good at all cases, demonstrating that the labelling quality is satisfactory for the data extracted for the recognition system. Observer 2 clearly performs better on all paired cases with the other observers, achieving not only very good agreement with observers 1 and 4, but also the highest score with observer 3. The average Kappa value for observer 2 on all three pairs is 0.812.
Table 1: Paired observer agreement strength
Observer pair Kappa SE of Kappa 95% confidence interval agreement strength 1&2 0.806 0.043 0.721 - 0.890 Very Good
1&3 0.739 0.049 0.643 - 0.835 Good 1&4 0.749 0.047 0.656 - 0.842 Good 2&3 0.782 0.045 0.694 - 0.871 Good 2&4 0.849 0.038 0.775 - 0.923 Very Good 3&4 0.686 0.052 0.585 - 0.787 Good
Table 2 lists the actual number of agreements and percentage of agreement for all possible pairs that include observer 2. It also compares against chance level agreement. The score is significantly higher than the chance level agreement and above 86% on all pairs, making observer 2 a suitable candidate for the labeling of postures. Considering this and the Kappa value, the labeling from observer 2 was used for posture data annotation for the different emotion recognition tests.
Table 2: Agreement score for Observer 2 Observer IDs Number of
ob-server agreements Percentage of agreement Number of agreements expected by chance Percentage of expected agreement 1&2 129 87.76 54.41 37.04 2&3 127 86.39 55.10 37.50 1&2 129 87.76 54.41 37.04
Finally, the overall agreement of all observers was far above chance level at 72.3%, agreeing on 107 out of the 148 postures. This is used as the benchmark for evaluating the performance of the collected skeleton data postures as input for the emotion recognition system. Figure 18 presents the distribution of labels across the 147 postures according to observer 2.
44
Figure 18: Distribution of emotion labels for the 147 postures, according to observer 2 4.8 Recognition Testing
After the observer performance is completed, the skeleton data for each labelled pos-ture is extracted and annotated with the corresponding emotion label taken from the ob-server 2 annotation. The skeleton data comprises standard 3D rotational information for each of the joints of the body.
Automatic emotion recognition is tested based on the capacity to recognise new pos-tures. The labelled data used in WEKA [31] to build and test a model using back-propagation algorithm with 10 fold cross-validation, similar to [27].
4.8.1 Building and testing an emotion recognition model in WEKA
4.8.1.1 Supervised-Learning Algorithms
WEKA provides a set of machine learning and data mining algorithms that can be used to build and test recognition models. Examples of algorithms that can be used in the current experiment are the back-propagation algorithm and classification using decision trees. Back propagation [40] is a supervised learning algorithm. This means that a set
of examples of mappings from input to output must be provided as training data. The algorithm constructs an artificial neural network that can be used with unknown input data and make predictions, such as in our case providing emotion recognition. Decision trees are classification schemes created from training data (again mapping sets input-output) and comprise a tree and a set of rules. According to Hans & Kamber [39] a decision tree is a tree structure similar to a flowchart, in which an internal node denotes a test on one of the attributes, a branch represents the outcome to a test and leaf nodes represent classes or their distributions. This section describes how the back-propagation algorithm was used during the project to build and test an emotion recognition model.
4.8.1.2 Loading the data
WEKA allows researchers to input training data to the system using a standard file format that lists the parameters of the system and examples of mappings between input and output. WEKA can buse the explorer application from the GUI chooser to input, process and visualize data (Figure 19).
Figure 19: WEKA’s GUI chooser
Once the explorer is chosen and presented, initially only the preprocess tab is acti-vated, as there is no data yet to classify, visualize and so on. The next step is to click on the open file button (top-left) and select the file that includes the data to be used in the
46
experiment (Figure 20). This is done using a standard windows explorer for opening files in applications.
As soon as the data is loaded, the explorer prepares information about the set of the attributes used in the file. More specifically, it provides standard statistics such as mean value, min, max and standard deviation for each of the attributes, gives a visualisation option and lets the user filter out some of the data if desirable (Figure 21).
Figure 20: The explorer starting window
4.8.1.3 Selecting the learning algorithm
After this step, we are now ready to select an algorithm to build a learning model using the provided data. This is achieved by clicking on the classify tab, and then in the new tab, click on the choose button (top-left) and select the algorithm of your choice. In this specific example, we used the MultilayerPerceptron, which is WEKAs implementation of the back-propagation algorithm (Figure 22).
Figure 22: Selecting back-propagation for the model
4.8.1.4 Executing the test
As soon as the classifier has been selected, test options allow the researcher to select if he wishes to use separate test data, sample through all the data and separate it to test and training using cross-validation and other options. In Cross-validation the data is split into a number of subsets (folds) and the experiment is repeated a number of times equal to the number of sets. Each time a different subset is used as testing data, while the rest are used to train the model. At the end, the results are summarised. In the current experiment we performed cross validation using 10 folds. This means that the data was
48
split to 10 sets and the model was built and tested 10 times. As soon as the testing options have been decided, the button start needs to be pressed and the algorithm starts building the model. Once built finishes, the testing follows. Results are then summarised in the classifier output textbox of the WEKA explorer (Figure 23).
Figure 23: WEKA results
The results can be then processed and evaluated. In the above description we ex-plained how we executed the first experiment that used all the 147 sample postures and tested how it can generalise to new postures. The back-propagation algorithm split the 147 postures into 10 folds and used each one of them separately as testing data for one execution. In the second experiment in which we tested how to generalise to new players, the data was separated to two files. Each file contained postures of different players. The biggest file that contained 108 postures was used as the training set with a process similar to the one described above. The other file with 39 postures was used as a separate testing test to see if the model can generalise to new players. The difference using WEKA[31] is to simply select the test option supply testing set and browse to the file that is to be used as test data.
Experiment Implementation
All of the experiments took place in the same location: Multimedia Lab, department of Computer Science, in University of Cyprus , which is pictured below. Situated in this lab were the Kinect and camera sensors used to collect information related to emotions.
Figure 24: Experiment environment schematic
A schematic design of the experiment environment is showed in Figure 24 . Players are seeing a projector panel to play a kinect game called Kinect Sports, representing athletes. This is done using a normal Xbox Kinect that is connected with a projector in order to project the game view in the projector panel. In the same time a second kinect
50
is capturing players skeleton data, and motion RGB data storing them in a WEKA [31] format on the pc.
In the table below we describe the equipment used to finalize the experiment.
Table 3: Equipment needed for the experiment
Equipment Description
Motion Capture System Kinect Device Hi-Res Camera and Microphone External JVC camera
Xbox and Kinect sensor Xbox
Computer Game to be used Kinect Sports Subjects and actors to be used Students
C# custom software For capture kinect skeleton data
WEKA software For classification
5.1 Data Files
The data file created for WEKA, contain the following:
• Attributes for skeleton joints containing their type for e.g attribute rot-footr-x nu-meric, which means the x coordinate in 3D space of the right foot
• Attributes for the emotions to be annotated e.g. attribute emotion Concentrating, Defeated-Frustrated, Triumph
• The skeleton data line by line, each line representing a whole skeleton with its respective joints in one frame.
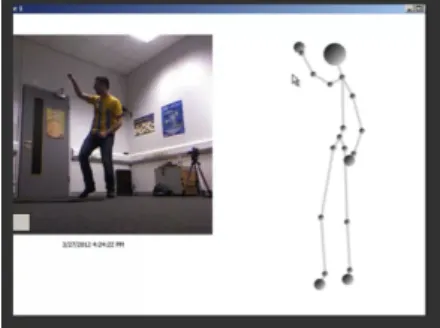
5.2 Software development for Data Collection
A custom software has been programmed in C# in order to capture the skeleton data and video data from the Kinect. Two seperate screens one displaying the skeleton of the moving player and the other displaying the real time video of the player. All the skeleton posture data for each frame is stored in real time in a local computer, using the formating that WEKA[31] needed.
![Figure 1: Paul MacLeans triune brain [35].](https://thumb-us.123doks.com/thumbv2/123dok_us/10988452.2986572/15.892.384.591.466.617/figure-paul-macleans-triune-brain.webp)