safety
ArticleA Novel Method for Safety Analysis of
Cyber-Physical Systems—Application to a Ship
Exhaust Gas Scrubber System
Victor Bolbot1,*, Gerasimos Theotokatos1 , Evangelos Boulougouris1, George Psarros2
and Rainer Hamann3
1 Maritime Safety Research Centre, Department of Naval Architecture, Ocean and Marine Engineering,
University of Strathclyde, Glasgow G4 0LZ, UK; gerasimos.theotokatos@strath.ac.uk (G.T.); evangelos.boulougouris@strath.ac.uk (E.B.)
2 DNV GL Group Technology & Research, Maritime Transport, DNV GL AS, 1363 Høvik, Norway;
George.Psarros@dnvgl.com
3 DNV GL Regulatory affairs, DNV GL SE, 20457 Hamburg, Germany; rainer.hamann@dnvgl.com
* Correspondence: victor.bolbot@strath.ac.uk
Received: 21 February 2020; Accepted: 12 May 2020; Published: 19 May 2020
Abstract: Cyber-Physical Systems (CPSs) represent a systems category developed and promoted in the maritime industry to automate functions and system operations. In this study, a novel Combinatorial Approach for Safety Analysis is presented, which addresses the traditional safety methods’ limitations by integrating System Theoretic Process Analysis (STPA), Events Sequence Identification (ETI) and Fault Tree Analysis (FTA). The developed method results in the development of a detailed Fault Tree that captures the effects of both the physical components/subsystems and the software functions’ failures. The quantitative step of the method employs the components’ failure rates to calculate the top event failure rate along with importance metrics for identifying the most critical components/functions. This method is implemented for an exhaust gas open loop scrubber system safety analysis to estimate its failure rate and identify critical failures considering the baseline system configuration as well as various alternatives with advanced functions for monitoring and diagnostics. The results demonstrate that configurations with SOx sensor continuous monitoring or scrubber unit failure diagnosis/prognosis lead to significantly lower failure rate. Based on the analysis results, the advantages/disadvantages of the novel method are also discussed. This study also provides insights for better safety analysis of the CPSs.
Keywords: cyber-physical systems; system-theoretic process analysis; events sequence identification; fault tree analysis; exhaust gas open loop scrubber system
1. Introduction
Cyber-Physical Systems (CPSs) represent a class of systems advancing in a number of application areas including the maritime industry [1]. The CPSs are expected to increase the productivity and safety levels by removing, substituting [2] and/or supporting the operator in the decision-making process, thus reducing the number of human errors leading to accidents [3]. Typical examples of the CPSs include the Industrial and automation Control Systems (ICS), robots, and Cyber-Physical Systems of Systems [4]. Examples of marine CPSs include the Power Management System, Propulsion engines, Heat Ventilation Air Conditioning systems and autonomous ships whose functions are supported by the CPSs [1].
Whilst CPSs are expected to bring significant benefits, they are considered to be complex, which implies that they may behave unpredictably [4–6]. Their complexity can be attributed to a number of Safety2020,6, 26; doi:10.3390/safety6020026 www.mdpi.com/journal/safety
Safety2020,6, 26 2 of 31
CPS properties [7], including their software-intensive character [8], ability to dynamically reconfigure and make decisions autonomously [4], interconnectivity [9], heterogeneity [10], interactions with humans [11] and associated management system [12,13]. In addition, the tight interactions between the CPS components, especially between the cyber and the physical parts allow for little slack in their performance [4,6]. These attributes of the CPSs render them prone to accidents or malfunction [4,6,7]. A potential accident might have significant safety and financial consequences, such as in cases of the Boeing 737-8 (MAX) accident [14] or the blackout on a Viking Sky cruise ship [15].
The potential hazards that can arise in a system are identified by employing a hazard identification and safety analysis methods and are controlled during the system design phase [4]. A number of traditional methods are employed for the CPS hazard identification and analysis, namely Preliminary Hazard Analysis (PHA), HAZard and OPerability (HAZOP), Failure Modes and Effects Analysis (FMEA) and Fault Tree Analysis (FTA) [4]. Model-based approaches can be also exploited, such as presented in [10]. In a number of studies [16–19], however, the use of PHA, HAZOP, FMEA and FTA for CPS safety analysis was criticised, as these methods cannot support the analyst in properly capturing the interactions between the system components, especially the interactions between the control components and the physical components, thus not identifying software-related hazardous scenarios. Similar criticism applies to the model-based study presented in [10] as the model is primarily based on the localized version of FMEA.
The System-Theoretic Process Analysis (STPA) has been proved capable of identifying the potential hazardous control actions by capturing the context of the system as well as identifying additional software related hazardous scenarios not captured by FMEA [17–19]. Although the STPA sufficiently addresses the software-intensive character of CPSs, it overlooks the events’ sequences [20]. The specific hazardous control actions are identified at different time snapshots of the system operation, but the STPA does not address how these hazardous control actions are propagated into an accident, incidents, or hazards [21]. Therefore, STPA alone cannot tackle properly CPS dynamic reconfigurations functions in safety analysis. This is of practical interest for the ICS, where the undesired event will happen due to a combination of failures occurring at different time periods and thus the system dynamic reconfiguration is highly important [4]. This method was proved weaker in supporting the single cause failures identification despite its capabilities and potential [18]. In addition, the STPA can be implemented only on a qualitative level, not allowing the criticality and sensitivity assessment, which are required for the system safety-efficient design [22]. Moreover, it is applied at a functional level, thus not considering the actual system design architecture [19]. The STPA is a manual method and, despite the specific rules that govern its implementation, it is still considered to be subjective [4]. Therefore, its enhancement, improvement or combination with other methods are required for addressing the above discussed limitations.
A number of previously published studies were dedicated to supplement the safety engineers implementing the STPA, either via the use of context tables [17], or finite state machines [21,23,24] or combining it with other modelling languages [25,26]. Wang et al. [27] and Liu et al. [28] focused on the STPA automation based on formal system models. In another group of studies, the STPA was combined with other hazard identification and analysis methods, such as FMEA and the Systematic Human Error Reduction and Prediction Analysis [29], FTA [30,31], Bayesian Belief Networks (BBN) [32], or with stochastic Petri Nets [20]. STPA has been also used to derive test requirements for CPSs [33]. A number of studies applied approximate ranking to scenarios derived using STPA [34–38].
Although the previous research studies proposed solutions to address some of the STPA implementation problems, a number of shortfalls still exists. Whilst the context tables [17] and the finite state machines [21,23] can provide a broader system context, in which the Unsafe Control Actions (UCAs) can be generated, the actual sequence of UCAs is ignored. In [26], although the actual system architecture was captured, all the other challenges (incorporation of the CPSs dynamic reconfiguration functions, quantitative safety analysis, manual character of STPA) were not addressed. The use of the Unified Modelling Language notations [25] considered the events sequence only for
Safety2020,6, 26 3 of 31
the STPA purposes. Wang et al. [27] identified the causal factors for each UCA were retrieved in an automated way, but the UCAs were identified manually. In [28], the sequences of UCAs leading to hazards were identified in an automated way, but quantitative safety analysis was not pursued. In [27,28], a sociotechnical system safety was investigated; however, further analysis of the physical failures and consideration of the actual system architecture was not considered. In [29], a deeper understanding of health care system hazards was obtained, but without implementing a quantitative risk analysis. In [30,31], the STPA was used to enhance a Fault Tree, which only implicitly considered the events sequence that would occur in the system, thus not addressing the system reconfiguration functions. The identification of a potential event sequences was not addressed in [32] and the analysis remained at a qualitative level. Whilst the temporal relations of the investigated system were incorporated in [20], no importance analysis was implemented due to computational limitations. The STPA results ranking was applied based on an approximate estimation of the considered safety metrics [34,36–38], whilst the study in [35] did not consider the system interactions in detail.
The preceding discussion reveals a number of research gaps in the literature, in specific: (a) the integration of the STPA with other methods to depict how the identified UCAs propagate into hazards using more structured formalism has not been pursued; (b) the adoption of the STPA for quantitative safety analysis purposes has not been fully addressed in the previous research studies; and (c) the lack of an automated STPA based on the investigated system model representation applicable to complex technical systems.
In this respect, the present study aims at developing a new, more effective and inclusive safety analysis method for the CPSs, with focus on ICS, which supports the implementation of quantitative safety analysis. The novel method is applied to an open loop exhaust gas scrubber system. The open loop exhaust gases’ scrubber systems use has become popular due to recent regulatory restrictions on SOx emissions from ships [39]. Exhaust gas open-loop scrubber system is not a safety critical system but still has an important industrial interest and as every system has inherent hazards. Open loop exhaust gas scrubber can be considered as a simple example of an ICS system, which is used for reducing the SOx emissions from ships engines. Its failure can lead to noncompliance with SOx emissions’ regulations which in turn may lead to SOx emissions deteriorating the air quality in the local area with negative effects on human health [40] and the environment as SOx emissions contribute to acid rains [41]. In addition, noncompliance with the SOx emissions regulations can result in significant financial sanctions against the ship owner/operator. The exhaust gas scrubbers’ safety issues analysis reported in [42,43], whereas, to the best of the authors’ knowledge, other studies are not available in the pertinent literature.
The original contribution of the present work includes: (a) a cross-fertilisation of the STPA, the Event Sequence Identification (ESI) method and the FTA to develop a “Combinatorial Approach for Safety Analysis” (CASA); (b) the quantitative estimation of the failure rate for noncompliance with SOx emission regulations for an open-loop exhaust gases scrubber system.
The remainder of this article is organised as follows. In Section2, the developed method and its rationale are presented. Section3includes the system and analysis input description. In Section4, the investigated system results are provided and relevant safety recommendations and method advantages/disadvantages are discussed. In the conclusions section, the main findings are summarised and some practical considerations for the method implementation are provided.
2. CASA Method Rationale and Description
As the literature review demonstrated, there is a need for a novel safety analysis method development to address the limitations of the existing approaches. In this study, the integration of three hazard identification methods (STPA, ETA and FTA) is proposed to support the CPSs safety analysis. The STPA method is appropriate for identifying new interactions between the CPSs control and physical parts, sufficiently capturing the CPSs software-effective character [17–19]. Furthermore, the STPA has
Safety2020,6, 26 4 of 31
the potential to identify the harmful effects of successful cyberattacks on CPSs [44]. However, the STPA needs enhancement with the inclusion of a quantitative step to support the decision-making process. On the other hand, FTA is effective for capturing the dependencies between components and analysing the physical failures [45]. Potentially, FTA could be substituted using other methods; however, FTA is rather simple to be applied. In addition, the ETA exhibits strength in identifying the event sequences of the investigated system and identifying multi-point failures [46]. This is important in CPSs, as CPSs have the ability to reconfigure responding to specific fault or control commands. Potentially, Event Sequence Diagrams as reported in [47] could be used, but the ETA based method was selected herein, due to its formalism simplicity.
Hence, integrating these three methods and a quantitative approach to form a novel method is expected to improve the analysis rigour, through increasing the number of identified complex scenarios, capturing the dependencies between different component failures, more effectively capturing the software related failures and identifying the temporal relationship between different events in the system. In addition, it allows for the quantification of appropriate safety and criticality/importance analysis metrics, thus facilitating the generation of safety recommendations and enhancement processes.
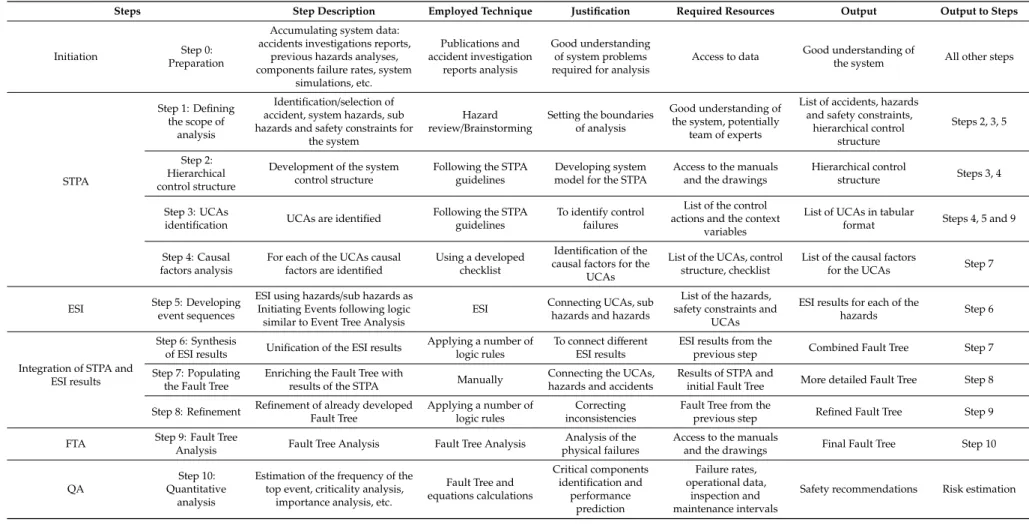
The preceding considerations led to the development of the proposed method, known as “Combinatorial Approach for Safety Analysis” (CASA), which consists of ten steps. Whilst some of the method steps were presented in [48], they are elaborated and enhanced further in this study by including the quantitative part description and delineating the method steps. The method phases and steps are provided in Figure1, whereas the steps’ characteristics are summarised in Table1.
Safety 2020, 7, x FOR PEER REVIEW 4 of 30
4
On the other hand, FTA is effective for capturing the dependencies between components and analysing the physical failures [45]. Potentially, FTA could be substituted using other methods; however, FTA is rather simple to be applied. In addition, the ETA exhibits strength in identifying the event sequences of the investigated system and identifying multi-point failures [46]. This is important in CPSs, as CPSs have the ability to reconfigure responding to specific fault or control commands. Potentially, Event Sequence Diagrams as reported in [47] could be used, but the ETA based method was selected herein, due to its formalism simplicity.
Hence, integrating these three methods and a quantitative approach to form a novel method is expected to improve the analysis rigour, through increasing the number of identified complex scenarios, capturing the dependencies between different component failures, more effectively capturing the software related failures and identifying the temporal relationship between different events in the system. In addition, it allows for the quantification of appropriate safety and criticality/importance analysis metrics, thus facilitating the generation of safety recommendations and enhancement processes.
The preceding considerations led to the development of the proposed method, known as “Combinatorial Approach for Safety Analysis” (CASA), which consists of ten steps. Whilst some of the method steps were presented in [48], they are elaborated and enhanced further in this study by including the quantitative part description and delineating the method steps. The method phases and steps are provided in Figure 1, whereas the steps’ characteristics are summarised in Table 1.
Figure 1. CASA method flowchart. Figure 1.CASA method flowchart.
Safety2020,6, 26 5 of 31
Table 1.CASA method steps overview.
Steps Step Description Employed Technique Justification Required Resources Output Output to Steps
Initiation Step 0: Preparation
Accumulating system data: accidents investigations reports,
previous hazards analyses, components failure rates, system
simulations, etc. Publications and accident investigation reports analysis Good understanding of system problems required for analysis
Access to data Good understanding of
the system All other steps
STPA
Step 1: Defining the scope of
analysis
Identification/selection of accident, system hazards, sub hazards and safety constraints for
the system
Hazard review/Brainstorming
Setting the boundaries of analysis
Good understanding of the system, potentially
team of experts
List of accidents, hazards and safety constraints,
hierarchical control structure Steps 2, 3, 5 Step 2: Hierarchical control structure
Development of the system control structure
Following the STPA guidelines
Developing system model for the STPA
Access to the manuals and the drawings
Hierarchical control
structure Steps 3, 4
Step 3: UCAs
identification UCAs are identified
Following the STPA guidelines
To identify control failures
List of the control actions and the context
variables
List of UCAs in tabular
format Steps 4, 5 and 9
Step 4: Causal factors analysis
For each of the UCAs causal factors are identified
Using a developed checklist
Identification of the causal factors for the
UCAs
List of the UCAs, control structure, checklist
List of the causal factors
for the UCAs Step 7
ESI Step 5: Developingevent sequences
ESI using hazards/sub hazards as Initiating Events following logic similar to Event Tree Analysis
ESI Connecting UCAs, subhazards and hazards
List of the hazards, safety constraints and
UCAs
ESI results for each of the
hazards Step 6
Integration of STPA and ESI results
Step 6: Synthesis
of ESI results Unification of the ESI results
Applying a number of logic rules
To connect different ESI results
ESI results from the
previous step Combined Fault Tree Step 7 Step 7: Populating
the Fault Tree
Enriching the Fault Tree with
results of the STPA Manually
Connecting the UCAs, hazards and accidents
Results of STPA and
initial Fault Tree More detailed Fault Tree Step 8
Step 8: Refinement Refinement of already developed Fault Tree
Applying a number of logic rules
Correcting inconsistencies
Fault Tree from the
previous step Refined Fault Tree Step 9
FTA Step 9: Fault TreeAnalysis Fault Tree Analysis Fault Tree Analysis physical failuresAnalysis of the Access to the manualsand the drawings Final Fault Tree Step 10
QA
Step 10: Quantitative
analysis
Estimation of the frequency of the top event, criticality analysis,
importance analysis, etc.
Fault Tree and equations calculations Critical components identification and performance prediction Failure rates, operational data, inspection and maintenance intervals
Safety2020,6, 26 6 of 31
The first four steps (steps 1–4) are similar to the steps of the STPA method. In step 5, the ESI method is employed to develop the “Event Trees” by analysing the system and using the STPA results, thus obtaining insight into the system temporal behaviour and potential complex failures. Step 6 employs the developed “Event Trees” and synthesizes/transforms them into one Fault Tree. In step 7, the generated Fault Tree is populated with the results from the STPA. In step 8, this Fault Tree is further refined to address inconsistencies due to the integration of STPA and ESI results. Step 9 expands on some physical failures identified by STPA (nodes of step 8 Fault Tree) by using the FTA to develop the final Fault Tree. Step 10 includes the quantitative analysis that is needed for calculating the top event failure rate for the investigated system, as well as the importance analysis that provides metrics for the critical system components and failures. The CASA results are used to derive the safety recommendations for the system safety enhancement. The method steps have to be applied in a specified sequence; otherwise, the results will differentiate from CASA results.
2.1. Preparatory Step (Step 0)
This step involves the activities required to gather the information about the system and system hazards. This includes, if available, the system simulations using detailed models depicting the system behaviour and responses, previous hazard identification analyses, the study of the system operation and maintenance manuals, development and analysis of system experts’ questionnaires and the analysis of previous accident investigation reports, as well as getting access to the failure rates databases for the system components.
2.2. STPA (Steps 1–4)
Step 1 (Figure1) aims at accurately defining the targets of the whole analysis. The process starts with the accidents’ identification for the investigated system. Based on the identified accidents, the relevant hazards are subsequently identified. Hazards in the STPA framework are understood as ‘the system states or the set of conditions that together with a worst-case set of environmental conditions will lead to an accident’ [49]. The hazard identification can be implemented either with the assistance of a hazard review by an individual or an expert teams’ brainstorming. According to the STPA framework, only the hazards related to the accident under consideration are taken into account, which can be further broken down in sub-hazards [49]. Based on these hazards and sub-hazards, the safety constraints and requirements of the system design are identified. The list of existing control measures is used to augment the ESI implementation as explained in the next step.
Step 2 (Figure1) focuses on the development of the investigated system hierarchical control structure, which is one of the differentiating points of the STPA analysis compared with the other methods [49]. As shown in Figure2, the process commences with a high-level system abstraction and proceeds to a more detailed level. The initial control structure consists of the high-level controller, the human operator and the controlled process with its basic control, feedback and communication links. A more detailed description incorporates the controllers’ hierarchies. The final refined control structure includes the information on responsibilities of each controller, the process model with the process variables and their ranges, the control actions, the actuators’ behaviour, the information provided by sensors and the interactions between the controllers. The development of a hierarchical control structure is influenced by the system identifying accidents and hazards. The analysis output from this step is expected to be in the form shown on the right-hand side of Figure2.
Safety2020,6, 26 7 of 31
2020, 7, x FOR PEER REVIEW 8 of 30
Figure 2. Flowchart demonstrating the steps for developing a control structure (Step 2).
The previous steps are the STPA initial steps. The actual hazard identification process starts in step 3 as shown in Figure 1, having as an objective to identify the Unsafe Control Actions (UCAs) that lead to hazards. The possible UCAs are categorised into the following four types [50]:
Type 1: Not providing the control action that leads to a hazard. Type 2: Providing a control action that leads to a hazard.
Type 3: A control action is untimely provided (too late, too early or out of sequence). Type 4: A control action duration is not adequate (stopped too soon or applied for too long).
In addition, there is also the following UCA type: “a safe control action is provided but not followed”; however, this is considered equivalent to the Type 1 UCAs [50]. This type of failure mode is analysed during the identification of causal factors in the next paragraph.
For each control action, the potential process variables values are considered, and it is investigated whether the control action will lead to a hazard/sub hazard or not. Similarly, with the system hazard identification, safety constraints can be derived from the UCAs, aiding the identification of appropriate hazard control measures.
Step 4 includes the causal factors’ identification and forms an essential step for the STPA (Figure 1) as the causal factors explain why an UCA can occur. In this study, the process was augmented by the usage of a modified tree structure proposed in Blandine [51], which was enhanced by a list of causal factors from [52], and it is shown in Figure 3. This allows for the easy transition from the STPA results into a Fault Tree structure, as in this way the causal factors can be connected to the UCAs by using the OR gate of a Fault Tree. The UCAs are considered undeveloped events, and their causal factors are connected to these UCAs using OR gates. Practically, this step is very similar to the checklist procedures. The list of typical generic causal factors is given in Appendix A. Such a provision of this checklist is beneficial, as it supports the repeatability and objectiveness of the STPA results. In this study, the term “scenario” is not used according to STPA framework; instead, scenario is considered in a much wider context, as, for example, a generic hazardous scenario.
Figure 2.Flowchart demonstrating the steps for developing a control structure (Step 2).
The previous steps are the STPA initial steps. The actual hazard identification process starts in step 3 as shown in Figure1, having as an objective to identify the Unsafe Control Actions (UCAs) that lead to hazards. The possible UCAs are categorised into the following four types [49]:
• Type 1: Not providing the control action that leads to a hazard. • Type 2: Providing a control action that leads to a hazard.
• Type 3: A control action is untimely provided (too late, too early or out of sequence). • Type 4: A control action duration is not adequate (stopped too soon or applied for too long).
In addition, there is also the following UCA type: “a safe control action is provided but not followed”; however, this is considered equivalent to the Type 1 UCAs [49]. This type of failure mode is analysed during the identification of causal factors in the next paragraph.
For each control action, the potential process variables values are considered, and it is investigated whether the control action will lead to a hazard/sub hazard or not. Similarly, with the system hazard identification, safety constraints can be derived from the UCAs, aiding the identification of appropriate hazard control measures.
Step 4 includes the causal factors’ identification and forms an essential step for the STPA (Figure1) as the causal factors explain why an UCA can occur. In this study, the process was augmented by the usage of a modified tree structure proposed in Blandine [50], which was enhanced by a list of causal factors from [51], and it is shown in Figure3. This allows for the easy transition from the STPA results into a Fault Tree structure, as in this way the causal factors can be connected to the UCAs by using the OR gate of a Fault Tree. The UCAs are considered undeveloped events, and their causal factors are connected to these UCAs using OR gates. Practically, this step is very similar to the checklist procedures. The list of typical generic causal factors is given in AppendixA. Such a provision of this checklist is beneficial, as it supports the repeatability and objectiveness of the STPA results. In this study, the term “scenario” is not used according to STPA framework; instead, scenario is considered in a much wider context, as, for example, a generic hazardous scenario.
Safety2020,6, 26 8 of 31
2020, 7, x FOR PEER REVIEW 9 of 30
Figure 3. Causal factors’ categories. 2.3. ESI (Step 5)
The Events Sequence Identification (ESI) commences after the STPA results have been derived (Figure 1Error! Reference source not found.). The methodology employed in the ESI is very similar o Event Tree Analysis (ETA) [46] and all the tools relevant to ETA are also used herein to ensure the identified scenarios completeness and to capture potential sequences of events in the investigated system. Each sub hazard/hazard is used as an initiating event and the propagation of sub hazards/hazards into a hazard or an accident is investigated by considering: (a) the protective barriers designed to mitigate the sub hazards/hazards consequences; (b) the relevant system states; and (c) the identified UCAs from the previous step. The ‘Event Trees’ are considered fully developed when all the outcomes end at either the safe condition, another sub hazard/hazard, or the investigated hazard/accident. It was assumed that the events’ duration has no effect on the identified event sequences, but it affects the probability of each selected branch and consequently the specific states’ calculation (described in Section 2.6).
Despite the similarities between the ESI and the ETA, the following differences exist (justifying the method name): (a) the ESI analysis is completely internal to the system compared to the ETA, which can be external to the investigated system; (b) the ESI does not incorporate the calculation of the protective barriers’ failure probability, and it is implemented only qualitatively; (c) the ESI outcome is not necessarily an accident but can be a hazard at the system level (the ESI corresponds to the left side of the classical Bow Tie, in comparison to the ETA that corresponds to the part on the right of the bow tie); (d) hence, no estimation of risk is provided by the ESI; (e) the ESI along with the STPA results are used to develop a Fault Tree as described in the next section. It must be noted that the introduction of the ESI term was followed for distinguishing between the two methods (ESI and ETA).
2.4. STPA and ESI Results’ Integration (Steps 6–8)
Since not all sub hazards/hazards lead directly to the system hazard/accident and some interactions exist between the various sub hazards/hazards, the developed “Event Trees” are restructured in step 6 of the proposed method (Figure 1), so that the investigated sub
Figure 3.Causal factors’ categories.
2.3. ESI (Step 5)
The Events Sequence Identification (ESI) commences after the STPA results have been derived (Figure1). The methodology employed in the ESI is very similar to Event Tree Analysis (ETA) [46] and all the tools relevant to ETA are also used herein to ensure the identified scenarios completeness and to capture potential sequences of events in the investigated system. Each sub hazard/hazard is used as an initiating event and the propagation of sub hazards/hazards into a hazard or an accident is investigated by considering: (a) the protective barriers designed to mitigate the sub hazards/hazards consequences; (b) the relevant system states; and (c) the identified UCAs from the previous step. The ‘Event Trees’ are considered fully developed when all the outcomes end at either the safe condition, another sub hazard/hazard, or the investigated hazard/accident. It was assumed that the events’ duration has no effect on the identified event sequences, but it affects the probability of each selected branch and consequently the specific states’ calculation (described in Section2.6).
Despite the similarities between the ESI and the ETA, the following differences exist (justifying the method name): (a) the ESI analysis is completely internal to the system compared to the ETA, which can be external to the investigated system; (b) the ESI does not incorporate the calculation of the protective barriers’ failure probability, and it is implemented only qualitatively; (c) the ESI outcome is not necessarily an accident but can be a hazard at the system level (the ESI corresponds to the left side of the classical Bow Tie, in comparison to the ETA that corresponds to the part on the right of the bow tie); (d) hence, no estimation of risk is provided by the ESI; (e) the ESI along with the STPA results are used to develop a Fault Tree as described in the next section. It must be noted that the introduction of the ESI term was followed for distinguishing between the two methods (ESI and ETA).
2.4. STPA and ESI Results’ Integration (Steps 6–8)
Since not all sub hazards/hazards lead directly to the system hazard/accident and some interactions exist between the various sub hazards/hazards, the developed “Event Trees” are restructured in step 6 of the proposed method (Figure1), so that the investigated sub hazards/hazards’ propagation is identified. Subsequently, the ESIs are transformed into a Fault Tree by connecting the events in a
Safety2020,6, 26 9 of 31
hazardous sequence using AND gates as shown in Figure4using exemplificatory “Event Trees”. The different scenarios resulting in the same hazard/accident are connected using the OR gates (Figure4). The paths from a sub hazard/hazard to another sub hazard/hazard are connected using OR gates (Figure4). As a result, a preliminary Fault Tree is developed, which is enriched and refined in the next steps of the proposed method. This is an important difference between the proposed approach for employing the ESIs’ “ETs” to develop an FT and the typical approach, according to which FTA is used to model the causes identified in ETA. In this way, accident becomes a top event in the Fault Tree, which is rather uncommon. However, accidents/hazards were used as the Fault Tree top events or nodes in BBN in the pertinent literature, as reported in [32,52]. ISO 31010 allows for using a broader outcome of a specific failure as the top event [46].
2020, 7, x FOR PEER REVIEW 10 of 30
hazards/hazards’ propagation is identified. Subsequently, the ESIs are transformed into a Fault Tree by connecting the events in a hazardous sequence using AND gates as shown in Figure 4 Error! eference source not found.using exemplificatory “Event Trees”. The different scenarios resulting in the same hazard/accident are connected using the OR gates (Figure 4). The paths from a sub hazard/hazard to another sub hazard/hazard are connected using OR gates (Figure 4). As a result, a preliminary Fault Tree is developed, which is enriched and refined in the next steps of the proposed method. This is an important difference between the proposed approach for employing the ESIs’ “ETs” to develop an FT and the typical approach, according to which FTA is used to model the causes identified in ETA. In this way, accident becomes a top event in the Fault Tree, which is rather uncommon. However, accidents/hazards were used as the Fault Tree top events or nodes in BBN in the pertinent literature, as reported in [32,53]. ISO 31010 allows for using a broader outcome of a specific failure as the top event [46].
Figure 4. “Event Trees” transformation into a Fault Tree.
In step 7 (Figure 1), the preliminary Fault Tree is enriched by using the derived STPA results. This is implemented in two stages. First, the UCAs are related to the branches in the ESI “Event Trees” (and, consequently, the events of the preliminary Fault Tree). These UCAs are connected to the event
Figure 4.“Event Trees” transformation into a Fault Tree.
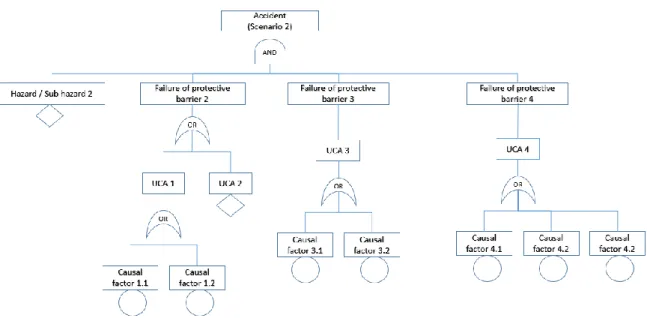
In step 7 (Figure1), the preliminary Fault Tree is enriched by using the derived STPA results. This is implemented in two stages. First, the UCAs are related to the branches in the ESI “Event Trees” (and, consequently, the events of the preliminary Fault Tree). These UCAs are connected to the event in a Fault Tree using an OR gate. Subsequently, for each UCA, the causal factors are developed under the UCAs with an OR gate. An example for the implementation of this step is shown in Figure5using exemplificatory UCAs for accident (scenario 2).
Safety2020,6, 26 10 of 31
2020, 7, x FOR PEER REVIEW 11 of 30
in a Fault Tree using an OR gate. Subsequently, for each UCA, the causal factors are developed under the UCAs with an OR gate. An example for the implementation of this step is shown in Figure 5 using exemplificatory UCAs for accident (scenario 2).
Figure 5. Populating the Fault Tree with UCAs and causal factors.
The Fault Tree developed in step 7 is not accomplished by populating the Fault Tree with the UCAs and the causal factors as inconsistencies may arise due to the fact that the results from the two different methods are merged into one structure. Therefore, the developed Fault Tree further refinement takes place in Step 8 (Figure 1). This step also takes into account the system architecture and the common causal factors. The conditions and applied actions for the FT refinement are described in Table 2. These conditions were identified from method application to other systems, as it is reported for example in [48]. An applied refinement example is provided in Figure 6, where UCA 1 is split into the UCA 1 representing its causal factors and the system state (in which UCA 1 occurs); UCA2 is split into UCA 2 representing its causal factors and the system fault (with which it occurs), whereas the common causal factor for UCA 3 and UCA 4 is ‘upgraded’ to a higher level in Fault Tree (the same level as other UCAs). The refinement is required to ensure that the OR and AND gates’ calculation involves non repeated and independent events. Special refinement is applied when a UCA is connected by using OR gates or AND gates. In the former case (UCA connected using OR gates), the common causal factor is propagated to the UCA level, whereas, in the latter case (UCA connected using AND gates), the common causal factor is propagated even to a higher level in the Fault Tree moving from the basic events to the top event. This special refinement for the integration of the methods is an important novel aspect of this method.
Figure 5.Populating the Fault Tree with UCAs and causal factors.
The Fault Tree developed in step 7 is not accomplished by populating the Fault Tree with the UCAs and the causal factors as inconsistencies may arise due to the fact that the results from the two different methods are merged into one structure. Therefore, the developed Fault Tree further refinement takes place in Step 8 (Figure1). This step also takes into account the system architecture and the common causal factors. The conditions and applied actions for the FT refinement are described in Table2. These conditions were identified from method application to other systems, as it is reported for example in [48]. An applied refinement example is provided in Figure6, where UCA 1 is split into the UCA 1 representing its causal factors and the system state (in which UCA 1 occurs); UCA2 is split into UCA 2 representing its causal factors and the system fault (with which it occurs), whereas the common causal factor for UCA 3 and UCA 4 is ‘upgraded’ to a higher level in Fault Tree (the same level as other UCAs). The refinement is required to ensure that the OR and AND gates’ calculation involves non repeated and independent events. Special refinement is applied when a UCA is connected by using OR gates or AND gates. In the former case (UCA connected using OR gates), the common causal factor is propagated to the UCA level, whereas, in the latter case (UCA connected using AND gates), the common causal factor is propagated even to a higher level in the Fault Tree moving from the basic events to the top event. This special refinement for the integration of the methods is an important novel aspect of this method.
Safety2020,6, 26 11 of 31
Table 2.Conditions for the FT refinement and refinement actions.
Rule Number Condition Refinement Action
1
An UCA is hazardous in a specific context and this is not captured by the ESI “Event Tree”
An UCA is split into control action and the context variable, representing context connected using AND gate
2 An UCA is a causal factor of another
UCA
Grouping is applied, the UCA is connected to the other one using OR gate
3
UCAs have identical causal factors and are located in the same position of the ESI “Event Tree”/Fault Tree
Merging of these UCAs is applied
4
A common causal factor for the UCAs at different points of “Event Tree”/Fault Tree
Causal factors are promoted to a higher level of the Fault Tree
5 A contradiction in a sequence of events
occurs Elimination of the contradictory events
6
An UCA is caused by a complex physical failure, which is refined by a Fault Tree
Subcases are defined for each physical failure
7 Common cause failures leading to
complex physical failure
Subcase is defined for the common cause failure in Fault Tree
2020, 7, x FOR PEER REVIEW 12 of 30
Figure 6. Refined Fault Tree example.
Table 2. Conditions for the FT refinement and refinement actions.
Rule
Number Condition Refinement Action
1
An UCA is hazardous in a specific context and this is not captured by the ESI “Event Tree”
An UCA is split into control action and the context variable, representing context connected using AND gate
2 An UCA is a causal factor of another UCA
Grouping is applied, the UCA is
connected to the other one using OR gate 3
UCAs have identical causal factors and are located in the same position of the ESI “Event Tree”/Fault Tree
Merging of these UCAs is applied
4
A common causal factor for the UCAs at different points of “Event Tree”/Fault Tree
Causal factors are promoted to a higher level of the Fault Tree
5 A contradiction in a sequence of events
occurs Elimination of the contradictory events
6
An UCA is caused by a complex physical failure, which is refined by a Fault Tree
Subcases are defined for each physical failure
7 Common cause failures leading to complex physical failure
Subcase is defined for the common cause failure in Fault Tree
2.5. FTA (Step 9)
According to the STPA results, some of the hazardous situations are related to a combination of a control action and a system state, which in turn is caused by a physical failure. For the cases where this system state is attributed to a number of a subsystem physical components failures, FTA is employed to identify these components’ failures (Figure 1). The top event in the FTA is taken as the system state from the relevant UCA (a high level physical failure) and the causes are identified by:
Figure 6.Refined Fault Tree example.
2.5. FTA (Step 9)
According to the STPA results, some of the hazardous situations are related to a combination of a control action and a system state, which in turn is caused by a physical failure. For the cases where this system state is attributed to a number of a subsystem physical components failures, FTA is employed to identify these components’ failures (Figure1). The top event in the FTA is taken as the system state from the relevant UCA (a high level physical failure) and the causes are identified by: (a) breaking down the subsystem into components; (b) assessing which component failure will lead to the
Safety2020,6, 26 12 of 31
top event of the local FTA, and; (c) considering the functional dependencies between the identified components. The identification of components failures leading to the top failure can be supported by considering the conditions under which the safety functions in specific components are activated. This step requires much more detailed information about the investigated subsystem and its components dependencies, as well as the subsystem components’ specific failures. The different components’ failures are connected using OR gates. If the same components are connected in parallel, their failures are connected to other failures using AND gates. If some of the components have identical standby components, then these components failures are connected using OR gates, but special treatment is provided for estimating its probability of failure as described in the next section. The developed Fault Tree in this step is connected to the previous steps Fault Tree (as shown in Figure6), resulting in a more detailed Fault Tree, linked to the investigated system components’ failures, which can be used for the purposes of the Quantitative Analysis (QA) described in the next section.
2.6. Quantitative Analysis (Step 10)
The purpose of the QA is to support the decision-making process and the safer systems design [22,53]. The approach followed in this study is probabilistic based and the QA output includes the calculation of top event failure rateλTE. TheλTE due to its linear connection to the frequency of events, which is used as a risk metric [54]. The top event failure rate is considered to be a more representative metric, as it corresponds to the investigated event and, therefore, historical data for its frequency can be retrieved through the number of the reported accidents. In this respect, ambiguous and computationally expensive calculations of the top event frequency (for example, by employing Markov chains) can be avoided. In addition, this step includes a importance analysis to identify the system critical failures.
The following assumptions were made for the QA purposes:
• The basic events in the Fault Tree can be grouped to three categories: (a) the operating system components failures (poci ); (b) the safety systems failures (pssi ) (it must be noted that the safety systems function is to control and handle the operating system components failures); and (c) specific system states, for example overloading of the generation sets (psssi ).
• The considered systems components’ failure rates follow an Exponential failure probability distribution.
• The inspection of the system components is performed according to the manufacturers’ guidelines and can effectively detect the system components’ condition including their failures and degradation level.
• The implemented maintenance practice for the systems components is according to the manufacture guidelines and restores the system components to the best possible condition (repairing their detected faults and mitigating their degradation). The maintenance intervals of the system components are considered to be timely as proposed by the respective manufacturers.
• The duration of testing and duration of repairs of faults detected during testing have negligible impact on the availability of the standby components or the components implementing safety functions.
• The top event probability differential can be adequately approximated by employing the respective difference considering a relatively small time interval, which was taken as 1 h.
The failure rate for the top eventλTEis estimated using the following approximation based on the failure rate definition [55]:
λTE= P[f ailure occurs between t and t+dt no prior f ailure] dt = dPTE dt ≈ ∆PTE ∆t , ∆t=1hour (1)
wherePTEdenotes the top event probability, which is derived from the Fault Tree (from Step 9) (an example is shown in Figure6) by applying the specific calculation rules for the Fault Tree gates.
Safety2020,6, 26 13 of 31
The following equation is employed to calculate the probability outcome of an OR gate with z input events (Ez) [56]: P= 1−PhE1∩ E2∩ E3∩ . . . ∩ Ezi =Pnk=1P(Ek)−Pk<lP(Ek∩ El) +. . .+ (−1)z −1 P(E1∩ E2∩ E3∩ . . .∩ Ez) (2) The following equation is employed to calculate the probability outcome of an AND gate with z input events (Ez) [56]:
P=P(E1)P(E2). . .P(Ez) (3)
The equations used for the calculation of the basic events probabilityPEj
(for the basic event Ejof the Fault Tree), which were derived considering the event type and the assumptions presented previously, are provided below. The required input parameters include the number of the redundant components, the components’ maintenance and testing intervals (Ti), the maintenance repair rates (µi), the components failure rates (λi), and the probability of failure on demand for the software components (PFDi).
For software, hardware, communication, and sensors’ failures (based on [55,56]):
pOCi,j =λit (4)
For tested cold standby equipment failure on demand (except for software failures) (based on [55,56]): pSSi,j =1+ e−λiTi− 1 λiTi (5) For safety system/functions with continuous monitoring failure on demand (based on [55,56]):
pSSi,j = λi
λi+µi
1−e−(λi+µi)Ti (6)
For software failures in safety functions (based on [55,56]):
pSSi,j =PFDi (7)
The Birnbaum’s importance measure (IBj) [56], which is approximated according to Equation (8), is employed for the basic events importance analysis. This metric can be used to identify the components with a significant impact on the top event failure rateλTE. In such cases, an improvement of the respective failure rates/probability can result in reducing theλTE. In addition, this metric can be used to identify components having a structural importance or occupying important locations of the Fault Tree for the investigated system [57]. It depends on the quality of the developed Fault Tree, which is used for the calculation of the top event failure rate:
IBj = ∂p TE(λ i) ∂pj ∂λTE(λ i) ∂pj ∂ t≈ ∆λ TE(λ i) ∆pj ∆ t≈ λ TE(λ i)−λTE(λi=0) pj ∆ t, ∆t=1hour (8)
The Fussell–Vesely importance measure (IFVj ), which is approximated according to Equation (9), is another metric that is employed in this study for facilitating the system importance analysis [56–58]. Based on this metric, the system components, the failure of which will most probably lead to the undesired event are identified [59]:
IFVj = ∂p TE(λ i) ∂pj pj pTEp j ∂λTE(λ i) ∂pj pj λTEp j ≈ ∆λTE(λ i) ∆pj pj λTEp j ≈ λTE pj −λTEpj=0 λTEp j (9)
Safety2020,6, 26 14 of 31
3. System Description and Analysis Input
For the application and demonstration of the proposed method, a rather simple industrial control system (ICS) has been selected, in particular, an open loop exhaust gas scrubber system. This can be considered as a simple example of CPSs, as it consists of a Programmable Logic Controller, the relevant actuators and physical components (pumps, scrubber unit, valves, etc.), and sensors for controlling the cleaning of exhaust gases.
The main purpose of the exhaust gas scrubber is to reduce the SOx emissions from the exhaust gas of the ship main engine and auxiliary engines when operating by burning High Sulphur Heavy Fuel Oil (HSHFO). The exhaust gases coming from the ship main and auxiliary engines are sprayed by injecting sea water within the scrubber. The sea water has a slightly higher pH (8) and, therefore, it will react with the SOx dissolved in the injected sea water. The main components of the open loop exhaust gas scrubber system are demonstrated in Figure7[60].
2020, 7, x FOR PEER REVIEW 15 of 30
For the application and demonstration of the proposed method, a rather simple industrial control system (ICS) has been selected, in particular, an open loop exhaust gas scrubber system. This can be considered as a simple example of CPSs, as it consists of a Programmable Logic Controller, the relevant actuators and physical components (pumps, scrubber unit, valves, etc.), and sensors for controlling the cleaning of exhaust gases.
The main purpose of the exhaust gas scrubber is to reduce the SOx emissions from the exhaust gas of the ship main engine and auxiliary engines when operating by burning High Sulphur Heavy Fuel Oil (HSHFO). The exhaust gases coming from the ship main and auxiliary engines are sprayed by injecting sea water within the scrubber. The sea water has a slightly higher pH (8) and, therefore, it will react with the SOx dissolved in the injected sea water. The main components of the open loop exhaust gas scrubber system are demonstrated in Figure 7 [61].
Figure 7. Investigated exhaust gas open loop scrubber system layout (based on [61]).
The main functions of the open loop exhaust gas scrubber system components are provided in Table 3. The exhaust gas scrubber control system can shut down the scrubber operations by closing the valves and switching off the sea water pumps. It also regulates the sea water flow rate and operating status of the sea water pumps based on the estimation of the fuel flow of the ship main and auxiliary engines. The process is supervised by the crew, which can implement switching over to a fuel with a low sulphur content if the exhaust gas SOx emissions exceed the acceptable limits. As an optional functionality, the exhaust gas scrubber control system could monitor the health status of the scrubber unit and predict its failures. In such a case, it is assumed that all the scrubber unit failures can be handled by the ship crew by switching over to a low Sulphur fuel. For the sake of the case study, it is considered that the scrubber unit failures as well as the SOx emissions sensor are not monitored by the alarm monitoring system, so the crew is not aware of the specific failures in order to switch off the scrubber system. It is also assumed that the crew can only mitigate the system hazards, but do not introduce the new hazards, so the crew cannot inadvertently switch off the exhaust gas scrubber system when the ship engines operate using HFO.
Figure 7.Investigated exhaust gas open loop scrubber system layout (based on [60]).
The main functions of the open loop exhaust gas scrubber system components are provided in Table3. The exhaust gas scrubber control system can shut down the scrubber operations by closing the valves and switching offthe sea water pumps. It also regulates the sea water flow rate and operating status of the sea water pumps based on the estimation of the fuel flow of the ship main and auxiliary engines. The process is supervised by the crew, which can implement switching over to a fuel with a low sulphur content if the exhaust gas SOx emissions exceed the acceptable limits. As an optional functionality, the exhaust gas scrubber control system could monitor the health status of the scrubber unit and predict its failures. In such a case, it is assumed that all the scrubber unit failures can be handled by the ship crew by switching over to a low Sulphur fuel. For the sake of the case study, it is considered that the scrubber unit failures as well as the SOx emissions sensor are not monitored by the alarm monitoring system, so the crew is not aware of the specific failures in order to switch off the scrubber system. It is also assumed that the crew can only mitigate the system hazards, but do not introduce the new hazards, so the crew cannot inadvertently switch offthe exhaust gas scrubber system when the ship engines operate using HFO.
Safety2020,6, 26 15 of 31
Table 3.Exhaust gas open loop scrubber system main components and their functions.
Component Function
Scrubber controller
Control of the sea water flow to the scrubber unit, monitoring of scrubber unit health status (provisional function)
Inlet sea chest valve Sea water flow control (can be either open or closed)
Outlet sea chest valve Sea water flow control (can be either open or closed)
Sea Water Pump Increasing/Decreasing sea water flow
Scrubber Unit
(Scrubber body, piping, droplet, venturi, injection nozzles)
Exhaust gases spraying Sensors (SOx emissions, pressure, pH, conductivity,
CO2emissions) Measuring operating parameters
The failure rates used as input for this analysis and their sources are provided in Table4. The inspection and testing of the SOx sensor and the standby pump are considered to be implemented every 5000 h, in line with the system maintenance manual [61].
Table 4.Data used as input.
Failure Rate Description PFD/Failure Rate
Commission errors for software functions [h−1] [62] 1.00×10⁻⁵
Omission errors for software functions (probability of failure on demand (PFD)) [62] 5.00×10⁻⁵
Proportional Integral Derivative (PID) controller failure to react/overreaction to
changes in system configuration due to software errors [h−1] [63] 1.00×10⁻⁶
Controller hardware failure rate [h−1] [62] 1.50×10⁻⁵
Communication lines failure rate [h−1] [64] 2.50×10⁻⁸
Fuel sensor failure rate (for engines and auxiliary generating sets) [h−1] [65] 2.00×10⁻⁶
Human error probability of failure on demand [66] 1.00×10⁻³
Pump failure rate [h−1] [65] 3.02×10⁻⁵
Injection nozzles failure rate [h−1] [42,43] 4.58×10⁻⁶
Venturi failure rate [h−1] [42,43] 1.53×10⁻⁶
Droplet separator failure rate [h−1] [42,43] 1.53×10⁻⁶
Body failure rate [h−1] [42,43] 1.53×10⁻⁶
Piping failure rate [h−1] [42,43] 7.88×10⁻⁶
Significant power increase in engine/auxiliary engines load [h−1]
Approximation of operating profile, based on cruise ship vessel [67] 1.00×10
−1
SOxsensor failure rate [h−1] [42] 1.38×10⁻⁵
Pressure sensors failure rate [65] [h−1] 2.00×10⁻⁶
Sensors maintenance rate—Assumption [h−1]—it considered that, under continuous monitoring of sensor failures, their correction is implemented almost immediately
1 Inconsistent diagnostic/prognostics model resulting in false negatives (test indicates
that no failure is observed in the system whilst it is present)—Assumption (PFD) Rather conservative
0.1
The analysis in this study investigated the exhaust gas open loop system shown in Figure7
Safety2020,6, 26 16 of 31
emissions sensor (without continuous monitoring); (b) continuous monitoring of the SOx emissions sensor (the SOx emissions sensor failure/erroneous measurements are immediately identified using advanced diagnostic techniques); (c) when scrubber unit failures (Scrubber body, piping, droplet, venturi, injection nozzles) are monitored using diagnostic/prognostic techniques and immediately diagnosed; and (d) with two installed SOx emissions’ sensors.
4. Results and Discussion
4.1. STPA Results (Steps 1–4)
A number of accidents and hazardous scenarios that can arise in the investigated exhaust gas scrubber system are provided in Table5(results of step 1) (derived based on previous studies [42,43] and own analysis). As it can be observed, despite the fact that the system is simple and non-safety-critical, a number of accidents and hazards can occur, which may result in human injury or death, as well as damage to equipment or environment. The analysis in the CASA method subsequent steps will focus on the environmental pollution [A-3] and specifically on [H-5] (Exhaust gas not complying with regulatory requirements.), as this study scope is to demonstrate the functionality of the CASA method. As elaborated in Sections1and3, the proper spraying of exhaust gas is an important scrubber function and its failure may result in environmental pollution and strict financial penalties. The hazard [H-5] is used for the development of the hierarchical control structure (step 2) and the identification of the UCAs (step 3).
Table 5.Accidents in the scrubber system.
Accident Exhaust Gas Open Loop
Scrubber Hazard Safety Constraints
[A-1] Human loss or injury
[H-1] Operating personnel touching hot surfaces [H-2] Exhaust gases leakage depriving the engine room from
oxygen
Protective surfaces, personnel training, oxygen level monitoring
in engine room
[A-2] Damage to ship/ship systems
[H-3] Overpressure in scrubber unit
[H-4] Water ingression through scrubber system
Diagnosis of system failures Use of non-return valves
[A-3] Environmental pollution
[H-5] Exhaust gas not complying with regulatory requirements.
[H-6] Disposed sea water not complying with regulations.
SOx sensor Sea water analysers
The system control structure (results of step 2) is provided in Figure8. It can be observed that the control loop incorporates two controllers, the scrubber control system and the human operator. The scrubber controller uses as input the ship engines fuel flow to control the pumps’ operating status, the sea water flow and the control valves’ status. The crew can implement the fuel change command and switch offthe scrubber, in cases where the measured SOx emissions exceed the regulatory threshold. In cases where a provisional functionality is available in the scrubber controller for monitoring the scrubber body failures based on pressure measurements, then the crew can immediately implement the fuel change to a low Sulphur fuel, when scrubber body failure occurs. Measuring the discharged sea water pH is also an important measure to ensure that the discharged sea water is in compliance with the environmental regulations. However, since this measure is not relevant to [H-5], it is not included in the hierarchical control system. The hierarchical control structure is used for the identification of the UCAs (step 3) and their causal factors (step 4).
Safety2020, 20207, x FOR PEER REVIEW ,6, 26 17 of 3118 of 30
Figure 8. Scrubber control structure.
The list of identified Unsafe Control Actions (UCAs) is provided in Table 6 (results of step 3). In total, 10 UCAs were identified for the system hazard [H-5]. The 10th identified UCA is applicable only if a new functionality performing the exhaust gas scrubber unit health diagnosis/prognosis is employed (case c as described in Section 3). The identified UCAs are found to be of Type 1 (not provided), Type 2 (provided), or Type 3 (provided too early/late/out of sequence). This is attributed to the fact that mostly discrete control actions, such as start, open, or close are considered. Thus, Type 4 UCA (stopped too soon/applied for too long) for many of the identified UCAs can be considered as equivalent to Type 1 UCAs; for example, a start pump stopped too soon would be equivalent to not providing a control action (not starting the pump) in its final effect, leading to the specific hazard. Type 4 UCA, instead, is more applicable if the control action exhibits some variation in its effect, as in the case of the PID controllers, where overshoots can occur. However, in this particular case, they are either covered by other UCA Type or do not lead to the investigated hazard. Based on the UCAs shown in Table 7, their causal factors are identified (step 4). The UCAs are also used to support the ’Event Trees’ development (step 5) as well as in step 7 to enrich the Fault Tree developed in step 6. The UCAs are also utilised to indicate which physical failures might need further elaboration in step 9.
Figure 8.Scrubber control structure.
The list of identified Unsafe Control Actions (UCAs) is provided in Table6(results of step 3). In total, 10 UCAs were identified for the system hazard [H-5]. The 10th identified UCA is applicable only if a new functionality performing the exhaust gas scrubber unit health diagnosis/prognosis is employed (case c as described in Section3). The identified UCAs are found to be of Type 1 (not provided), Type 2 (provided), or Type 3 (provided too early/late/out of sequence). This is attributed to the fact that mostly discrete control actions, such as start, open, or close are considered. Thus, Type 4 UCA (stopped too soon/applied for too long) for many of the identified UCAs can be considered as equivalent to Type 1 UCAs; for example, a start pump stopped too soon would be equivalent to not providing a control action (not starting the pump) in its final effect, leading to the specific hazard. Type 4 UCA, instead, is more applicable if the control action exhibits some variation in its effect, as in the case of the PID controllers, where overshoots can occur. However, in this particular case, they are either covered by other UCA Type or do not lead to the investigated hazard. Based on the UCAs shown in Table7, their causal factors are identified (step 4). The UCAs are also used to support the ’Event Trees’ development (step 5) as well as in step 7 to enrich the Fault Tree developed in step 6. The
Safety2020,6, 26 18 of 31
Table 6.Identified UCAs.
Control Action Type of UCA UCA No. Description
Close valves Providing 1
Closing valves during normal
operation/faulty conditions will restrict the scrubber functionality [H-5]
Start pump
Not providing 2
Not starting standby sea water pump when other pump is faulty/insufficient will inhibit the scrubber operation due to lack of sea water flow [H-5]
Providing with delay 3
Starting sea water pumps with delay will inhibit the scrubber operation due to the lack of sea water flow [H-5]
Stop pump Providing 4
Stopping pump during normal operation will cause unavailability of sea water in scrubber [H-5]
Increase sea water flow
Not providing 5
Not providing sea water flow increase when the auxiliary/engines output increase may lead to noncompliance with regulations [H-5]
Providing with delay 6
Providing sea water flow increase with delay when the auxiliary/engines output increase may lead to noncompliance with regulations [H-5]
Decrease sea water
flow Providing 7
Decreasing sea water flow when the auxiliary/engines output increase/stable may lead to noncompliance with regulations [H-5]
Issue alarm Not providing 8
Not issuing alarm, when the system SOx emissions are not in compliance will lead to noncompliance with regulations [H-5] Implement fuel
change over Not providing 9
Not changing fuel during faulty operation of the scrubber will lead to noncompliance with regulations [H-5] Diagnose and predict
scrubber failures Not providing 10
Not diagnosing and predicting failures in scrubber may lead to operation with faulty scrubber system [H-5]
The causal factors list for the identified UCAs is provided in Table7(step 4). In total, 26 causal factors are identified. For the majority of the UCAs, software failures are considered as causal factors. In this study, software failure refers to all those conditions, which may lead to the controller inability to implement a specific function due to errors in the software design, integer overflows, software bugs, communication errors in the controller, etc. They are treated as software failure because the available statistical data does not offer their further description. The human error depicts the failure of the human operator to act as a protective barrier. The human error was also treated on a high-level based on the relevant statistical data reported in IEC 61511 [66]. The identification of human failure causes is out of the scope of this research. The results of this step are used in step 7 to enrich the Fault Tree developed in step 6.
Safety2020,6, 26 19 of 31
Table 7.Causal factors.
UCA No. Causal Factors
1 Software failure, engine and auxiliary generator sets fuel sensors failure
2 Pump failure, controller hardware failure, communication failure, software failure,
controller hardware failure
3 Software failure (Wrong software implementation on controller)
4 Software failure, engine and auxiliary gets load/fuel sensors erroneous measurement
5 Software failure, controller hardware failure, communication failure, engine and auxiliary gets fuel sensors erroneous measurement
6 Software failure
7 Software failure, engine and auxiliary generator sets load sensors erroneous measurement
8 SOx sensor failure
9 Human error
10 Software failure, inconsistent physical model, pressure sensor errors
4.2. ESI Results (Step 5)
The “Event Tree” derived by applying the ESI for the hazard [H-5] is provided in Figure9, which also depicts the relations between the UCAs and the different events of “Event Tree”. As it is deduced from this figure, the UCAs support the development of the “Event Tree”. When the exhaust gas system operation does not comply with the emission regulations ([H-5]), the SOx emissions sensor provides an alarm. This can be used from the crew to switch the engine operation to the low sulphur fuel usage and simultaneously to switch offthe scrubber system. If crew fails to do that, the first hazardous scenario occurs. If the SOx sensor is faulty, then the crew will be unaware of potential noncompliance with the emissions’ regulations (scenario 2). The developed “Event Tree” will be converted to a Fault Tree in the next step (step 6).
2020, 7, x FOR PEER REVIEW 20 of 30
8 SOx sensor failure 9 Human error
10 Software failure, inconsistent physical model, pressure sensor errors 4.2. ESI Results (Step 5)
The “Event Tree” derived by applying the ESI for the hazard [H-5] is provided in Figure 9, which also depicts the relations between the UCAs and the different events of “Event Tree”. As it is deduced from this figure, the UCAs support the development of the “Event Tree”. When the exhaust gas system operation does not comply with the emission regulations ([H-5]), the SOx emissions sensor provides an alarm. This can be used from the crew to switch the engine operation to the low sulphur fuel usage and simultaneously to switch off the scrubber system. If crew fails to do that, the first hazardous scenario occurs. If the SOx sensor is faulty, then the crew will be unaware of potential noncompliance with the emissions’ regulations (scenario 2). The developed “Event Tree” will be converted to a Fault Tree in the next step (step 6).
Figure 9. ESI results.
4.3. STPA and ESI Results Integration (Steps 6–8), FTA Results (Step 9)
Since the investigated system is simple, there are no interactions between the different developed “Event Trees”. By transforming the “Event Tree” (Figure 9) (step 6) and enriching it with the results of STPA (step 7), the Fault Tree shown in Figure 10 is generated. As the causal factors are given in Table 7, these causal factors were not developed further in Figure 10. The developed Fault Tree includes the two scenarios leading to environmental pollution, inheriting the structure of the “Event Tree” from Figure 9. This Fault Tree is refined further in step 8.
Figure 9.ESI results.
4.3. STPA and ESI Results Integration (Steps 6–8), FTA Results (Step 9)
Since the investigated system is simple, there are no interactions between the different developed “Event Trees”. By transforming the “Event Tree” (Figure9) (step 6) and enriching it with the results of STPA (step 7), the Fault Tree shown in Figure10is generated. As the causal factors are given in Table7, these causal factors were not developed further in Figure10. The developed Fault Tree includes the


![Figure 7. Investigated exhaust gas open loop scrubber system layout (based on [61]).](https://thumb-us.123doks.com/thumbv2/123dok_us/10925436.2981478/14.892.164.734.402.796/figure-investigated-exhaust-open-loop-scrubber-layout-based.webp)


