Research Article Open Access
Glycemic Index values of some Jaffna fruits
Selladurai Pirasath,* Kulasingam Thayananthan, Sandrasekarampillai Balakumar, and Vasanthy Arasaratnam
Department of Biochemistry, Faculty of Medicine, University of Jaffna, Sri Lanka
*Corresponding Author: Selladurai Pirasath, Faculty of Medicine, University of Jaffna, Sri Lanka Ilavalai North, Ilavalai, Sri Lanka
Submission date: December 7, 2011, Acceptance date: February 29, 2012; Publication date: February 29, 2012
Abstract
Background: The incidence of diabetes mellitus has recently increased in developing countries. Scientific data on glycemic index values of common meals is essential to modify the diets for diabetes mellitus patients. This study aimed to evaluate the glycemic index (GI) values of fruits such as ‘Kathali’ (Yellow plantain), ‘Kappal’ (Golden plantain), and ‘Itharai’ (Green plantain) varieties of plantains, jack fruit and papaya. The results will be helpful to physicians and the general public to decide the benefits of the consumption of fruits, particularly by diabetic and coronary heart disease patients.
Methods: Healthy volunteers (20 Nos.) of 21.05(±0.92) years, 53.90 (±9.36) kg body weights, 153.92 (±9.15) m heights, and 20.55 (±2.22) kgm-2 body mass indexes were selected with their written consent. After overnight fasting, 75g glucose and each test fruit containing 75g digestible carbohydrate were administered at different instances and blood glucose levels were measured half hourly for two hours. The glycemic response and GI values were calculated and analyzed by Randomized Complete Block Design using SAS analytical package.
Results: The mean GI values of the ‘Kathali’, ‘Kappal’, ‘Itharai’ varieties of plantains, jack fruit and papaya were 54.45 (±9.26), 50.43 (±5.79), 48.47 (±10.13), 65.36 (±8.00) and 34.80 (±12.78) % respectively. The GI value of papaya differed significantly (P<0.05) from other fruits. The GI value of ‘Itharai’ variety of plantain differed significantly (P<0.05) from other fruits except the ‘Kappal’ variety of plantain.
Conclusion: The three varieties of plantains and papaya were low GI fruits, and jack fruit was found to be an intermediate GI fruit. The presence of dietary fiber, esp. soluble fiber, reduces the glycemic response and glycemic index of foods.
Keywords: Glycemic index, glycemic response, fiber, fruits.
INTRODUCTION:
Glycemic index is defined as the incremental area under the blood glucose response curve elicited over a two-hour period by a 75g carbohydrate portion of a food, expressed as a percentage of the response to the same amount of carbohydrate from a standard food taken by the same subject [1]. It measures the rate at which the carbohydrate in certain food is digested and absorbed into blood stream as glucose [2]. It ranks foods on a scale from 0-100, according to their actual effect on blood glucose level. Food with a GI value of 70 or more is considered to be high GI diet, with an index value between 55 to 69 as medium GI diet and less than 55 as low GI diet [3].
Lower GI foods decrease the metabolic risk [4], reduce the risk of diseases, curb overeating (since these foods are more satisfying and therefore reduce appetite), control blood sugar levels in diabetics, reduce blood insulin levels and by doing so also reduce the undesirable effects of insulin resistance (e.g. coronary heart disease, obesity and type 2 diabetes) (5).
They also have the following benefits:
Low GI diets help people to reduce and control body weight.
Low GI diets increase body sensitivity to insulin.
Low GI carbohydrates improve diabetic control and heart disease.
Low GI carbohydrates reduce blood glucose level.
Low GI carbohydrates reduce hunger and keep a person fuller longer.
Low GI carbohydrates prolong physical endurance.
The objective of this study was to determine the glycemic index values of different fruits to recommend to the diabetes, obese and coronary vascular disease patients. The evaluation of GI will help the local public to decide on the fruits which must be consumed. Hence, in this study the GI values of locally available fruits such as different varieties of plantains; (Musa spp) Tamil-‘Kathali’ (Yellow plantain), Tamil-‘Kappal’ (Golden plantain), Tamil-‘Itharai’ (Green plantain), jack fruit and papayas were determined.
Materials and Methods: Fruit
The pure glucose (Royal Pure Glucose, Smith Kline Beecham Pvt Ltd, Moratuwa), locally available fruits, such as different varieties of plantain (Musa spp) ‘Kathali’ (Yellow plantain), Tamil-‘Kappal’ (Golden plantain), and Tamil-‘Itharai’ (Green plantain), jack fruit and papaya were purchased from local market.
Analysis of chemical compositions of fruits
All fruits were analyzed for their total carbohydrate, digestible carbohydrate, reducing sugar, total protein, moisture, soluble dietary fiber, insoluble dietary fiber, and total dietary fiber contents using the methods described elsewhere [6,7].
Study sample
A group of 20 healthy volunteers (mean age=21.05(±0.92) years, mean weight=53.90 (±9.36) kg, mean height = 153.92 (±9.15) m and body mass index = 20.55 (±2.22) kgm-2) were selected with informed written consent. The volunteers who had abnormal glucose tolerance, underweight or overweight, dieting or restricting their carbohydrate intake, suffering from any illness or food allergy were excluded from the studies. Approval for study was obtained from the Ethical Review Committee, Faculty of Medicine, and University of Jaffna.
Estimation of blood glucose level of volunteers
The blood samples were collected and blood glucose levels were measured using Semi-Automated Biochemical Analyzer (TC 3300).
Calculation of glycemic response and glycemic index values
Glycemic index and glycemic response were calculated according to the FAO/WHO procedure [3, 8]. Statistical analysis
Glycemic response and glycemic index values of different types of fruits were analyzed by Randomized Complete Block Design (RCBD) using SAS analytical package.
Results:
When 75g of glucose was orally administered to the volunteers, blood glucose level reached the peak value at 30min. The mean fasting and 30 min blood glucose levels were 86.25 (±3.63) and 153.75 (±13.67) mgdL-1 respectively. The mean peak glycemic response for pure glucose was 67.35 (±12.97) mgdL-1.
The proximate compositions of different fruits are given in Table 1. After overnight fasting (12 h), 75g digestible carbohydrate containing tests fruits were administered to the volunteers on separate days. Peak glycemic response to all the fruits was obtained at 30min. The mean glycemic response values for ‘Kathali’, ‘Kappal’ and ‘Itharai’ varieties of plantains, jack fruit and papaya were 34.11 (±5.80), 31.58 (±3.63), 30.35 (±6.34), 39.50 (±8.02) and 26.50 (±6.92) mgdL-1 respectively (Table 2). The mean GI values of ‘Kathali’, ‘Kappal’ and ‘Itharai’ varieties of plantains, jack fruit and papaya were 54.45 (±9.26), 50.43 (±5.79), 48.47 (±10.13), 65.36 (±8.00) and 34.80 (±12.78) % respectively (Table 3). The glycemic response obtained after the administration of 75.0g glucose was significantly (p<0.05) higher than that obtained after the administration of 75.0g digestible carbohydrate containing ‘Kathali’, ‘Kappal’ and’ Itharai’ varieties of plantain. The glycemic response and index values obtained for the ‘Kathali’ and ‘Kappal’ varieties of plantains, did not differ significantly (p>0.05), while those obtained for ‘Kathali’ and ‘Itharai’ varieties of plantains were considerably different (p<0.05). The glycemic response and glycemic index value of ‘papaya’ and jack fruit also differed significantly (p<0.05) from the ‘Kathali’, ‘Kappal’, and ‘Itharai’ varieties of plantains and jack fruit (Table 4).
Table 1: Proximate compositions of different fruits.
Constituents (%)
Kathali
Plantains
Kappal Itharai Jack fruit Papaya
Table 2: Glycemic response (mg/dL) to different obtained at 30 and 60 min.
Fruits Glycemic Response 30 min 60 min Kathali 34.11(±5.80) 21.67(±0.58) Plantains Kappal 31.58(±3.63) 23.00(±1.00) Itharai 30.35(±6.34) 22.67(±1.53) Jack fruit 39.50(±8.02) 27.66(±7.51) Papaya 26.50(±6.92) 11.33(±1.65) Moisture Fat Soluble protein 64.46(±1.08) 0.18(±0.01) 0.03(±0) 65.39(±0.32) 0.31(±0.44) 0.01((±0) 63.73(±1.41) 0.22(±0.02) 0.01((±0) 78.40 (±0.08) 0.42((±0.08) 0.03((±0) 86.50 (±0.42) 0.12((±0.11) 0.01((±0) Total protein 1.07 (±0.03) 1.01(±0.01) 0.97(±0.02) 1.49 (±0.1) 1.75 (±0.08)
Soluble dietary fiber 0.32(±0.04) 0.49 (±0.01) 0.67(±0.04) 1.47 (±0.01) 1.90 (±0.03)
Insoluble dietary fiber(IDF) 2.43 (±0.05) 2.21 (±0.05)
2.98 (±0.03) 3.34 (±0.04) 1.71 (±0.02)
Total dietary fiber(TDF) 2.75 (±0.08) 2.70 (±0.07) 3.65 (±0.05) 4.81 (±0.05) 3.62 (±0.03)
Total digestible carbohydrate Reducing Sugar 23.01(±0.34) 2.02(±0.07) 23.86(±0.35) 1.41(±0.06) 27.06 (±1.42) 1.56(±0.13) 12.96 (±0.07) 3.01(±0.34) 8.30 (±0.20) 1.01(±0.74)
Table 3: Exact amount of different fruits consumed and their glycemic index values of fruits.
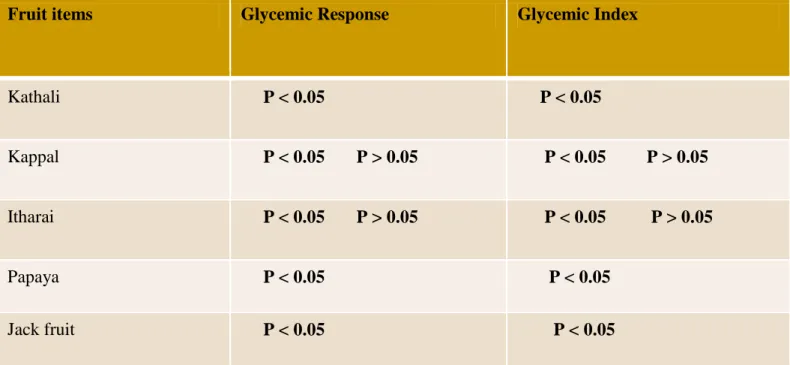
Table 4: Comparison of Glycemic response and Glycemic index values of fruit items using P values
Fruit items Glycemic Response Glycemic Index
Kathali P < 0.05 P < 0.05 Kappal P < 0.05 P > 0.05 P < 0.05 P > 0.05 Itharai P < 0.05 P > 0.05 P < 0.05 P > 0.05 Papaya P < 0.05 P < 0.05 Jack fruit P < 0.05 P < 0.05 Fruits (Amount consumed in g) Total digestible Carbohydrate (g) Total dietary Fiber (g) Soluble dietary Fiber (g) Insoluble dietary Fiber (g) Protein (g) Total reducing sugar (g) Glycemic Index (%) Kathali (325.95) 75.00 8.96 1.04 7.92 5.54 6.84 54.45 (±9.26) Kappal (314.33 75.00 8.49 1.54 7.92 3.17 4.45 50.43 (±5.79) Itharai (277.16) 75.00 10.12 1.86 8.26 2.69 4.32 48.47(±10.13) Jack fruit (578.70) 75.00 27.84 8.51 19.33 8.62 17.41 65.36 (±8.00) Papaya (903.60) 75.00 32.71 17.17 15.45 15.8 19.12 34.80 (±12.78)
Discussion:
Considering the glycemic response among the three varieties of plantains, ‘Itharai’ variety gave less response followed with ‘Kappal’ and ‘Kathali’ varieties. When the composition of the different varieties of plantains were considered, the reducing sugar contents of the ‘Kathali’, ‘Kappal’, and ‘Itharai’ varieties of plantains were 2.02 (±0.07), 1.41 (±0.06) and 1.56 (±0.13) % respectively (Table 1). The total amounts of reducing sugar of the consumed portion of the three different varieties of plantains are shown in Table 3. The amount of reducing sugar consumed did not show significant difference with glycemic response.
When the fiber contents of the three varieties of plantains were considered, the ‘Itharai’ variety contained more soluble dietary fiber (0.67%), insoluble dietary fiber (2.98%) and total dietary fiber (3.65%), than the ‘Kathali’ (0.32, 2.43 and 2.75%) and ‘Kappal’ (0.49,2.21 and 2.07%) varieties of plantains (Table 1). As the digestible carbohydrate consumed was equal, the amount of total dietary fiber (TDF) consumed from ‘Itharai’ variety of plantain was highest. Due to its high fiber content of ‘Itharai’ variety of plantain, the monosaccharide released by the digestion might not have been immediately available for absorption. This is due to the tendency of the fibers to adsorb and release the sugars slowly. Earlier studies have shown that soluble fibers slow down the digestion of starches and absorption of glucose in to the bloodstream [9].
Glycemic index value of ‘Kathali’ variety of plantain was closer to that reported by Williams and Stubbs [10], while other varieties of banana from South Africa and Italy showed their glycemic index values higher than that of ‘Kathali’ variety [11].The mean glycemic index value of ‘Kappal’ (50.43 (±5.79)) variety was closer to that of a variety of banana from USA [11] , while another variety of banana from USA showed its glycemic index value closer to that of ‘Itharai’ variety [11].
Glycemic index value of ‘Kappal’ variety of plantain was closer to that reported by Hettiaratchi et al study in 2008 [12]. However the glycemic index value of ‘Kathali’ variety of plantain was not. This may be due to the effects of the ripeness of fruit and cultivation of the fruit palm on the glucose response [13]. The composition of the food or the meal will influence the blood glucose response. Further foods within the same classification can have different glycemic indices. For example, the different varieties of potatoes, cereals showed variations in glycemic indices [14, 15].
The soluble protein contents of ‘Kathali’, ‘Kappal’, and ‘Itharai’ varieties of plantains were 0.03, 0.01, and 0.01% respectively (Table 1). The total protein content of ‘Kathali’, ‘Kappal’, and ‘Itharai’ varieties of plantain were 1.07(±0.03), 1.01(±0.01) and 0.97(±0.02) % respectively (Table 1). The fat contents of ‘Kathali’ ‘Kappal’ and ‘Itharai’ varieties of plantain were 0.18(±0.01), 0.31(±0.44) and 0.22(±0.02) % respectively (Table 1). Thus, the protein and fat contents of the three varieties of plantain did not show any direct relationship with glycemic response.
The proximate compositions of Jack fruit and Papaya are shown in Table 1. Papaya contained more soluble dietary fiber, but contained less insoluble dietary fiber and total dietary fiber than the Jack fruit (Table 1). These differences could have led ‘Papaya’ to give less glycemic response than ‘Jack fruit’. The glycemic index of ‘Papaya’ (34.8 (±12. 8) %) was lower than that of ‘Jack fruit’ (65.4 (±8.00)). This could again be explained based on the characteristic of the fibers to absorb [16] and release the sugars slowly [17]. Further soluble fibers slow down the digestion of starches and absorption of the glucose in to the bloodstream [15]. An increase in the total fiber content of food can delay the glycemic response [18]. Fiber delays the digestion of starch in the stomach, transition time of the stomach contents to the duodenum, delay the diffusion of different saccharides in the duodenum, delay the hydrolysis of polysaccharides in the duodenum and delay the absorption of monosaccharides through the microvilli of the epithelial cells of the jejunum and the upper part of the ileum [19]. Total dietary fiber content has a significant negative correlation with GI [13].
Although the TDF contents of papaya and Jack fruit were closer, total amount of soluble fibers consumed from papaya was more. The mean glycemic response to Papaya and Jack fruit were 26.5 (±6.92), and 39.5 (±8.02) mgdL-1 respectively. These results indicated the direct relationship between the soluble fiber and the glycemic response. The total protein contents of Papaya and Jack fruit was 1.75 and 1.49 % respectively (Table 1), and the total protein consumed from papaya was more than that from jack fruit. Thus the influence of protein contents on the glycemic response after the consumption of these two varieties of fruits showed an inverse relationship (Table 3).
Conclusion:
The GI value of the three varieties of plantains and papaya were less than 55%. However, Jack fruit gave higher GI value when compared with other fruits. Therefore all the three varieties of plantains and papaya are lower glycemic index fruits, and jack fruit is an intermediate GI fruit.
The results showed that the ‘Itharai’ variety of plantain, and ‘Papaya’ are better choices for the diabetes and coronary heart disease patients, while ‘Kathali’ and ‘Jack fruit’ are better choices for those who need a high glycemic index diet. However, recommendation of the foods should be made after analyzing the glycemic index, glycemic load and energy contents of the fruits [20].
Abbreviations:
Glycemic index (GI), soluble dietary fiber (SDF), insoluble dietary fiber (IDF), total dietary fiber (TDF). Competing interests
The authors declare that they have no competing interests. Authors' Contributions
Selladurai Pirasath, MBBS (SL) is the principal investigator for this study and provided oversight, contributed fundamental conceptualization for the research, provided statistical analysis, performed the lab work and wrote the grant proposal and manuscript. Kulasingam Thayananthan assisted in performing
the lab work for the study. Sandrasekarampillai Balakumar, BSc, MSc, PhD is the senior lecturer and supervised the research work, contributed to the conceptualization of the research protocol, assisted in statistical analysis and assisted in writing the manuscript. Vasanthy Arasaratnam, BSc, MSc, PhD, Senior Professor, and Vice-Chancellor supervised the research work, contributed to the conceptualization of the research protocol, assisted in statistical analysis, and assisted in writing the manuscript.
Acknowledgements:
Financial assistances by IRQUE Medical Study Program, Research fund of Faculty of Medicine, University of Jaffna.
REFERENCES:
1. Wolver TMS. Dietary Recommendations for Diabetes: High Carbohydrate or High
Monounsaturated Fat? Nutrition Today 1999; 34: 73-77.
2. FAO/WHO Carbohydrates in Human Nutrition: report of a joint FAO/ WHO expert consultation; 1998.
3. Mendosa D. Glycemic Index, 2007. (http://www.mendosa.com/gi:htm. Accessed 21st October 2010.)
4. Vrolix R, Van Meijl LEC, Mensink RP. The Metabolic Syndrome in Relation with the Glycemic Index and the Glycemic Load. Physiology and Behaviour 2008; 90:293 –9.
5. Wolver TMS, Vuksan V, Jenkins AL, Wong GS, Josse RG. Beneficial Effect of Low Glycemic Index Diets in Overweight NIDDM subjects. Diabetes care 1992; 15:562-4
6. Pearson D; editor. The Chemical Analysis of Foods. 7th ed. Edinburgh, London, Churchill. Livingstone, 1976.
7. Megazyme, Total Dietary Fiber Assay Procedure, 2007.
(http://www.megazyme.com/booklets/KTDFR.pdf Accessed at 17th June2009)
8. Wolever TMS, Jenkins DJA, Jenkins AL, Josse RG. The Glycemic Index: Methodology and Clinical Implications. American Journal of Clinical Nutrition 1991; 54:846- 54
1. Heacock PM, Hertzler PR, Williams JA, Wolf BW. Effects of a medical fruit containing an herbal alpha-glucosidase inhibitor on postprandial glycemia and insulinemia in healthy adults. Journal of American Diabetic Association 2005; 105(1):65-71.
2. Williams S, Stubbs P. The Glycemic Index, 2007. (Available at:
http://extension.usu.edu/files/publications/factsheet/FN2004-01.pdf. Accessed at 1st April 2004.) 3. Foster-Powell K, Holt SHA, Brand miller JC. International table of glycemic index and glycemic
load values. American Journal of Clinical Nutrition 2002; 76:5-56.
4. Hettiaratchi UPK, Ekanayake S, Welihinda J. Glycemic Indices of Sri Lankan foods Department of Biochemistry, Faculty of Medical Science, University of Sri Jayewardenepura, Sri Lanka 2009.
(http://www.nrc.gov.lk/. Accessed on 29th December 2009).
5. Hettiarachi UPK, Ekanyake S, Welihinda, J. Do Sri Lankan meals help decrease blood glucose response? Ceylon Medical Journal 2009; 54(2):39-43.
6. Thathvasuthan A, Chandrasekara DG, Wijesinghe NG, Jayawardena HMDK. The effect of types of cereal on the glycemic response of two traditional Sri Lankan food items. Tropical Agriculture Research 2007; 19: 101-9.
7. Fernandes G, Velangi A, Wolewer TMS. Glycemic index of potatoes commonly consumed in North America. Journal of the American Diabetic Association 2005; 105: 557-62.
8. Jenkins DJA, Wolever TMS, Taylor RH. Slow release dietary carbohydrate improves second meal tolerance. American Journal of Clinical Nutrition 1982; 35:1339–46.
9. Brand-Miller CJ, Liu V, Petocz P, Baxter CR. The glycemic index of fruits influences postprandial insulin-like growth factor–binding protein responses in lean young subjects. American Journal of Clinical Nutrition 2005; 82:350-4.
10. Marangoni F, Poli A. The glycemic index of bread and biscuits is markedly reduced by the addition of a proprietary fiber mixture to the ingredients. Nutrition, Metabolism and Cardiovascular Diseases 2008; 18: 602-5.
11. Nishimune T, Yalcushiji T, Summoto T, et al. Glycemic response and fiber content of some foods. American Journal of Clinical Nutrition 1991; 54: 414-9.
12. Pirasath S, Thayananthan K, Balakumar S, Arasaratnam V. Effect of dietary fiber on glycemic index. Ceylon Medical Journal 2010; 55(4):118-122.