Assessment and Behaviour of Prestressed Concrete Bridge Beams in
Shear with Less than Minimum Shear Reinforcement
Matthew Hourigan
1, Dr Rob Heywood
2, Dr Peter Shaw
3and Dr Liza O'Moore
41 Queensland Department of Transport and Main Roads 2 Heywood Engineering Solutions
3 AECOM
4 School of Civil Engineering, University of Queensland Abstract
The Queensland Department of Transport and Main Roads manages over 3300 bridges, and many bridges have less shear reinforcement than required by modern design codes. Concerns about accurately predicting the shear capacities and the ductility of bridge beams have become increasingly important in maintaining network operation and transport productivity given the large increases in the loads since the bridges were constructed.
An experimental investigation was conducted to study the shear performance and cracking behaviour of three full-scale, prestressed concrete beams, similar to those manufactured for Queensland bridges. The shear reinforcement provided was less than the minimum requirements defined by modern design codes. The beams were tested under a simply supported three-point loading regime, until failure. The experimental ultimate shear strengths were compared with the shear provisions of a number of international codified prediction models, including; current and previous versions of Australian Standard (AS5100), Canadian Highway Bridge Design Code (S6), and the fib Model Code 2010 (MC2010).
The experimental results showed that the ultimate shear strength was generally greater than the codified model. However, of particular concern was the sudden nature of the ultimate failure.
This paper provides insights into the methodologies used to assess prestressed concrete bridge beams with less than minimum shear reinforcement and will inform the inspection and management of bridges with these beams.
1
Introduction
The Queensland Department of Transport and Main Roads (TMR) manages over 3300 bridges, and many of these bridges have shear reinforcement levels considerably less than the requirements of modern design codes. As a result, the theoretical assessed structural capacities for these Prestressed Concrete (PSC) beam bridges (when assessed to AS5100.7 and TMR’s Tier 1 Bridges Heavy Load Assessment Criteria) are particularly low despite observed satisfactory in-service performance (Moua & al. 2017). This illustrates the increased importance of being able to accurately and safely predict the shear capacities and ductility of bridge beams, in maintaining network operation and transport productivity given the large increases in the loads since the bridges were constructed.
This paper presents the experimental investigation that was conducted to study the shear performance and cracking behaviour of three full-scale, prestressed concrete (PSC) beams, similar to those manufactured for Queensland deck unit bridges. This study continues the previous work of Moua & al. (2017), Heywood & al. (2017), and Shaw & al. (2017), investigating the assessment of bridges containing less than minimum shear reinforcement.
2
Research Significance
Shear failures of PSC beam structures are potentially brittle and could occur without warning due to the low level of shear reinforcement which is often associated with these types of beams. As a result, codes and standards have included provisions to ensure ductile post cracking behaviour by including a minimum requirement for the level of steel shear reinforcement. Many of the existing bridges on the Queensland network, designed to previous standards (NAASRA 65 & 76), were considered to act and
behave like slabs as each of the PSC beams were transversely post-tensioned together (refer Fig. 1). As a result, these beams did not require shear reinforcement according to the code, and hence, these bridge components contain levels of shear reinforcement (where provided) which are less than the minimum requirements defined by modern design codes.
The Canadian Highway Bridge Design Code (S6) provides specific provisions for the assessment of concrete elements with shear reinforcement less than the codified minimum requirements (Asv < Asv.min), and increased margins for components that are less ductile are not able to be inspected. The internal side faces of these bridge beams cannot be visually inspected, and as a result any shear cracking is not visible except in the outside faces of external beams. The experimental programme of this study was developed in response to concerns about the performance of some of these bridge beams subjected to loads approaching failure loading in order to inform the management, including inspections, of these bridges.
Fig. 1 Typical cross section of a Queensland transversely stressed PSC beam bridge
3
Experimental Programme
3.1 Experimental Setup
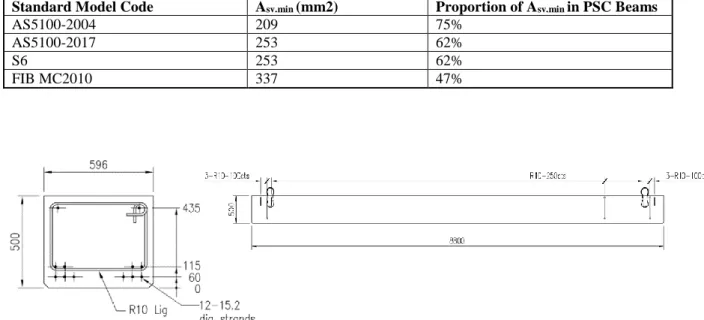
Three full-scale precast, prestressed concrete (PSC) beams, similar to those used for Queensland bridges, were manufactured for this study. The PSC beams were cast at a local precast facility, and transported to the University of Queensland Structures Laboratory for testing. The PSC beams were 8800mm in length and were pretensioned. The cross-section profile (596mm wide x 500mm deep) and prestressed strand pattern were based on the TMR standard deck unit (Fig. 3). These characteristics are adopted to ensure that the results and conclusions from the investigation could be relevent to similar structures in the field with bridge beams containing less than the codified minimum shear reinforcement.
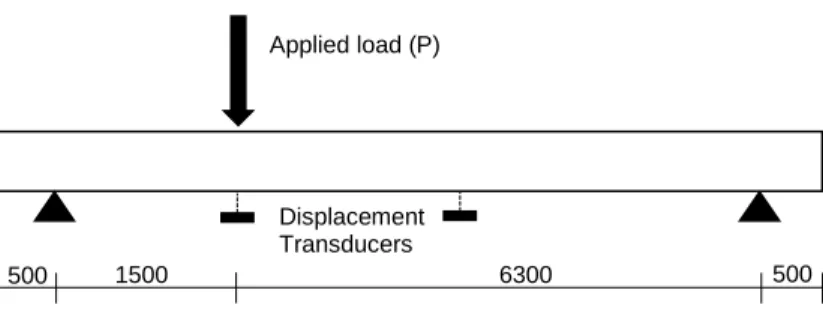
The experimental setup is shown in Fig. 2. The PSC beams were loaded using a 1MN MTS Universal Testing Machine. The load was applied as a single concentrated load to the beam. To minimise the probability of load transfer directly to the support through a diagonal compressive strut, a shear span-to-depth ratio of 3 was adopted. This was determined following a review of current literature (Baali 2009, Hawkins 2005 & Runzel 2008). Displacement transducers were placed at mid-span and under the load point to monitor vertical displacements. Load was applied by displacement control at a rate of 3.0mm/minute until to point of first cracking and increased to 4.8mm/minute until failure.
1500 6300 500
Applied load (P)
500
Displacement Transducers
Fig. 2 Applied loading regime for experiments
PSC Beams
Grout between each beam PSC beams transversely
3.2 PSC Beam Design
The PSC beams were designed to provide a shear failure, and contain less than codified minimum shear reinforcement (Table 1). Final design details for the investigation are shown in Fig. 3. The characteristic reinforcement profile for the PSC beams included 12 off 15.2mm diameter, 7-wire ordinary prestressed strands, Grade 1750, and R10 ligatures Grade 250, spaced at 250mm centres. An inital prestressing force at stressing of 150kN for each strand was specified prior to the transfer of prestress. This was lower than normal so that the prestressing force at the time of the test, represented the prestressing force after long-term losses in bridge beams in the field. Additional design details, are outlined in Table 2.
During the design of the PSC beams, it was recognised that there were a number of provisions within codified standards, and common design practices that had to be implemented to account:
The development length and transfer length of prestressed strand;
Loss of prestress; and
Excluding the area of prestressed reinforcement outside closed ligatures.
Therefore, to predict the ultimate capacity and expected applied failure load, the design of the PSC beams compared:
1. A lower estimate using the codified provisions which neglected the reinforcement not confined within the ligatures and considered the gradual development of the strands, and
2. An upper estimate which assumed full reinforcement development and full contribution of the prestressed reinforcement,
Table 2, outlines the comparison of theoretical moment and shear capacities between the previous AS5100-2004, and the current AS5100-2017, for the loading regime shown in Fig. 2.
Table 1 presents the minimum shear reinforcement requirements for the various codified standards. The ligatures in the PSC beams have an Asv = 157mm2 which is less than the minimum requirements as a proportion ranging between 47%-75%.
Table 1
Required Minimum Shear Reinforcement
Standard Model Code Asv.min (mm2) Proportion of Asv.min in PSC Beams
AS5100-2004 209 75%
AS5100-2017 253 62%
S6 253 62%
FIB MC2010 337 47%
Table 2
Design details and capacity comparisons
Beam Details
PSC beam size (mm) 500(d) x 596(w) x 8800(l) Characteristic compressive strength (MPa) 50
Prestressing strand profile 12 off 15.2mm diameter strands, Grade 1750 Prestressing force per stand (kN) 150
Shear reinforcement profile R10 – 250 centres Grade 250
Theoretical Shear Capacity using the Codified Provisions
Model code1 AS5100-2004 AS5100-2017
Shear theory AS3600 Shear Model MCFT
Theoretical shear capacity (kN)2 455 354
Theoretical applied failure load (kN) 536 410 Corresponding moment at section d (kNm) 448 349
Theoretical Shear Capacity adopting full development and reinforcement contribution
Theoretical shear capacity at applied load (kN) 2 647 530
Theoretical applied failure load (kN) 774 628 Corresponding moment at section d (kNm) 635 520 Notes: 1. All capacity calculations are unfactored i.e. ϕ = 1
2. Shear capacity has been reduced for dead load.
3. The predicted capacity has been calculated at the section d from the face of the loading plate
3.3 Concrete Mix and Compressive Strength Gain Requirements
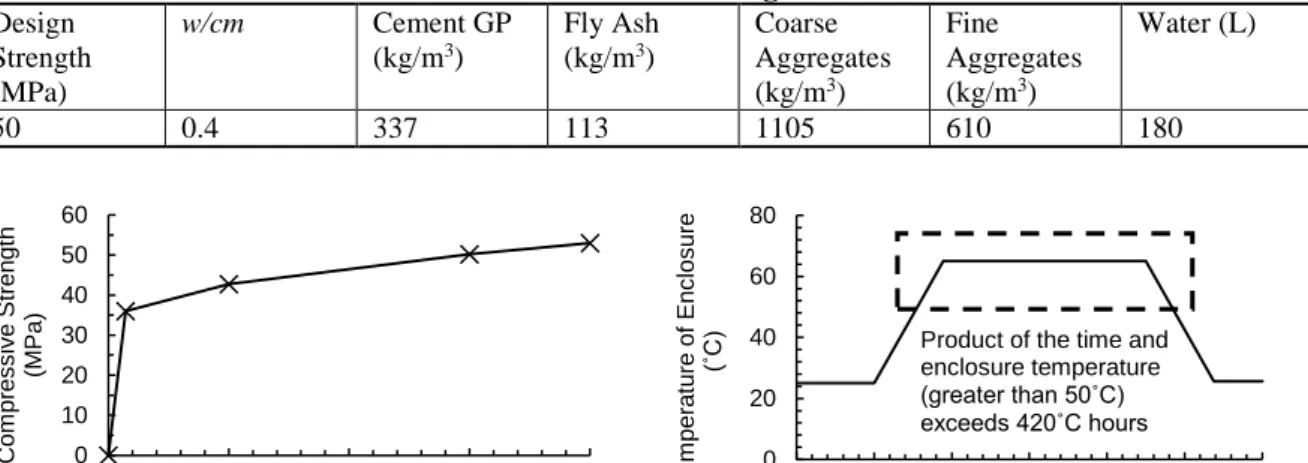
Table 3, outlines the mix design for the concrete used to make the beams. The concrete was supplied in accordance with TMR’s technical specification MRTS70 Concrete. General purpose cement and fly ash formed the cementitious binder (25% of total binder), and was proportioned at a water-to-cementitious ratio of 0.40. The nominal aggregate size was 20mm, graded in accordance with TMR’s technical specification MRTS70 Concrete. A 100mm nominal slump was achieved by using water reducing agents and retarders compliant to AS1478.1.
Steam cured trial mixes were undertaken to develop the appropriate mix proportions to achieve an early age strength of 30MPa at 15-18 hours, to meet the commercial precast manufacturing cycle requirements, and to limit the 28-day compressive strength. Results are shown in Fig. 4. Samples were steam cured in accordance with the steam curing regime outlined in TMR’s technical specification MRTS70 Concrete, this is shown in Fig. 5.
Fig. 4, shows that the design characteristic compressive strength of 50MPa would be attained at 21 days. Therefore, 21 days following casting was adopted as the PSC beam testing day for the study.
Table 3
Concrete Mix Design Design Strength (MPa) w/cm Cement GP (kg/m3) Fly Ash (kg/m3) Coarse Aggregates (kg/m3) Fine Aggregates (kg/m3) Water (L) 50 0.4 337 113 1105 610 180
Fig. 4 Compressive strength gain with age, for the
concrete mix development
Fig. 5 Targeted steam curing regime in accordance
with MRTS70 0 10 20 30 40 50 60 0 7 14 21 28 C o m p re s s iv e S tr e n g th (M P a ) Age (Days) 0 20 40 60 80 0 2 4 6 8 10 12 Tem p e ra tu re o f E n c los u re (˚C) Age (Hours) Product of the time and enclosure temperature (greater than 50˚C) exceeds 420˚C hours
3.4 Measurement of Ligature Strain
Strain gauges were attached to each leg of the shear reinforcement in the shear span, as shown in Fig. 3. The strain gauges were positioned along the mid-depth of the cross section as the crack pattern was difficult to predict. It is acknowledged that the gauge will only provide a reading of the strain if there is a crack in close proximity, and the gauge is located in the zone of cracking/ steel deformation.
4
Experimental Results
4.1 Ultimate Shear Strength
The key experimental results are provided in Table 4. These include;
The compressive strength at time of testing,
The peak applied load at failure, Pexp; Corresponding shear force, Vexp; and The average shear stress, exp.
The experimental ultimate shear strength was consistent across all three beams with an average of 737kN and 3% coefficient of variation (COV).
Table 4
Comparison of experimental ultimate strengths Beam Average compressive
concrete strength (MPa) Applied load at failure (Pexp) (kN) Shear force at failure (Vexp) (kN) Average shear stress at failure exp = Vexp/bd (MPa) CC-PSC-1 47 760 636 2.55 CC-PSC-2 737 625 2.51 CC-PSC-3 714 599 2.40 Average 737 625 2.51 COV % 3% 3% 3%
Notes: 1. The corresponding shear force (Vexp) includes the un-factored self-weight, and has been calculated at
the section, d from the face of the loading plate.
4.2 Shear Cracking Behaviour
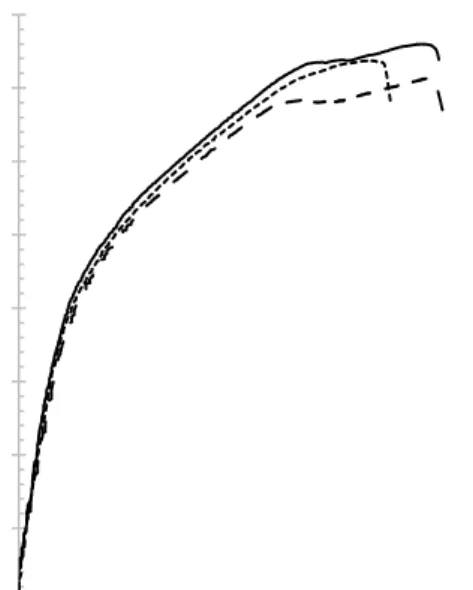
Fig. 6, illustrates the typical load-deflection curve for the PSC beams tested as part of this investigation, and Fig. 7, compares the load-deflection for each of the three tests.
In the first stage (Point A to B), before cracks formed, the beams exhibited linear-elastic behaviour. The first change in slope correlates with the initial fine flexural cracking adjacent to the loading point (Point B, Fig.6 and Fig. 8).
Point B to C: On further loading, the fine flexural cracks extended towards the compressive zone, until the formation of flexural-shear cracks. Strain in the shear reinforcement increased suddenly after the inclined cracks (Point C, Fig.6 and Fig. 8).
Point C to D: The flexural-shear cracking extended diagonally towards the loading point and the zone of increasing compressive stress.
Point D to E: Once the shear reinforcement yields, there was a significant decrease in the load-deflection slope. This corresponds to a redistribution of internal shear stresses throughout the shear span, resulting in a small increase in load, and the formation of additional diagonal cracks off the main shear crack. The beam reached failure when the concrete in the compression zone, near the load point, was crushed, and featured a wide diagonal shear crack (Point E, Fig.6 and Fig. 8).
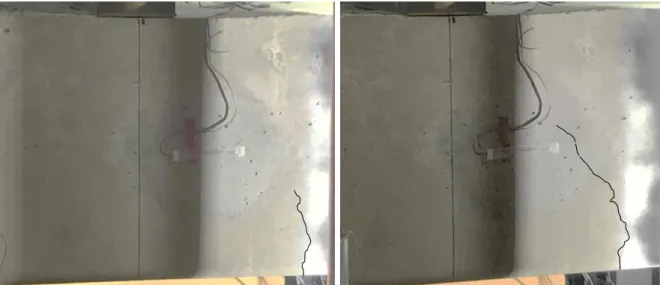
Fig. 9, illustrates that the final failure behaviour of beam CC-PSC-2 was different to the other two beams (CC-PSC-1 and CC-PSC-3). The failure was more abrupt, and from the load-deflection diagram, it appears that there was less internal shear redistribution in the shear span prior to the failure load being reached.
Fig. 6 Load-deflection curve for CC-PSC-1 and corresponding reinforcement strain
Fig. 7 Load-deflection curves for all beams
4.3 Summary of the Shear Failure Characteristics from the Experimental Tests
The crack initiation, propagation and behaviour was similar across all three beams. All beams failed in shear prior to reaching their flexural capacities with following characteristics:
The failure was characterised by crushing of the concrete in the compression zone at the applied load;
Large diagonal cracks formed on an inclination angle ranging between 35-45 degrees;
Buckling of the wired in the top layer of prestress strand at collapse;
Complete tensile failure of shear reinforcement ligatures;
Spalling of the bottom sections of concrete below the closed ligature; and,
Deflections between 60 to 70mm which are equivalent to between Span/110 and Span/130. Of particular note, was the abrupt nature of the ultimate failure. The sudden failure and load-deflection response is consistent with similar experimental tests conducted by Baali (2009), where the member contains a fully prestressed cross-section (i.e. there is no un-stressed flexural reinforcement). This is in contrast to the tests conducted by Lin (2012), where the PSC beams were partially prestressed. The failure behaviour of these beams was more gradual after the peak load was reached, resulting in progressive spalling of the concrete.
0 0.005 0.01 0.015 0 100 200 300 400 500 600 700 800 0 20 40 60 80 Strain in reinforcement A p p lie d L o a d ( k N ) Displacement (mm) CC-PSC-1 S5(strain) 0 100 200 300 400 500 600 700 800 0 20 40 60 80 A p p lie d L o a d ( k N ) Displacement (mm) CC-PSC-1 CC-PSC-2 CC-PSC-3 Point A Point B Point C Point D Point E
Point B. Load 400kN First Flexural Crack Point C. 530kN Flexural crack turns into flexure shear crack and propagates diagonally
Point D. 730kN continued propagation of diagonal
cracks.
Point E. 760kN catastrophic failure, failure in
compression zone and shear failure.
Fig. 8 CC-PSC-1 Shear failure (CC-PSC-3 similar)
Point D. 730kN continued propagation of diagonal crack
Point E. 730kN, catastrophic failure, and compression failure
5
Comparison with Codified Models
Codified standard approaches have attempted to establish simple and rational theory to describe the effects of shear for prestressed concrete members (Hawkins & al. 2005). Most codified standards calculate the beam-shear strength of prestressed concrete members as the summation of three components; a concrete contribution Vc, a shear reinforcement contribution Vs, and the vertical component of prestress crossing the section under consideration Pv. This methodology is adopted in each of the codified standard models used in this study. In the context of this study, the Pv is equal to zero since the prestressed tendons were horizontal.
Table 5, compares the experimental shear failure loads of the PSC beams with the calculated shear capacities of the following codified standards; AS5100-2004, AS5100-2017, S6 CHBDC, Fib2010. The PSC beam shear capacity, incorporates the following tested material properties;
Average compressive concrete strength of 47MPa (1% COV), and
Average yield strength of shear reinforcement 360MPa, obtained from the material test certificates of the supplied reinforcement.
Sherwood, Bentz & Collins (2007), highlighted that the ACI design code (similar to the shear model provisions in AS5100-2004), and the simplified MCFT provisions predict that the coexisting moment decreases the sectional shear capacity, as a result the capacities reported were calculated at the section located d from the face of the loading plate. Therefore, this study has adopted this methodology (Sherwood, Bentz & Collins 2007), and presents (Table 5) the shear capacity and shear force at failure calculated at the section located d from the face of the loading plate. This methodology is in accordance with the provisions of fib MC2010 Clause 7.3.3 “Cross-sectional design”.
The comparison indicates that the ultimate shear predictions by the AS5100-2004 provisions are higher than those obtained by experimental test (Vexp). The variation of the Vexp/Vu (AS5100-2004) ratio is from 0.86 to 0.92, with an average of 0.89.
The ultimate shear predictions by the AS5100-2017 provisions are lower than those obtained by experimental test (Vexp). The variation of the Vexp/Vu (AS5100-2017) ratio is from 1.18 to 1.12, with an average of 1.15.
As expected, AS5100-2017, S6, and FIB2010 (average Vexp/Vu (S6) = 1.16 and Vexp/Vu (FIB2010) = 1.16 respectively) results are essentially the same as all three are based on the MCFT method derived by Vecchio & Collins (1986), and use the strain of the longitudinal reinforcement and concrete to derive the shear capacity predication.
Table 5
Comparison of ultimate shear strengths and codified prediction
Beam Applied Load at failure (P) (kN) Shear force at failure (Vexp) (kN)
AS5100-2004 AS5100-2017 S6 FIB2010
Vu Vexp/Vu Vu 2 Vexp/Vu Vu 2 Vexp/Vu Vu 2 Vexp/Vu
CC-PSC-1 760 636 695 0.92 537 1.18 534 1.19 536 1.19 CC-PSC-2 737 625 695 0.90 537 1.16 534 1.17 536 1.17 CC-PSC-3 714 599 695 0.86 537 1.12 534 1.12 536 1.12 Average 737 636 695 0.89 537 1.15 534 1.16 536 1.16 Notes: 1. All capacity calculations are unfactored i.e. ϕ = 1
2. Shear capacity is for the loading regime outlined in Fig 1.
3. The predicted capacities have been calculated at the section d from the face of the loading plate
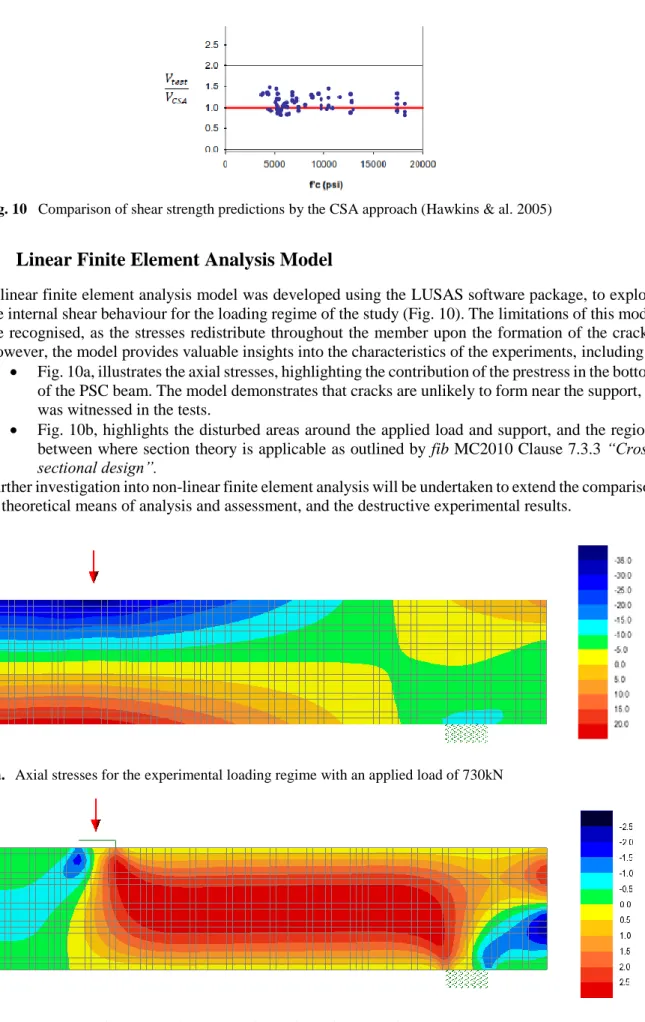
Fig/ 10, presents Vtest/VCSA comparison ratios for a number of test results reported by Hawkins & al. (2005) (The CSA referred to in Fig x, is the S6 CHBDC). It can be seen that the Vexp/Vu (S6) results from this study (Table 5) are within the variation bounds documented by the authors.
Fig. 10 Comparison of shear strength predictions by the CSA approach (Hawkins & al. 2005)
6
Linear Finite Element Analysis Model
A linear finite element analysis model was developed using the LUSAS software package, to explore the internal shear behaviour for the loading regime of the study (Fig. 10). The limitations of this model are recognised, as the stresses redistribute throughout the member upon the formation of the cracks. However, the model provides valuable insights into the characteristics of the experiments, including:
Fig. 10a, illustrates the axial stresses, highlighting the contribution of the prestress in the bottom of the PSC beam. The model demonstrates that cracks are unlikely to form near the support, as was witnessed in the tests.
Fig. 10b, highlights the disturbed areas around the applied load and support, and the regions between where section theory is applicable as outlined by fib MC2010 Clause 7.3.3
“Cross-sectional design”.
Further investigation into non-linear finite element analysis will be undertaken to extend the comparison of theoretical means of analysis and assessment, and the destructive experimental results.
a. Axial stresses for the experimental loading regime with an applied load of 730kN
b. Shear stresses for the experimental loading regime with an applied load of 730kN
7
Concluding Remarks
Bentz, Vecchio & Collins (2006) observe that the shear behaviour of reinforced concrete continues to be studied, and discussed as there is no agreed basis for a rational theory, and experiments cannot be conducted for concrete beams subjected to pure shear. Shear failures of PSC beam structures are potentially brittle and could occur without warning due to the low level of shear reinforcement which is often associated with these types of beams. This brittle and explosive nature of failure was evident in the testing of PSC beams within this study. This illustrates the increased importance of being able to accurately and safely predict the shear capacities and ductility of bridge beams.
Based on the test results of this study, the follow conclusions were drawn:
1. The crack initiation, propagation and behaviour were similar across all three beams.
2. The ultimate failure load was consistent across all three beams, that being an average of 737kN with 3% COV.
3. In comparison with the codified models:
a. The AS5100-2004 predictions of ultimate shear capacity were higher than those obtained by experimental test, with an average Vexp/Vu (AS5100-2004) ratio of 0.89. b. The AS5100-2017 predictions of ultimate shear capacity were lower than those
obtained by experimental test (Vexp), with an average Vexp/Vu (AS5100-2004) ratio of 1.15. c. As expected, AS5100-2017, S6, and FIB2010 provided similar results as all three are
based on the MCFT method.
4. It is important to note that the tests were conducted on PSC beams with a solid cross-section, and the correlation between experimental results and predicted shear capacity may be different with members containing thin webs where web-shear cracking governs, such as voided PSC beams, PSC I-girders, and PSC Super-T girders.
5. Future research and analysis will explore non-linear finite element analysis to extend the comparison of theoretical means of analysis and assessment, and the destructive experimental results.
Acknowledgements
The research described in this paper was sponsored by the Queensland Department of Transport and Main Roads (TMR). The authors wish to acknowledge this support, and the following:
Numerous TMR staff for their contribution and support throughout the research
University of Queensland, School of Civil Engineering, and technical staff for their contribution and support.
ENCO Precast, for the manufacture of the PSC Beams.
Hanson Concrete, for supplying the concrete.
References
Arezoumandi, M. & Voltz, J. (2013), An Experimental study on shear strength of chemically-based self-consolidating concrete,” International Journal of Concrete Structures and Materials, vol. 7, no. 4, pp. 273-285
Baali, L. (2009), Self-consolidating concrete for precast prestressed concrete bridge elements. Master thesis, McGill University, Montreal, Canada.
Bentz, E., Vecchio, F., and Collins, M. (2006), The Simplified MCFT for Calculating the Shear Strength of Reinforced Concrete Elements, ACI Structural Journal, vol. 103, no. 4, pp. 614-624.
CAN/CSA S6-14 (2014), Canadian Highway Bridge Design Code. Canadian Standards Association, Mississauga, ON, Canada
Department of Transport and Main Roads, (2013), Tier 1 Bridge Heavy Load Assessment Criteria, August 2013, Queensland Australia
Hawkins, N.M., Kuchma D.A., Mast R.F., Marsh M.L. & Reineck K-H. (2005), Simplified Shear Design of Structural Concrete Members, National Cooperative Highway Research Program, NCHRP Report 549.
Heywood, R., Shaw, P., Mitchell, J., & Miller, C. (2017), Operational and Inventory Management of Bridges, 10th Austroads Bridge Conference, Melbourne, Victoria, Australia
International Federation for Structural Concrete (fib) (2013), fib Model Code for Concrete Structures 2010, International Federation for Structural Concrete (fib), Berlin
Lin, C., & Chen, S. (2012), Shear Behaviour of Prestressed Beams with High-Workability Concrete, ICE Magazine of Concrete Research, Vol. 64, no. 5, pp. 419-432.
Moau, P., Tsang, J., Heywood. R., & Shaw, P. (2017), Shear in Prestressed Concrete I-Girder Bridges. 10th Austroads Bridge Conference, Melbourne, Victoria, Australia
Runzel, B., Shield, C. & French, C. (2008), Shear Capacity of Prestressed Concrete Beams. Minnesota Department of Transportation.
Shaw, P., Heywood, R., Mitchell, J., & Wilson, D. (2017), Management of Heavy Vehicle Access to Bridges, 10th Austroads Bridge Conference, Melbourne, Victoria, Australia
Sherwood, E., Bentz, E., & Collins, M. (2007), Effect of Aggregate Size on beam-Shear Strength of Thick Slabs. ACI Structural Journal, Vol. 104, no. 2, pp. 180-190.
Standards Australia, AS 5100-2004, Bridge design. Standards Australia, Sydney, Australia. Standards Australia, AS 5100-2017, Bridge design. Standards Australia, Sydney, Australia.
Vecchio, F.J. & Collins, M.P. (1986), The Modified Compression Field Theory for Reinforced Concrete Elements Subjected to Shear. Journal of the American Concrete Institute, Vol. 83, No. 2 (1986) pp. 219-231.