Performance of export-oriented small and medium-sized
manufacturing enterprises in Viet Nam
By
Tran Quoc Trung, Nguyen Thanh Tung,
Tran Duy Dong and Phan Hoai Duong
* Ministry of Planning and Investment, Viet Nam. The views presented in this paper are those of the authors and do notnecessarily reflect the views of Ministry of Planning and Investment, Asia-Pacific Research and Training Network on Trade (ARTNeT) members, partners and the United Nations.This study was conducted as part of the ARTNeT initiative and was carried out with the aid of a grant from the World Trade Organization. The technical support of the United Nations Economic and Social Commission for Asia and the Pacific isgratefully acknowledged. Any remaining errors are the responsibility of the authors, who can be contacted at [email protected] .
The Asia-Pacific Research and Training Network on Trade is aimed at building regional trade policy and facilitation research capacity in developing countries. The ARTNeT Working Paper Series disseminates the findings of work in progress to encourage the exchange of ideas about trade issues. An objective of the series is to get the findings out quickly, even if the presentations are less than fully polished. ARTNeT working papers are available online at: www.artnetontrade.org. All material in the
Asia-Pacific Research and Training Network on Trade Working Paper Series, No. 54, April 2008
Contents
Abbreviations and acronyms ... 3
Executive summary ... 4
Introduction ... 5
I. Development and performance of export-oriented SMMEs ... 8
A. Characteristics and development ... 8
B. Performance...14
C. Plant and job turnover rate... 17
II. Determinants of the export participation of SMMEs and performance of export-oriented SMMEs... 19
A. Determinants of export participation by SMMEs ... 19
B. Determinants of performance of export-oriented SMMEs ... 22
III. Conclusion and policy implications ... 28
Annexes 1a. SMES, SMMES and export-oriented SMMES in Viet Nam, 2004 ... 30
1b. Export-oriented smmes in Viet Nam, 2004... 31
2a. SMES in Viet Nam, 2000-2005 ... 32
2b. Performance of enterprises in Viet Nam, 2005...32
3. Definitions of variables………..33
4. Logistics model of export orientation of an SMME in Viet Nam, 2000, 2003 and 2004...34
5. Determinants of revenue of export-oriented SMMEs in Viet Nam, 2000-2004………...35
References ... 36
Abbreviations and acronyms
ASMED Agency for SME DevelopmentCAGR compound annual growth rate IE Institute of Economics
ILSSA Institute for Labour Studies and Social Affairs MPDF Mekong Private Sector Development Facility MPI Ministry of Planning and Investment
OLS ordinary least squares
SME small and medium-sized enterprise
SMME small and medium-sized manufacturing enterprise SOE state-owned enterprise
Executive summary
Liberalization of the business environment as well as increased international integration in Viet Nam have resulted in the rapid expansion of small and medium-sized enterprises (SMEs) in general and export-oriented small and medium-sized manufacturing enterprises (SMMEs) in particular, especially since 2000. More than 95 per cent of formal enterprises belong to the SME category. Around 17 per cent of SMMEs are involved in export activities. The export-oriented SMMEs account for 36 per cent of workforce and 45 per cent of total assets, and contribute to around 42 per cent of industrial output of all SMMEs.
Export-oriented SMMEs tend to be larger in size and mainly belong to the medium-sized category. They are unevenly distributed among regions and are mainly concentrated in the south-east of the country. They are owned both by domestic private companies and by foreign investment enterprises. Among SMMEs, the export-oriented firms are more likely to survive in business, expand their operations, generate jobs and become large enterprises. Although they perform well in terms of growth rate, especially foreign investment enterprises, the profitability of export-oriented SMMEs is relatively low. The promising findings are that among export-oriented SMMEs there is increasingly sustainable development, and that this sector is becoming more efficient and productive.
Those SMMEs in the medium-sized category, and which are owned by foreign investors operating export-oriented industries located in the South-East and the Red River delta, have a higher probability of participating in the export market. SMMEs also gain benefits from international integration in the improvement of their performance, and the large manufacturing enterprises within the industry play an important role in increasing export participation by SMMEs.
In addition to the traditional factors determining the performance of export-oriented SMMEs, i.e., capital and labour, this study finds ownership form, company location, previous experience in the export market (but not the type of industry in which they operate) to be significant determinants of export-oriented SMME performance – expressed in terms of revenue and revenue growth in this paper. The findings do not appear to support the hypothesis that financial constraints hinder export participation by SMMEs and the performance of export-oriented SMMEs. This is probably because export-oriented SMMEs are the best performers among SMEs and therefore have better access to financial sources than other SMEs. Analysis of the 2004-2005 data shows that export-oriented SMMEs are more likely to create jobs than those that are not, as well as to become large enterprises.
The study recommends the formulation of policies that support the development of business linkages and networking, and which promote subcontracting arrangements between small and large enterprises or between domestic firms and foreign investment enterprises. It is also necessary to support and facilitate the direct involvement of SMMEs in exporting or indirectly through large manufacturing enterprises. Moreover, it requires substantial investment in infrastructure and industrial support facilities and services (i.e., roads, ports, logistics facilities and services, and market information) in the underdeveloped regions with priority being given to those areas with the greatest potential for development, i.e., the North central coast, the South central coast and the Mekong delta.
Introduction
Since 1986, liberalization of the business environment and increased integration into the world economy has been a key theme in the open-door policy of Viet Nam. Most notably, the central Government has made great efforts in promoting and facilitating the development of the private sector by promulgating and implementing a number of business and investment promotion laws since the early 1990s, and has been especially successfully with its introduction of the Enterprise Law1 in 2000. Furthermore, trade policy2 in Viet Nam has changed significantly from inward-oriented import substitution towards outward-orientation (Oostendorp and others, 2006). Most recently, Viet Nam became an official World Trade Organization (WTO) member in January 2007.
During this process, the SME3 sector has developed at a remarkable pace in terms of the number and performance of enterprises. The highly dynamic SMEs created about 28 per cent of the total of 7.5 million newly created jobs during 2000-2005 (Government of Viet Nam, 2006). However, a review of the literature indicates that there are several major concerns regarding the SME sector:
(a) Although the number of private domestic firms registered under the Enterprise Law increased steadily each year (e.g., from 14,441 in 2000 to 39,881 in 2005), only half of the firms actually exist. In addition, existing enterprises are very small whereas “middle and importantly high end” firms are missing (Viet Nam Development Report, 2005; Ministry of Planning and Investment,2005);
(b) The emerging private sector is still, to a large extent, inward-oriented, and a very small proportion of private manufacturing SMEs are participating in the export sector (Viet Nam Development Report, 2005; Kokko and Sjoholm, 2004);
(c) Most SMEs do not realize the great impact that globalization and integration have on their businesses with regard to the continuous improvement of their competitiveness as well as the new opportunities provided by the integration (Ministry of Planning and Investment,2005; Institute of Economics, 2003).
These concerns would suggest that small domestic businesses face obstacles in operating, expanding and eventually making it to the top (Viet Nam Development Report, 2005). The inward orientation and small scale of the SME sector are expected to pose a big challenge for the future contribution of SMEs to economic growth, export performance, job creation and poverty reduction targets, as pointed out in the Social Economic Development Plan, 2006-2010.
In Viet Nam, previous studies on the development of the private sector and SMEs have been conducted by Riedel and Tran (1997), Webster (1999), Webster and Taussig
1
The most important aspect of the Enterprise Law was the simplification of the business registration procedure for new private enterprises and the elimination of more than 160 business licences and permits as well as thousands of sub-licences and conditions issued at the ministerial and local levels since 2000.
2
It included a shift from a state monopoly of foreign trade towards a more competitive system, with increasing participation by the private sector, the abolition of non-tariff barriers, integration with the world economy via
(1999), Ronnas and Ramamurthy (2001), Steer and Taussig (2002), Ministry of Planning and Investment (2005), and Hansen and others (2005). These studies typically focused on analysing the changes in the role of the SME sector over the past few decades and on providing a comprehensive picture of the benefits, obstacles and challenges in the development and internationalization of SMEs in Viet Nam, and the important determinants of their performance. Recently, Kokko and Sjöholm (2004) reported that economic internationalization had little direct impact on SMEs, i.e., only a few SMEs actually benefited from internalization with regard to the expansion of their markets and increased revenue. The study also noted that successful enterprises had gradually grown and no longer belonged to the SME category.
It is a fact that export-oriented manufacturing SMEs4 are viewed as a dynamic, flexible and innovative sector, contributing to exports and industrial development. In Viet Nam, these enterprises tend to be larger in size, perform better and enjoy more opportunities for becoming large enterprises when compared to the majority of SMEs in general, and manufacturing SMEs in particular. They also have very different characteristics in terms of ownership, regional distribution and industry of operation to those of other SMEs, especially manufacturing SMEs (annex 1a and 1b). A better understanding of this type of enterprise as well as how to support and promote them will be the key to the success and further industrial development of Viet Nam in the future.
Moreover, the literature review shows that to date none of the previous studies comprehensively analyses the performance of export-oriented manufacturing SMEs5 in Viet Nam. Therefore, it is an excellent opportunity to study this issue in Viet Nam in terms of the dynamic changes resulting from integration into the world economy.
The main objectives of this study were to reveal the factors behind export participation by manufacturing SMEs and the performance of export-oriented manufacturing SMEs, and to identify a set of measures that would enable SMEs to more easily and directly participate in global trade, especially in the post-WTO context.
To achieve the main objectives discussed above, this study seeks to answer the following questions:
(a) What was the development and performance of export-oriented manufacturing SMEs in Viet Nam during 2000-2005?
(b) What are the determinants of export participation by manufacturing SMEs in Viet Nam?
(c) What are the determinants of performance by export-oriented manufacturing SMEs in Viet Nam?
(d) What are the implications for formulating a set of administrative and regulatory measures and systems that would enable SMEs to more easily and directly participate in global trade?
4
Export-oriented manufacturing SMEs in Viet Nam are formally registered enterprises that have an average number of annual permanent employees of less than 300, are operating as manufacturers and are involved in direct export activities in the surveyed year.
The analysis in this paper is based on the availability of six enterprise surveys6 of enterprises that are in actual operation at the end of each previous year, which were conducted annually from 2001 to 2006 by the General Statistical Office of Viet Nam. The surveys collected information related to business industry, performance, labour, capital, taxation, and involvement in export and import activities of enterprises. Some extended sections regarding skilled labour, intermediate inputs, research and development expenditure, technology level, ICT applications, technical training for employees of enterprises and investment climate were collected separately.
Chapter I provides an overview of the SME sector and a review of SME support policies that have significant effects on the development of the SME sector in general, and an analysis of the development of export-oriented SMMEs since 2000 in particular. Chapter II quantitatively analyses the export participation of manufacturing SMEs and the performance of export-oriented SMMEs in Viet Nam during the past few years. Chapter III discusses the policy implications drawn from this study.
I. Development and performance of export-oriented SMMEs
A. Characteristics and development
The development of the SME sector in Viet Nam can be divided into two phases, with the turning point in 2000 when the Law on Enterprises came into effect. Since then, the Government has adopted more reform policies to accelerate development of the private enterprise sector (box 1). As a result, the SME sector has achieved significant development (box 2).
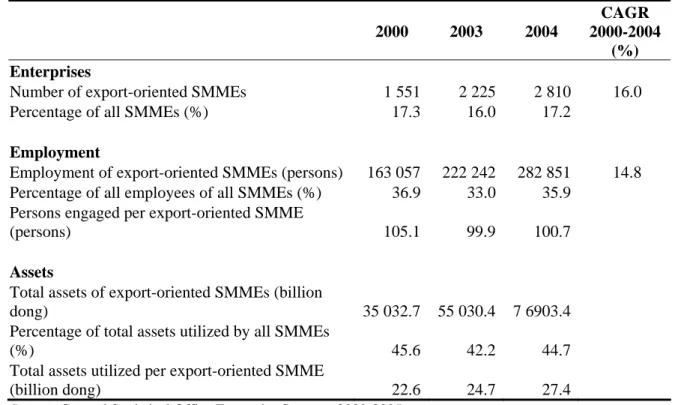
The rapid expansion of the SME sector resulted in the rapid increase in terms of the number of export-oriented SMMEs at a compound annual growth rate (CAGR) of 16 per cent between 2000 and 2004. Table 1 shows the number of export-oriented SMMEs increased rapidly from 1,551 enterprises in 2000 to 2,225 enterprises in 2004. Although only around 17 per cent of SMMEs were involved in export activities, they accounted for 36 per cent of the total employees working in all SMMEs and 45 per cent of total assets utilized by all SMMEs. These shares have not changed much during the past few years.
Table 1. Export-oriented SMMEs in Viet Nam, 2000-2004
2000 2003 2004
CAGR 2000-2004
(%)
Enterprises
Number of export-oriented SMMEs 1 551 2 225 2 810 16.0 Percentage of all SMMEs (%) 17.3 16.0 17.2
Employment
Employment of export-oriented SMMEs (persons) 163 057 222 242 282 851 14.8 Percentage of all employees of all SMMEs (%) 36.9 33.0 35.9
Persons engaged per export-oriented SMME
(persons) 105.1 99.9 100.7
Assets
Total assets of export-oriented SMMEs (billion
dong) 35 032.7 55 030.4 7 6903.4
Percentage of total assets utilized by all SMMEs
(%) 45.6 42.2 44.7
Total assets utilized per export-oriented SMME
(billion dong) 22.6 24.7 27.4
Source: General Statistical Office Enterprise Surveys, 2000-2005.
Box 1. Reforms of the legal framework for SMEs
After 2000, the Government of Viet Nam adopted more reform policies to accelerate development of the private enterprise sector. The Government formulated a comprehensive and synchronized legal framework in parallel with perfecting existing legal documents regulating enterprise activities. One of the milestones for the reform was the enforcement of the Law on Enterprises in 2000 and Decree 90/2001/ND-CP, dated 23 November 2001, which stipulates supporting measures for SME development. A number of under-law documents to guide the implementation of the Law on Enterprises have been issued and implemented.
In 2001, to resolve the finance constraints on SMEs, the Government set up the Credit Guarantee Fund, which enables SMEs to borrow credits to support business activities with favourable borrowing conditions. In 2002 the Ministry of Finance issued a circular guiding expenditure for supporting trade and export promotion activities of SMEs, which grants enterprises more authority in financing their trade and export promotion costs for expand business activities.
In 2003, support for SMEs was given high priority on agenda of the Government with the establishing the SME Development Promotion Council at the central level. The main mandate of the Council is to coordinate duties among concerned ministries and institutions in supporting the development of the SME sector. To increase the effectiveness of the supporting measures for SME development, the Government established the Agency for SME Development (ASMED) under the Ministry of Planning and Investment; ASMED acts as the focal point for coordinating support activities of other government agencies in promoting SME development. At the same time, the Government allowed the ministry to establish three Technical Assistance Centres for SMEs under ASMED in the south, north and central regions in order to deliver the supporting measures to SMEs. These centres are designed to assist SMEs, especially with technical issues within these regions, and to promote the establishment of SMEs.
The shortage of skilled labour continues to be a serious issue in Viet Nam. The Government has paid a great deal of attention to this issue by setting up support programmes for SMEs in training skilled labour. In early 2006, the State Bank of Viet Nam issued a circular that stipulated measures and conditions for mobilizing resources for Credit Guarantee Funds provided to SMEs. According to the circular, in certain sectors SMEs can be provided with financial support or access to favourable loans to support their labour-training activities.
In late 2006, the SME Development Plan for 2006-2010 was approved by the prime minister. The plan reaffirmed the Government’s decisive efforts to promote this sector systematically and orderly.
At the local level, local authorities in Hanoi, Ho Chi Minh City, Binh Thuan and Ba Ria-Vung Tau have established Support Centres to promote SMEs within these cities and provinces. The centres are designed to support SMEs in human resources training, trade and investment promotion, and technology transfers.
Box 2. Overview of SME development
The legal framework reform has had a positive effect on the development of SMEs. As annex 2a shows, the number of SMEs increased nearly three-fold from 39,915 in 2000 to 109,738 in 2005. SMEs are still a dominant type of enterprise in Viet Nam, accounting for more than 95 per cent of total enterprises. However, the gap between the number of actively operating enterprises and the number of registered enterprises is still large. By the end of 2005, there were 113,352 active enterprises compared with 205,095 registered enterprises. This complements the Viet Nam Development Report (VDR) 2005 findings.
SMEs have been attracting a large proportion of the country’s labour force. In 2005, SMEs created more than 2.5 million jobs for workers, which was more than two times higher than in 2000, and accounted for 40.5 per cent of total employees working in the formal enterprise sector. However, the average number of SME employees did not change much from 2000 to 2005, remaining at around 25 employees per enterprise.
Together with the increasing number of newly established SMEs, the total assets of SMEs also increased considerably from 2000 to 2005. Total assets of SMEs increased more than three-fold from 2000 to 2005 (annex 2a). As a result, from 2000 to 2005 the average total assets of SMEs increased from VND 7.4 billion to VND 8.3 billion (almost 12 per cent), respectively.
Although the total revenue of SMEs declined from 2000 to 2001, it showed an increasing trend from 2001 to 2005. However, the total profit per employee per enterprise decreased markedly from 2003 to 2005. The profit per employee per enterprise in 2005 was less than half that recorded in 2002 and 2003. Moreover, the gap between large enterprises and SMEs in terms of total profit per employee per enterprise increased sharply from 1.34 in 2000 to 6.87 in 2005. These figures indicate that there is increasing competition among enterprises and that there are obstacles hindering the development and efficient performance of SMEs.
Results from the Enterprises Survey for 2005 show that SMEs represented 96.8 per cent of total enterprises, of which micro and small enterprises formed the majority. Micro enterprises and small enterprises comprised 51.3 and 40.4 per cent of total enterprises, respectively (annex 2). Yet, the fixed assets utilized per large enterprise (VND 193.8 billion) are much larger that those of SMEs (VND 2.7 billion). In addition, each employee of large enterprises generated profit nearly seven times higher than those of SMEs.
Annex 2b reveals that large enterprises operate more effectively than small enterprises in terms of profit per employee. The profit per employee increased in accordance with the size of an enterprise. The performance of an enterprise depends not just on size, but on many other factors such as management skills, capacity of employees, technology and marketing management. However, it is clear that in Viet Nam larger enterprises appear to operate better than smaller enterprises.
Among sectors, SMEs in the service sector account for 63.4 per cent of total enterprises, followed by those in the manufacturing sector (20 per cent) and construction (13.3 per cent). Most large enterprises are to be found in the manufacturing sector (60.2 per cent) while only 16.4 per cent are involved in the service sector. Geographically, most SMEs are concentrated in the regions where big cities are located, such as the Red River delta area (27 per cent), south-east (36 per cent) and the Mekong River delta area (13 per cent). Only a small amount of SMEs are located in the remaining regions, such as the north-west and the Central Highlands, because of the underdevelopment of those regions.
In terms of ownership, domestic non-state-owned enterprises (SOEs) comprise 95 per cent of total SMEs while SOEs and foreign-owned enterprises account for only about 2.5 per cent. The size of the SME sector is very small. Nearly 95 per cent of SMEs fall within the small enterprise category and have less than 100 employees each.
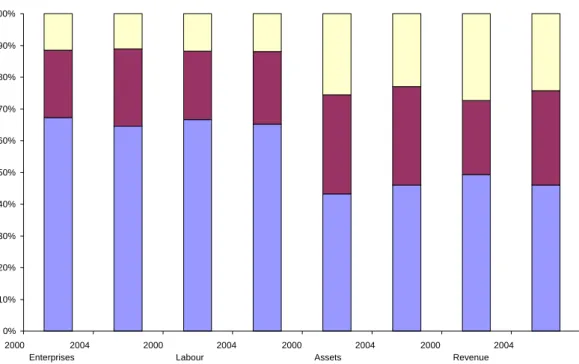
Nearly two-thirds of export-oriented SMEs were manufacturing food products, textiles and garments, wood products and furniture, rubber and plastics products, in which Viet Nam has achieved a high growth rate in export volume during the past few years. It is important to note that the share of export-oriented SMMEs in these industries has been declining while the share of export-oriented SMEs manufacturing footwear, chemicals and chemical products, non-metallic mineral and metal products, and machinery and equipment has been increasing in terms of the number of enterprises, labour and revenue but not in terms of assets during the same period. The role of foreign investment in the capital incentive industries also increased (figure I). This implies that export-oriented SMMEs are shifting from labour-intensive industries to capital-intensive industries.
Figure II shows that export-oriented SMMEs, both domestic non-state-owned and those with foreign investment, accounted for the largest proportion of export-oriented SMMEs while only 3.3 per cent of export-oriented SMMEs were state-owned enterprises (SOEs). The foreign investment enterprises expanded faster then domestic enterprises while SOEs underwent contraction. The number of foreign investment export-oriented SMMEs increased by more than two times during 2000-2004. The main reason for the reduction in the number of SOEs was that the Government has been promoting the implementation of the SOE reform programme through equitization, transfer, sale, contracting and leasing small SOEs since 1998 (Mekong Economics, 2002).
Figure I. Export-oriented SMMEs by industry, 2000-2004
0% 10% 20% 30% 40% 50% 60% 70% 80% 90% 100% Other products.
Footwear, chemicals and chemical products, non-metallic mineral and metal products, machinery and equipment. Food products, textiles and garments, wood products and furniture, rubber and plastics products.
2000 Enterprises 2004 2000 Labour 2004 2000 Assets 2004 2000 Revenue 2004
Figure II. Export-oriented SMMEs by ownership (percentage), 2000-2004
Source: General Statistical Office Enterprise Surveys, 2000-2004.
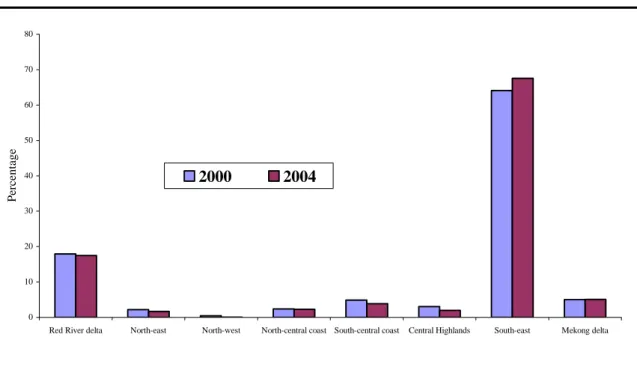
More than two-thirds of export-oriented SMMEs were located in south-eastern Viet Nam, the hub of industrial development with better infrastructure, and seaport and logistic facilities. The enterprises in all other regions (except the Red River delta) represent only a small number of export-oriented SMMEs. The share of export-oriented SMMEs in the south-east and the Mekong delta is increasing but is declining in all other regions (figure III). The enterprises mainly undergoing expansion are located in the south-east, the Mekong delta, the Red River delta, and the north-central coast.
Figure III. Distribution of export-oriented SMMEs by region, 2000-2004
Source: General Statistical Office Enterprise Surveys, 2000-2004. 2004 Foreign 38.9 SOEs 3.3 Domestic 57.8 2004 SOEs 3.3 Foreign 38.9 Domestic 57.8 0 10 20 30 40 50 60 70 80
Red River delta North-east North-west North-central coast South-central coast Central Highlands South-east Mekong delta
P
er
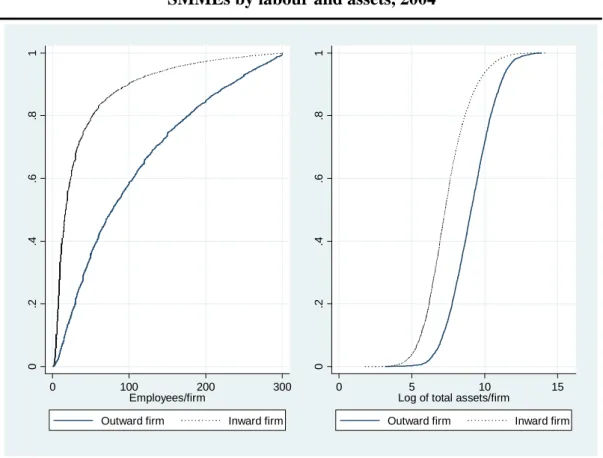
Compared to SMEs, the company size, ownership and geographical distribution of export-oriented SMMEs are quite different. Company size, in terms of labour and capital, of export-oriented SMMEs tends to be larger than that of other SMMEs as well as SMEs. The cumulative fraction in terms of labour and capital of export-oriented and inward-oriented SMMEs clearly indicates that the size of export-oriented SMMEs is much bigger than that of inward SMMEs (figure IV).
Domestic non-state-owned SMEs and SMMEs dominate the market while both domestic non-state-owned and foreign investment export-oriented SMMEs account for the largest proportion of enterprises. SMEs and SMMEs are distributed more evenly among the developed regions of the country and are expanding in all regions except the Mekong delta (annex 1a), whereas export-oriented SMMEs are mainly concentrated in the south-east (annex 1b).
Among export-oriented SMMEs, the ownership and geographical distribution characteristics of long-established and new export-oriented SMMEs are similar. In terms of size, as measured by total number of employees and total capital utilized, the well-established export-oriented SMMEs tend to be larger than new companies. More importantly, the new export-oriented SMEs are expanding the fastest (annex 1a). This implies that small manufacturing enterprises in Viet Nam also have strong potential for becoming exporters and for being able to catch up with the and large-size enterprises. However, it will require a major effort to reduce the regional development gaps in terms of infrastructure and industrial support services.
Figure IV. Cumulative fraction of export-oriented and inward-oriented SMMEs by labour and assets, 2004
0 .2 .4 .6 .8 1 0 100 200 300 Employees/firm
Outward firm Inward firm
0 .2 .4 .6 .8 1 0 5 10 15
Log of total assets/firm
B. Performance of export-oriented SMMEs
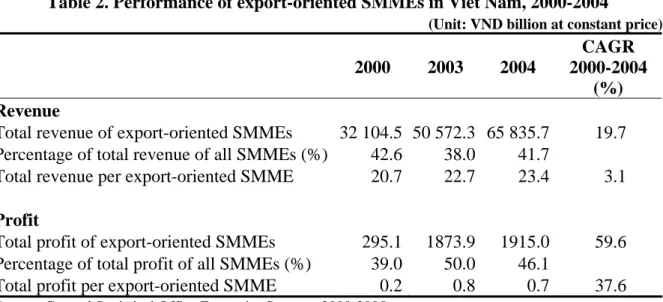
Measured by the increase in revenue at CAGR of 19.7 per cent and profit at CAGR of 59.6 per cent, the export-oriented SMMEs performed well between 2000 and 2004. Although only about 17 per cent of SMMEs were involved in export activities, these export-oriented enterprises accounted for around 42 per cent of total revenue of all SMMEs, 46 per cent of total profit of all SMMEs and nearly 40 per cent of the total tax contribution of all SMMEs (tables 1 and 2). Because the export-oriented SMMEs grew relatively faster than other SMMEs, these share figures have shown a tendency to increase during the past few years.
Table 2. Performance of export-oriented SMMEs in Viet Nam, 2000-2004
(Unit: VND billion at constant price)
2000 2003 2004
CAGR 2000-2004
(%)
Revenue
Total revenue of export-oriented SMMEs 32 104.5 50 572.3 65 835.7 19.7 Percentage of total revenue of all SMMEs (%) 42.6 38.0 41.7
Total revenue per export-oriented SMME 20.7 22.7 23.4 3.1
Profit Total profit of export-oriented SMMEs 295.1 1873.9 1915.0 59.6
Percentage of total profit of all SMMEs (%) 39.0 50.0 46.1
Total profit per export-oriented SMME 0.2 0.8 0.7 37.6 Source: General Statistical Office Enterprise Surveys, 2000-2005.
Note: Calculation for only years where export data was collected.
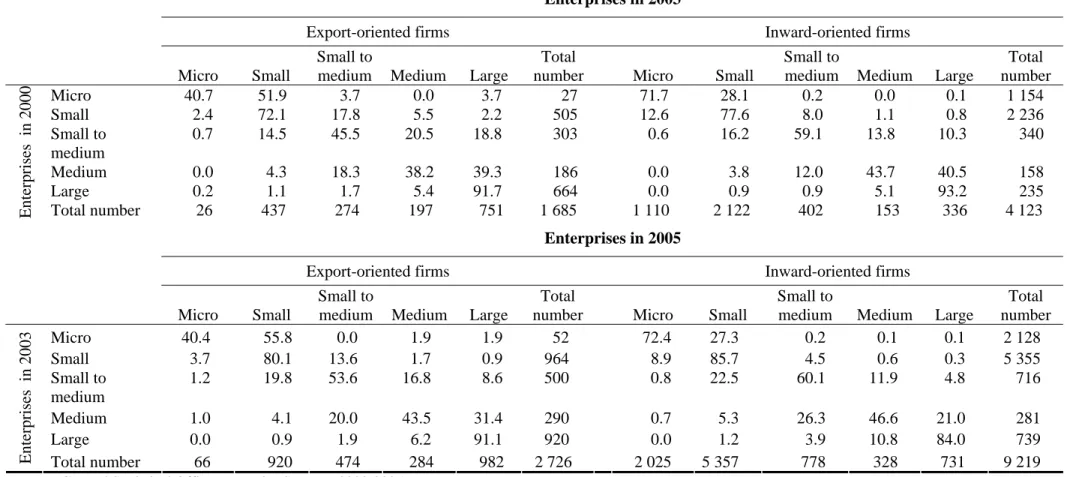
The transition matrix of company size during 2000-2005 shows that export-oriented SMMEs in Viet Nam are more likely to expand and become large manufacturing enterprises than inward-oriented SMMEs. During 2000-2003, around 8.4 per cent of export-oriented SMMEs became large manufacturing enterprises while only 2.8 per cent of inward-oriented SMMEs achieved the same result. Similarly, 5.3 per cent of export-oriented SMMEs but only 1.2 per cent of inward-oriented SMMEs successfully expanded between 2003 and 2005 (table 3).
Table 3. Enterprise size transition matrix, 2000-2005
(Unit: Per cent)
Enterprises in 2003
Export-oriented firms Inward-oriented firms
Micro Small
Small to
medium Medium Large
Total
number Micro Small
Small to
medium Medium Large
Total number Micro 40.7 51.9 3.7 0.0 3.7 27 71.7 28.1 0.2 0.0 0.1 1 154 Small 2.4 72.1 17.8 5.5 2.2 505 12.6 77.6 8.0 1.1 0.8 2 236 Small to medium 0.7 14.5 45.5 20.5 18.8 303 0.6 16.2 59.1 13.8 10.3 340 Medium 0.0 4.3 18.3 38.2 39.3 186 0.0 3.8 12.0 43.7 40.5 158 Large 0.2 1.1 1.7 5.4 91.7 664 0.0 0.9 0.9 5.1 93.2 235
Enterprises in 2000 Total number 26 437 274 197 751 1 685 1 110 2 122 402 153 336 4 123
Enterprises in 2005
Export-oriented firms Inward-oriented firms
Micro Small
Small to
medium Medium Large
Total
number Micro Small
Small to
medium Medium Large
Total number Micro 40.4 55.8 0.0 1.9 1.9 52 72.4 27.3 0.2 0.1 0.1 2 128 Small 3.7 80.1 13.6 1.7 0.9 964 8.9 85.7 4.5 0.6 0.3 5 355 Small to medium 1.2 19.8 53.6 16.8 8.6 500 0.8 22.5 60.1 11.9 4.8 716 Medium 1.0 4.1 20.0 43.5 31.4 290 0.7 5.3 26.3 46.6 21.0 281 Large 0.0 0.9 1.9 6.2 91.1 920 0.0 1.2 3.9 10.8 84.0 739
Enterprises in 2003 Total number 66 920 474 284 982 2 726 2 025 5 357 778 328 731 9 219
Source: General Statistical Office Enterprise Surveys, 2000-2005.
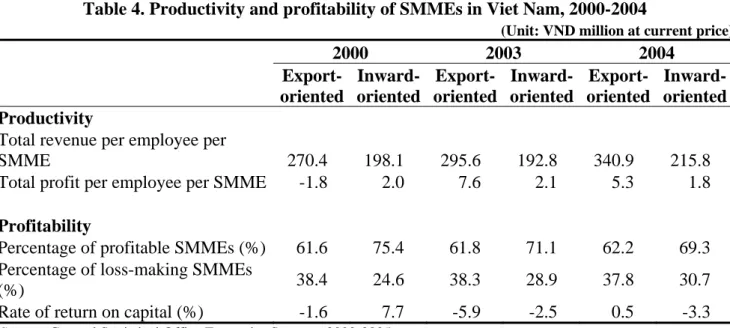
Table 4 shows performance was better among export-oriented SMMEs than among inward-oriented SMMEs in terms of productivity, as measured by the total revenue per employee per enterprise and total profit per employee per enterprise, but not in terms of profitability as measured by the percentage of profitable firms. The average total revenue per employee per enterprise and total profit per employee per enterprise of export-oriented SMMEs were around 1.6 and 3 times higher than these of inward-oriented SMMEs, respectively, in 2004. In 2004, some 62 per cent of export-oriented SMMEs were profitable while around 69 per cent of inward-oriented SMMEs were profitable. However, the returns to capital difference between export-oriented and inward-oriented SMMEs were not statistically significant at the 10 per cent confidence level in 2003 and 2004.
It is important to note that the productivity and profitability of export-oriented SMMEs in Viet Nam were increasing while the productivity and profitability of inward-oriented SMMEs were declining. It can be seen, therefore, that the inward-inward-oriented SMMEs were more profitable than export-oriented SMMEs in relative terms but not statistically in absolute terms. However, the returns to capital of both export-oriented and inward-oriented SMMEs on average were very low, and much lower than the average market interest rate. This is a major concern.
Table 4. Productivity and profitability of SMMEs in Viet Nam, 2000-2004
(Unit: VND million at current price)
2000 2003 2004 Export-oriented Inward-oriented Export-oriented Inward-oriented Export-oriented Inward-oriented Productivity
Total revenue per employee per
SMME 270.4 198.1 295.6 192.8 340.9 215.8
Total profit per employee per SMME -1.8 2.0 7.6 2.1 5.3 1.8 Profitability
Percentage of profitable SMMEs (%) 61.6 75.4 61.8 71.1 62.2 69.3 Percentage of loss-making SMMEs
(%) 38.4 24.6 38.3 28.9 37.8 30.7
Rate of return on capital (%) -1.6 7.7 -5.9 -2.5 0.5 -3.3 Source: General Statistical Office Enterprise Surveys, 2000-2005.
Note: Rate of return on capital per enterprise = mean (total profit/total fixed assets*100).
Among export-oriented SMMEs, the foreign investment enterprises tend to be more productive but less profitable compared with domestic enterprises. In addition, enterprises located in the developed regions (Red River delta and the south-east) are more productive but less profitable compared with enterprises located in other regions. Enterprises located in the mountainous and highland regions (the north-west and the Central Highlands) have the lowest productivity and profitability compared with enterprises located in all other regions (annex 1a and 1b). This implies that the regional gap in terms of development and performance of export-oriented SMMEs is increasing.
It is important to note that the performance of export-oriented SMMEs operating in industries in which Viet Nam has comparative advantages in international markets appears to
established enterprises perform best in comparison with small and new enterprises (annex 1a and 1b).
C. Plant and job turnover rate of export-oriented SMMEs
Both entry and exit are crucial elements of the market selection process that leads to the restructuring and evolution of industry. Therefore, the process of entry and exit of firms has long been held to play an important role in the evolution and adaptation of industry to change. Entry and exit are inherent parts of the dynamic competitive process, and which lead to some firms expanding and others declining.
There is evidence that when an economy integrates deeply into the world economy, the exit and entry of SMEs are frequently seen. Those who are able take opportunities to increase their productivity or competitiveness are survivors, and the active entry by SMEs would be a source of dynamism in the manufacturing sector (Bellone and others, 2006; Chin-Hee, 2000; Kawai and Urata, 2001).
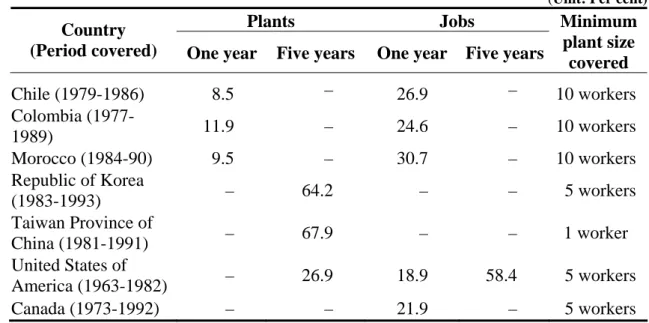
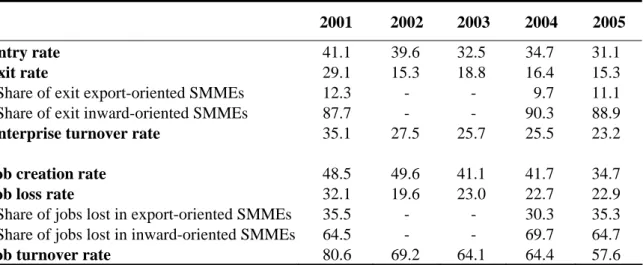
Tables 5 and 6 show that enterprise and job turnover rates in Viet Nam between 2001 and 2005 were extremely high compared with other developing and developed countries. However, it is important to note that enterprise and job turnover rates of SMMEs declined rapidly during 2001-2005. In relative terms, the exit and job destruction rates of export-oriented SMMEs were lower than these of inward-export-oriented SMMEs (tables 1 and 6). This reflects the low costs of entering and exiting the market as a result of removing obstacles for doing business and especially market entry in Viet Nam during the past decade. It also implies that SMME development tends to become more stable, especially in the case of export-oriented SMMEs.
Table 5. Plant and job turnover rates of manufacturing enterprises in developing and developed countries
(Unit: Per cent)
Plants Jobs Country
(Period covered) One year Five years One year Five years
Minimum plant size covered Chile (1979-1986) 8.5 – 26.9 – 10 workers Colombia (1977-1989) 11.9 – 24.6 – 10 workers Morocco (1984-90) 9.5 – 30.7 – 10 workers Republic of Korea (1983-1993) – 64.2 – – 5 workers Taiwan Province of China (1981-1991) – 67.9 – – 1 worker United States of America (1963-1982) – 26.9 18.9 58.4 5 workers Canada (1973-1992) – – 21.9 – 5 workers Source: Tybout, 2000.
The finding on the exit rate of SMMEs was relatively higher than the finding from a three-wave survey of SMEs in Viet Nam conducted by ILSSA, which found that the exit rate of SMEs was in excess of 15 per cent per year in the early 1990s, declining to less than 10 per cent in recent years (Viet Nam Development Report, 2005). However, SMEs in those surveys were only located in the major cities of Viet Nam and they were not representative of all SMEs. Therefore, in the cities the exit rate may be lower.
The high plant turnover rate in Viet Nam would be consistent with the finding by Goreski (1995) that in a turbulent economic environment company entry and exit rates are both high. Rapid growth provides many opportunities for new firms, while making existing companies obsolete more quickly.
Table 6. Entry and exit rates and job turnover rate of SMMEs in Viet Nam, 2001-2005
(Unit: Per cent)
2001 2002 2003 2004 2005 Entry rate 41.1 39.6 32.5 34.7 31.1
Exit rate 29.1 15.3 18.8 16.4 15.3 Share of exit export-oriented SMMEs 12.3 - - 9.7 11.1 Share of exit inward-oriented SMMEs 87.7 - - 90.3 88.9
Enterprise turnover rate 35.1 27.5 25.7 25.5 23.2
Job creation rate 48.5 49.6 41.1 41.7 34.7
Job loss rate 32.1 19.6 23.0 22.7 22.9 Share of jobs lost in export-oriented SMMEs 35.5 - - 30.3 35.3 Share of jobs lost in inward-oriented SMMEs 64.5 - - 69.7 64.7
Job turnover rate 80.6 69.2 64.1 64.4 57.6 Source: General Statistical Office Enterprise Surveys, 2000-2005.
Note: Let Nt be the number of enterprises observed in year t; Et the number of enterprises observed in year t
but not t-1; and Xt the number of enterprises observed in year t-1 but not in year t. Then the entry rate is
Et/Nt-1 and the exit rate is Xt/Nt-1. The enterprise turnover rate is the average of these two statistics. Similarly,
the rate of gross job creation is the number of jobs at entering enterprises plus the number of new jobs at expanding enterprises, divided by the initial number of jobs, while the gross job loss rate is the number of jobs that disappear as enterprises contract or exit divided by the initial number of jobs. The sum of these two rates is the job turnover rate (Tybout, 2000). The export-oriented or inward enterprises are defined based on enterprises observed in year t-1.
Table 7. Export-oriented SMMEs in Viet Nam by survival and termination, 2004
(Unit: VND million at current rate, unless otherwise specified)
Revenue per employee Profit per employee Share of profit- making firms (%) Rate of return on total assets (%) Total mean 340.9 5.3 62.2 -0.4
Survival between 2003 and 2005 386.6 10.7 68.7 1.1 Startup between 2003 and 2004,
and survival to 2005 170.9 -6.3 44.3 -3.7
Terminated between 2004 and 2005 352.3 -9.8 51.6 -4.1 Source: General Statistical Office Enterprises Surveys, 2000-2005.
II. Determinants of the export participation of SMMEs and performance of
export-oriented SMMEs
A. Determinants of export participation by SMMEs
What factors determine why some SMMEs are involved in export activities and others are not? The descriptive analysis in chapter I shows that the share of export-oriented SMMEs has not changed much in relative terms during the past few years. The medium-sized manufacturing enterprises are more likely to be involved in export activities than are small enterprises. Export-oriented SMEs mainly operate in industries in which Viet Nam has comparative advantages in international markets. They are owned by both private domestic and foreign investors, and are mainly located in the south-east and Red River delta regions, which have better infrastructure, port and logistics facilities, easier access to labour, raw materials and other industrial supporting services.
Although the descriptive analysis is useful, it suffers from the limitation of only being able to see the effects of one variable at a time. A more rigorous answer to the question, which would allow one to measure the effect of a variable while holding all other influences constant, calls for the estimation of a logistic model. Here, the dependent variable is set at equal to 1 if an enterprise is involved in export activities in the year of survey, and to zero otherwise.
A range of variables are believed to affect whether or not an SMME exports (annex 3). Those used in this model include:
(a) Labour productivity;
(b) Enterprise size (measured with dummy variables for micro, small, small to medium, and medium-size enterprises);
(c) Ownership (measured with dummy variables for SOE, domestic private and foreign investment enterprises);
(d) Type of industry (measured with dummy variables for export-oriented, import substituting and non-tradable industry7);
(e) Export participation in the previous year (dummy variable);
(f) Availability of credit (financial leverage measured in terms of total assets divided by shareholders' equity);
(g) Business linkages (measured as the logarithm of the number of large enterprises or large export-oriented enterprises in the industry);
(h) Year that dummies control for macroeconomic environment differences over time; (i) Regional dummy variable control for other regional determinants of performance
such as access to markets, quality of the local infrastructure or availability of natural resources.
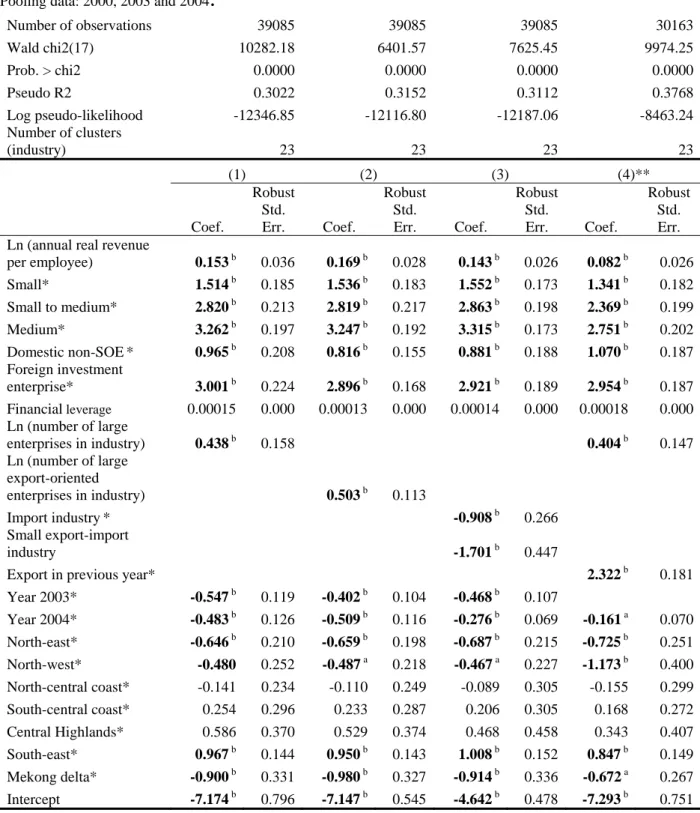
The logit model was estimated by using pooled data and cross-sectional data from the General Statistical Office’s Enterprise Surveys of 2000, 2003 and 2004, during which they collected export information. The estimation results are set out in table 8 and annex 4. The more productive and larger enterprises were found to have a higher probability of
participating in export activities. These findings complement earlier studies on SMEs, which showed that a very small proportion of private SMMEs participated in exports and that exporters tended to be large in size (Viet Nam Development Report, 2005; Kokko and Sjöholm, 2004).
Foreign investment enterprises were found to have a higher chance of participating in export activities compared with their domestic private and SOE counterparts. Financial constraints did not appear to be influence the determination of export participation by SMMEs.8 However, this finding should be interpreted with care because it is widely known that SOEs in Viet Nam still benefited from cheaper credit, and better access to land and government procurement policies (O’Connor 1998; Tenev and others, 2003) while foreign investment enterprises were required to have legal capital of more than 30 per cent of the investment capital prior to July 2006 (the date that the Law on Investment, 2005 became effective).
Regressions (1), (2) and (4) show that the number of large enterprises or export-oriented large enterprises in the industry was important, raising the likelihood of export participation of SMMEs. This implies that there were business linkages between large enterprises and SMEs within the industry. Regression (3) confirms the findings that enterprises were more likely to participate in exporting if they were operating in Viet Nam’s export-oriented industries that had comparative advantages in international markets.
Regression (4) shows that being an exporter in the previous year significantly increased the probability remaining an exporter either in 2003 or 2004 or both. The year dummies in table 8 suggest a rather pessimistic finding of a declining trend in export participation by SMMEs9 in relative terms. Enterprises located in South East region are more likely while enterprises located in Northern Uplands and Mekong Delta regions are less likely to engage in export activities.
8
Annex 1a shows only around 4 per cent of SMMEs were state-owned while 86 per cent and nearly 10 per cent of SMMEs are domestic private and foreign investment, respectively.
9
2000-Table 8. Logistic model of export participation of a manufacturing SME, 2000, 2003 and 2004
Regression with robust standard errors and clusters (industry at the 2-digit level). Pooling data: 2000, 2003 and 2004
.
Number of observations 39085 39085 39085 30163 Wald chi2(17) 10282.18 6401.57 7625.45 9974.25 Prob. > chi2 0.0000 0.0000 0.0000 0.0000 Pseudo R2 0.3022 0.3152 0.3112 0.3768 Log pseudo-likelihood -12346.85 -12116.80 -12187.06 -8463.24 Number of clusters (industry) 23 23 23 23 (1) (2) (3) (4)** Coef. Robust Std. Err. Coef. Robust Std. Err. Coef. Robust Std. Err. Coef. Robust Std. Err. Ln (annual real revenue
per employee) 0.153 b 0.036 0.169 b 0.028 0.143 b 0.026 0.082 b 0.026 Small* 1.514 b 0.185 1.536 b 0.183 1.552 b 0.173 1.341 b 0.182 Small to medium* 2.820 b 0.213 2.819 b 0.217 2.863 b 0.198 2.369 b 0.199 Medium* 3.262 b 0.197 3.247 b 0.192 3.315 b 0.173 2.751 b 0.202 Domestic non-SOE* 0.965 b 0.208 0.816 b 0.155 0.881 b 0.188 1.070 b 0.187 Foreign investment enterprise* 3.001 b 0.224 2.896 b 0.168 2.921 b 0.189 2.954 b 0.187 Financial leverage 0.00015 0.000 0.00013 0.000 0.00014 0.000 0.00018 0.000 Ln (number of large enterprises in industry) 0.438 b 0.158 0.404 b 0.147 Ln (number of large export-oriented enterprises in industry) 0.503 b 0.113 Import industry* -0.908 b 0.266 Small export-import industry -1.701 b 0.447
Export in previous year* 2.322 b 0.181
Year 2003* -0.547 b 0.119 -0.402 b 0.104 -0.468 b 0.107 Year 2004* -0.483 b 0.126 -0.509 b 0.116 -0.276 b 0.069 -0.161 a 0.070 North-east* -0.646 b 0.210 -0.659 b 0.198 -0.687 b 0.215 -0.725 b 0.251 North-west* -0.480 0.252 -0.487 a 0.218 -0.467 a 0.227 -1.173 b 0.400 North-central coast* -0.141 0.234 -0.110 0.249 -0.089 0.305 -0.155 0.299 South-central coast* 0.254 0.296 0.233 0.287 0.206 0.305 0.168 0.272 Central Highlands* 0.586 0.370 0.529 0.374 0.468 0.458 0.343 0.407 South-east* 0.967 b 0.144 0.950 b 0.143 1.008 b 0.152 0.847 b 0.149 Mekong delta* -0.900 b 0.331 -0.980 b 0.327 -0.914 b 0.336 -0.672 a 0.267 Intercept -7.174 b 0.796 -7.147 b 0.545 -4.642 b 0.478 -7.293 b 0.751 Source: General Statistical Office Enterprise Surveys, 2000, 2003 and 2004.
Notes: Coefficients in bold are significant at the 10 per cent level; a significant at the 5 per cent level; and b significant at the 1 per cent level. *: Dummy variables. **: In model (4), Year 2000 dropped.
B. Determinants of performance of export-oriented SMMEs
This section considers the performance of export-oriented SMMEs between 2000 and 2005. Performance is driven by the quantity and quality of labour and capital used as well as other variables used in the logit model, i.e., enterprise characteristics, industry of operation, export experience (X), business linkages, regions and so forth (Z), but excluding enterprise size and availability of credit because of multi-colinearity10 (annex 3). It is impossible to know a priori which factors are the most important for the performance of export-oriented SMMEs and must be investigated.
Let Y be an enterprise performance variable of interest (revenue or revenue/labour growth of enterprise). It is naturally related to various characteristics of the enterprise, denoted as X1, …, Xk or in shorthand (vector) notation as X. If the business climate and infrastructure variables matter, Y is also related to Z1 through Zk. Therefore, the model can be demonstrated with the following equation:
Yi=F(Xi, Zi, uyi)
where uyi is a random disturbance, capturing unmeasured determinants of, and stochastic
influences on enterprise revenue and its growth.
The model is estimated by single- equation regression techniques. These techniques assume that explanatory variables are exogenous; in other words, they are not manipulated in response to enterprise revenue. Yet, according to Glewwe, (1999), within the model simultaneously determined inputs (such as capital and labour) and industries of enterprises are likely to be endogenous. Therefore, the inclusion of these variables in the model can cause a simultaneity bias for OLS estimates. To remedy such a bias, these variables are excluded from the model, and two models are estimated: (a) without inputs and industries, referred to as the “reduced-form specification” and (b) with inputs and industries, referred to as the “structural- form specification”.
Enterprise revenue in year t is measured by annual revenue at current prices. To reduce the impact of outliers and deal with heteroskedasticity,11 this variable is specified in logarithmic fashion and the regressions are estimated with robust standard errors and cluster by industry at the 2-digit ISIC level. This means that slope estimates indicate the proportional impact of a one-unit change in Z on Y. The model is estimated by using cross-sectional data from the General Statistical Office Enterprise Surveys of 2000, 2003 and 2004.
Enterprise revenue growth between year t1 and year t0 is the difference in the natural
logarithm of enterprise real revenue, which gives the proportional difference in real revenue or, in the other words, the percentage change between year t0 to year t1 in real revenue.
Similarly, the labour growth of an enterprise between year t1 and year t0 is the difference in
the natural logarithm of total employees of the enterprise. The real annual revenue is adjusted by the annual producer’s price index of industrial products and expressed in 1995 prices.
The growth regression model is estimated based on the sample of surviving panel enterprises between year t0 and year t1. The independent variables refer to conditions in year
10
Multi-colinearity is caused by correlation among the explanatory variables, i.e., the correlation between the enterprise size and labour, and the correlation between financial leverage and capital. This reduces the precision of the estimated impact of each one of them.
11
Breusch-t0, so the regression attempts to find determinants of future revenue or labour growth. The
model is estimated by using panel data from the General Statistical Office Enterprise Surveys between 2000 and 2001, 2003 and 2004, and 2004 and 2005. The revenue growth regression model is estimated on the sample of export-oriented SMMEs while the labour growth regression model is estimated on the sample of all SMMEs between year t0 and year t1 to
examine whether or not export-oriented SMMEs are better at generating jobs than inward-oriented SMMEs.
The average values of the proportional difference in real revenue of export-oriented SMMEs between 2000 and 2001, 2003 and 2004, and 2004 and 2005 are 0.18, 0.21 and 0.18, respectively. This means that the annual average revenue growth rate of the surviving export-oriented SMMEs is almost the same as the average growth rate of industrial exports volume of nearly 19.3 per cent per year during 2001-2005. The average values of the proportional difference in total employees of SMMEs between 2000 and 2001, 2003 and 2004, and 2004 and 2005 are 0.05, 0.20 and 0.21, respectively.
The estimated results from the “reduced-form specification” and the “structural-form specification” are almost the same in terms of significant effects of explanatory variables on the performance of export-oriented SMMEs, except the ownership dummy variable in the revenue models in 2000 and 2003 and regional dummy variable in the revenue models in 2000, 2003 and 2004. The estimated results12 in tables 8 and 9 show that both capital and labour are statistically associated with higher revenue of export-oriented SMMEs but that they lower revenue growth. Relative to SOEs (the omitted ownership dummy), the average revenue of domestic and foreign invested enterprises is significantly lower but the average revenue growth of foreign invested enterprises is significantly higher. Being an exporter in the previous year has statistically significant effects on the increase in revenue but not on revenue growth.
The estimated results of labour growth of SMMEs in table 10 show that relative to inward-oriented SMMEs (the omitted dummy), the average labour growth of export-oriented SMMEs is significantly higher between 2004 and 2005 but not in earlier years. This means that export-oriented SMMEs may have become better than inward-oriented SMMEs at generating jobs. The average labour growth of micro manufacturing enterprises is significantly higher relative to other SMMEs. Relative to SOEs (the omitted ownership dummy), average labour growth of foreign invested enterprises is significantly higher13.
Although the number of large manufacturing enterprises in the industry does not appear to have statistically significant effects on the performance of export-oriented SMMEs in all regressions between 2000 and 2005, there is evidence of increasingly fiercer competition in the market between large manufacturing and SMMEs in the same industry. Annexes 5 suggests that the performance of export-oriented SMMEs operating in tradeable industries is no better, statistically, than that of enterprises operating in import-substituting industries or non-tradeable industries. Relative to the Red River delta (the omitted regional dummy), the average enterprise revenue in the south-central coast, south-east and Mekong
12
The OLS estimates of revenue growth of all surviving enterprises in the panel data do not have much explanatory power; the R2-values are between 0.024 and 0.085, and low levels of statistical significance. As
delta is significantly higher while the average enterprise revenue in the northern uplands is significantly lower. However, the average enterprise revenue growth does not differ significantly among regions.
Table 8. Determinants of revenue of export-oriented SMMEs, 2000-2004
Linear regression
OLS estimates in the presence of arbitrary heteroskedasticity and clusters (industry at the 2-digit level)
Number of observations 1532 1532 2214 2214 2798 2798
R-squared 0.6150 0.1773 0.6411 0.1590 0.6498 0.1822
Number of clusters (industry) 23 23 23 23 23 23
2000 2003 2004 (1) (2) (1) (2) (1) (2) Coef. Robust Std. Err. Coef. Robust Std. Err. Coef. Robust Std. Err. Coef. Robust Std. Err. Coef. Robust Std. Err. Coef. Robust Std. Err. Dependent variable: Log (annual current revenue)
Ln (labour) 0.184a 0.067 0.302 b 0.055 0.275 b 0.035
Ln (capital) 0.813b 0.041 0.767 b 0.050 0.781 b 0.039
Domestic non-SOEs* 0.035 0.096 -1.377 b 0.165 -0.347 0.309 -1.852 b 0.356 -0.164 a 0.060 -1.937 b 0.178
Foreign investment enterprises* -0.479 b 0.144 -0.129 0.137 -0.761 a 0.336 -1.026 b 0.304 -0.583 a 0.079 -1.196 b 0.151
Ln (number of large enterprises
in industry) 0.010 0.136 -0.098 0.199 -0.068 0.114 -0.204 0.182 -0.130 0.097 -0.303 0.176
Exports in previous year* 0.219 b 0.055 0.745 b 0.068 0.355 a 0.051 0.742 b 0.066
North-east* -0.230 0.216 -0.339 0.268 -0.107 0.216 -0.020 0.167 -0.555 0.277 -0.335 0.293 North-west* -0.999 b 0.304 -1.801 a 0.683 -0.798 0.528 -1.477 a 0.525 -0.515 b 0.142 -1.931 b 0.247 North-central coast* -0.408 0.213 -0.591 a 0.250 -0.122 0.113 -0.125 0.268 -0.039 0.057 0.103 0.136 South-central coast* 0.352 0.217 0.379 0.187 0.202 0.125 0.333 b 0.106 0.341 0.181 0.483 b 0.140 Central Highlands* -0.162 0.176 0.204 0.212 -0.249 a 0.103 0.043 0.341 -0.187 0.118 -0.014 0.277 South-east* 0.057 0.138 0.336 b 0.111 0.200 a 0.075 0.391 b 0.098 0.222 b 0.055 0.390 b 0.121 Mekong delta* 0.480a 0.181 0.603a 0.253 0.456 a 0.186 0.437 0.292 0.350 a 0.153 0.370 0.288 Intercept 0.885 0.637 9.825 b 0.834 1.304 0.685 10.817 b 0.832 1.310 a 0.571 11.343 b 0.882
Source: General Statistical Office Enterprise Surveys, 2000-2005.
Table 9. Determinants of revenue change of export-oriented SMMEs between 2000 and 2005
Linear regression
OLS estimates in the presence of arbitrary heteroskedasticity and cluster (industry at the 2-digit level)
Number of observations 1217 1217 1990 1990 2518 2518
R-squared 0.0341 0.0236 0.0551 0.0539 0.0848 0.0843
Number of clusters (industry) 21 21 22 22 23 23
2001-2000 2004-2003 2005-2004 (1) (2) (1) (2) (1) (2) Coef. Robust Std. Err. Coef. Robust Std. Err. Coef. Robust Std. Err. Coef. Robust Std. Err. Coef. Robust Std. Err. Coef. Robust Std. Err. Dependent variable: "Log (Annual real revenue t1) - "Log (Annual real revenue t0)"
Ln (labour) -0.069 a 0.032 -0.024 0.026 0.019 0.035 Ln (capital) -0.023 0.021 0.021 0.021 -0.013 0.013 Domestic non-SOEs* 0.059 0.079 0.151 0.104 0.055 0.115 0.041 0.100 0.308 a 0.069 0.309 b 0.055 Foreign investment enterprises* 0.182 0.101 0.202 0.098 0.209 0.124 0.218 0.121 0.596 a 0.061 0.587 b 0.061 Ln (number of large enterprises in industry) -0.050 0.036 -0.053 0.043 -0.053 0.030 -0.061 a 0.027 -0.007 0.023 -0.002 0.022
Exports in previous year* -0.264 b 0.043 -0.263 b 0.039 -0.402 a 0.048 -0.401 b 0.049
North-east* 0.163 0.210 0.172 0.207 -0.166 0.099 -0.161 0.101 -0.051 0.160 -0.051 0.161 North-west* -0.214 0.127 -0.174 0.121 0.895 0.483 0.875 0.483 -0.413 0.403 -0.421 0.388 North-central coast* -0.113 0.238 -0.112 0.232 0.196 0.130 0.186 0.122 -0.087 0.064 -0.078 0.069 South-central coast* -0.280 0.139 -0.294 a 0.136 0.097 0.061 0.091 0.061 0.078 0.097 0.082 0.098 Central Highlands* -0.288 a 0.118 -0.312 a 0.136 -0.022 0.114 -0.016 0.116 -0.160 a 0.064 -0.164 a 0.059 South-east* -0.031 0.090 -0.040 0.091 0.011 0.049 0.014 0.051 -0.103 a 0.041 -0.105 a 0.042 Mekong delta* -0.225 a 0.105 -0.218 0.106 -0.049 0.116 -0.049 0.114 -0.049 0.060 -0.050 0.059 Intercept 0.850 b 0.267 0.313 0.207 0.327 0.331 0.451 0.219 0.129 0.177 0.074 0.115
Source: General Statistical Office Enterprise Surveys, 2000-2005.
Notes: Coefficients in bold are significant at the 10 per cent level; a significant at the 5 per cent level; and b significant at the 1 per cent level. *: Dummy variables. Regression (1) is structural- form specification; regression (2) is reduced-form specification.
Table 10. Determinants of labour change of SMMEs between 2000 and 2005 Linear regression
OLS estimates in the presence of arbitrary heteroskedasticity and cluster (industry at the 2-digit level)
Number of obs.= 6 297 11 567 13 829
R-squared = 0.0508 0.0154 0.0313
Number of clusters (industry) = 22 23 23
2001-2000 2004-2003 2005-2004 Coef. Robust Std. Err. Coef. Robust Std. Err. Coef. Robust Std. Err. Dependent variable: "Log (total employees t1) - "Log (total employees t0)"
Export-oriented* 0.048 0.033 -0.041 0.028 0.049 b 0.016
Small* -0.260 b 0.033 -0.045 0.073 -0.187 b 0.025
Small to medium* -0.329 b 0.035 -0.065 0.083 -0.267 b 0.034
Medium* -0.347 b 0.030 -0.105 0.088 -0.260 b 0.042
Domestic non-SOEs* -0.025 0.021 0.217 b 0.038 0.053 0.039 Foreign investment enterprises* 0.058 0.027 0.454 b 0.046 0.159 b 0.042 Ln (number of large enterprises
in industry) -0.029 b 0.009 -0.056 a 0.021 -0.014 b 0.004
North East* -0.002 0.043 0.030 0.058 -0.018 0.021
North West* -0.080 0.039 0.141 0.172 -0.048 0.052
North Central Coast* -0.032 0.026 0.084 0.080 -0.056 0.034 South Central Coast* -0.082 a 0.033 0.039 0.036 0.011 0.025 Central Highlands* -0.047 0.054 0.002 0.059 -0.057 0.042 South East* -0.024 0.022 -0.012 0.034 -0.036 b 0.011 Mekong Delta* -0.178 b 0.023 -0.092 a 0.040 -0.054 b 0.011 Intercept 0.455 b 0.068 0.289 b 0.096 0.203 b 0.041 Source: General Statistical Office Enterprise Surveys, 2000-2005.
Notes: Coefficients in bold are significant at the 10 per cent level; a significant at the 5 per cent level; and b significant at the 1 per cent level. *: Dummy variables.
III. Conclusion and policy implications
Liberalization of Viet Nam’s business environment together with the increased integration of the country into the world economy has resulted in the rapid expansion of the SME sector, especially since 2000. By the end of 2005, SMEs in Viet Nam accounted for more than 95 per cent of all enterprises, 40.5 per cent of the workforce in the formal enterprise sector and 34 per cent of total assets utilized by all enterprises.
SMEs dominate in service sector. Most SMEs are owned by the domestic private sector while both domestic private and foreign investment enterprises account for the largest proportion of export-oriented SMMEs. SMEs are more concentrated in the developed regions (the Red River delta, the south-east and the Mekong delta) and have opportunities to expand in the underdeveloped regions. However, export-oriented SMMEs are mainly concentrated and expanding in the south-east. Compared with SMEs, the size of export-oriented SMMEs tends to be larger, placing them in the medium-sized category while the majority of SMEs belong to the small enterprise category.
The analysis in this paper demonstrates a number of concerns regarding the performance of the SME sector in Viet Nam: (a) the size of the SME sector is still very small and seems to be decreasing further; (b) stronger competition in the market has resulted in diminishing performance of SMEs, a widening gap between the performance of large and small enterprises, and an increasing number of non-operative enterprises.
The rapid expansion of the SME sector, plus significant improvements in trade policies that moved away from inward-oriented import substitution towards outward-orientation, resulted in a rapid increase in the number of export-oriented SMMEs at CAGR of 16 per cent between 2000 and 2004. Around 17 per cent of SMMEs are involved in export activities. The export-oriented SMMEs accounted for 36 per cent of the workforce of all SMMEs, 45 per cent of total assets utilized by all SMMEs and around 42 per cent of industrial output of all SMMEs. During 2001-2005, these enterprises performed well and achieved an annual average growth rate that equaled the average growth rate of industrial exports. However, the rate of return to capital of SMMEs on average was very low and much less than the average market interest rate; nearly one-third of all SMMEs were operating at a loss.
Although the share of export-oriented SMMEs in the SMME sector showed a declining trend, performance and profitability increased during the past few years. The plant closure and job destruction rates of export-oriented SMMEs were lower than these of inward- oriented SMMEs and showed a declining trend. The analysis presented in this paper confirms that medium-sized manufacturing enterprises were more likely to become exporters. Those SMMEs operating in export-oriented industries, owned by foreign investors, with previous experience as exporters and located in the south-east and Red River delta regions14 had a higher probability of participating in the export market. More interestingly, the export-oriented SMMEs were more likely to expand their operations, generate more jobs and become large enterprises than were inward-oriented SMMEs.
14
These regions have better infrastructure, and port and logistics facilities as well as better access to international market information, capital and human resources, stronger business linkages, and networking
These findings strongly support the self-selection hypothesis, where firms need to be efficient to survive and thrive in the highly-competitive export markets, and the fact that production cost advantages may be gained through economies of scale. Increasingly sustainable development is occurring among the oriented SMMEs and that the export-oriented SMME sector is becoming more efficient and highly-productive.
SMMEs benefit from integration and increased trade liberalization through improved performance while the large export-oriented manufacturing enterprises play an important role in boosting direct export participation by SMMEs. Therefore, policies that address this externality by (a) supporting the development of business linkages and networking, and (b) promoting subcontracting arrangements between small and large enterprises, or between domestic enterprises and foreign investment enterprises, will greatly assist SMMEs to improve performance and increase benefits from integration. It is also necessary to support and facilitate efforts by SMMEs to engage in exporting either directly or indirectly through large manufacturing enterprises.
In addition to the traditional factors determining the performance of export-oriented SMMEs, i.e., capital and labour, ownership form, location, previous experience in exporting in other sectors are significant determinants of the performance of export-oriented SMMEs. In addition, foreign investment enterprises tend to grow more rapidly than do domestic enterprises and SOEs.
Earlier studies have explicitly indicated that financial constraints faced by SMEs as well as the practice among banking and financial institutions to favour financing for SOEs and large enterprises. However, the findings detailed in this paper do not appear to support the hypothesis that financial constraints hinder export participation by SMMEs or the performance of oriented SMMEs. This may be interpreted as meaning that export-oriented SMMEs (a) are among the most dynamic, efficient and productive SMMEs, (b) are usually large in size, and (c) have the potential to develop. Therefore, these enterprises can be expected to gain access to the financial sources more easily than other SMEs.
Viet Nam has made great efforts during the past decade to remove obstacles to doing business, especially market entry. Yet, to enable SMMEs to continue operating smoothly and effectively, succeed in highly competitive export markets and reduce the regional differences in export participation, substantial investment in infrastructure and industrial support facilities and services (i.e., roads, ports, logistics, facilities and services, and market information) is required in the underdeveloped regions of the country. However, such investment should be prioritized and implemented first in those regions with the highest development potential, i.e., the north-central coast, south-central coast and Mekong delta.
Annexes
1a. SMEs, SMMEs and export-oriented SMMEs in Viet Nam, 2004
(Unit: Per cent, unless otherwise specified)
SMEs Manufacturing SMEs Export-oriented manufacturing SMEs Enterprises Number of enterprises a 88 222 16 389 2 810
Percentage of all enterprises 96.2 17.9 3.1
Distribution of enterprises by 100.0 100.0 100.0 Ownership SOEs 3.4 3.7 3.3 Domestic non-SOEs 93.9 86.5 57.8 Foreign 2.8 9.8 38.9 Region
Red River delta 27.4 28.1 17.5
North-east 6.8 5.1 1.7 North-west 1.2 0.6 0.1 North-central coast 5.9 4.2 2.3 South-central coast 6.8 5.4 3.9 Central Highlands 3.1 1.9 2.0 South-east 34.5 38.6 67.6 Mekong delta 14.2 16.0 5.1 Others 0.1 0.2 0.0 Size Micro 50.4 23.8 4.1 Small 43.5 60.8 54.3 Small to medium 4.4 10.6 26.5 Medium 1.7 4.8 15.2 Employment Employment (person) 2 212 289 788 856 282 851 Percentage of all employees b 38.3 13.7 4.9
Percentage of manufacturing SMEs 35.9
Number of persons engaged per enterprise 25.1 48.1 100.7
Assets
Total assets (billion dong) 701 168.1 172 186.9 76 903.4 Percentage of total assets utilized by all
enterprises c 32.4 8.0 3.6 Percentage of total assets utilized by
manufacturing SME 44.7
Total assets utilized per enterprise (billion
dong) 8.0 10.5 27.4
Performance
Total revenue per employee per enterprise
(million dong at current price) 457.3 237.3 340.9
Total profit per employee per enterprise
(million dong at current price) 2.1 2.4 5.3
Source: General Statistical Office Enterprise Surveys, 2000-2005.
Notes: a Includes formally registered enterprises but excludes household enterprises.
b
1b.Export-oriented SMMEs in 2004
(Unit: Per cent, unless otherwise specified)
Old export-oriented SMMEs a New export-oriented SMMEs b Startup and new export-oriented SMMEs c Total Enterprises Number of enterprises d 612 220 1 331 2 163
Distribution/category of enterprise by: 100.0 100.0 100.0 100.0
Ownership
SOEs 5.9 9.1 1.7 3.6
Domestic non-SOEs 49.2 64.1 58.4 56.4
Foreign 44.9 26.8 40.0 40.0
Region
Red River delta 13.9 22.3 17.5 17.0
North-east 1.3 1.8 1.1 1.3 North-west 0.0 0.0 0.2 0.1 North-central coast 2.1 2.3 2.6 2.5 South-central coast 4.4 2.7 4.2 4.1 Central Highlands 3.3 1.4 1.7 2.1 South-east 70.1 61.8 67.8 67.9 Mekong delta 4.9 7.7 4.8 5.1 Size Micro 1.5 1.4 4.2 3.1 Small 46.7 50.9 56.3 53.0 Small to medium 30.1 31.4 25.5 27.4 Medium 21.7 16.4 14.0 16.4 Employment
Number of persons engaged per enterprise
123.0 107.2 97.1 105.5
Assets
Total assets utilized per enterprise
(VND billion) 41.6 41.5 21.2 29.0
Performance
Total revenue per employee per
enterprise (VND million) 453.2 536.4 320.6 380.1 Total profit per employee per
enterprise (VND million) 17.2 15.3 3.2 8.4
Source: General Statistical Office Enterprise Surveys, 2000-2005.
Notes: a Old export-oriented SMMEs are enterprises involved export-activities in 2000.
b
New oriented SMMEs are enterprises who went from inward oriented in 2000 to export-oriented in 2004.
c
Startup and new export-oriented SMMEs are enterprises who newly established between 2000 and 2004 and involved in export-activities in 2004.
d