30 YEAR INFRASTRUCTURE STRATEGY (2015-45)
L O N G T E R M P L A N 2 0 1 5 - 2 5
Geographic Context
The Far North District is the northernmost district in New Zealand with a land area of 7,324 km² (2.7% of New Zealand). It has 1,756kms of coastline on both the east and west coasts, and 9 major harbour systems. If all islands and rocky outcrops are taken into account, the coastline becomes 2,347kms.
Council provides services to 42 areas within the district. The majority of the district’s land area is rural. It has no single dominant urban area, but there are three major urban areas with populations of between 4,000 and 6,000 (Kaikohe, Kaitaia and Kerikeri), and a further 12 areas have 500 to 2,000 people.
Our large geographical area, combined with our small ‘usually resident’ population (Census 2013: 55,7311), gives us a low population density of 7.6 people per km2 (the New Zealand average is 14.9).
The large geographical area, the number of towns and settlements, the remoteness of some communities and the instability of soils supporting roading, coupled with frequent storm events, gives challenges that most other councils in New Zealand do not face. These challenges make provision of infrastructure more costly, and at times, affect the delivery of services. Council is not alone in being constrained by these challenges. Other infrastructure and service providers, such as Top Energy, telcos (Vodafone & Spark) and the New Zealand Transport Agency (State Highways), are similarly affected.
1
This is different to the estimated resident population figure that is updated at the end of June each year by Statistics NZ kept under review by Council as part of its Long Term, Annual, Infrastructure Strategy and Asset Management planning.
30 YEAR INFRASTRUCTURE STRATEGY (2015-45)
L O N G T E R M P L A N 2 0 1 5 - 2 5
30 YEAR INFRASTRUCTURE STRATEGY (2015-45)
L O N G T E R M P L A N 2 0 1 5 - 2 5
Strategic Direction
The following key strategic imperatives are addressed through this strategy. Plan for the next 30 years
Considering a 30-year horizon for Council’s infrastructure and assets, a disciplined approach has been taken to asset condition, future demand, responding to regulation, maintaining or changing levels of service and overall affordability. Forecasting assumptions have been used to inform this planning and projects have been programmed for the short, medium and long term.
Catch up on core infrastructure
In recent years, Council responded to the Global Financial Crisis by restricting new borrowing and using rates to pay down debt. This resulted in a gap in Council’s programmes of asset renewals and new capital expenditure. Council is now planning to catch up. The strategy proposes significant projects for the core infrastructure of roading, water and wastewater.
Address affordability
The biggest single challenge the district faces is being able to pay for the public services required by our communities. Most of the money that pays for those services comes from the individual households that make up those communities. To be affordable, there needs to be a growing economy where salaries and wages, business incomes, and property values are increasing faster than the increase in rates. Over the seven years from 2006 to 2013, that did not occur. Median household incomes increased by only 2% per annum, property values declined by an average of 16%, but rates increased by 8% annually. Council knows, based on these numbers, the community cannot afford a continuation of large annual rates increases – it simply is not sustainable. As can be seen in this document, Council has staged the investment required to achieve recovery over a number of years to ensure it is affordable to ratepayers. Council is putting in place the strategic plans to ensure that investment goes into the right places, including investing in the economy, and by working smarter with our neighbouring councils to ensure the best value for money for our communities. We will also work with other infrastructure providers where we can to align our programmes of work to reduce costs or deliver more for our communities.
The Far North’s relatively small population, scattered across a large area, makes the provision of infrastructure more costly. The affordability of water and wastewater schemes and roading provision is maximised using funding from other sources such as subsidies (from Government agencies such as the New Zealand Transport Agency and Ministry of Health) and user fees and charges. Working with communities on issues of affordability is important, and by offering opportunities through the LTP consultation process ensures that communities can express their views on the affordability of upgraded infrastructure. Additionally, Council uses a number of different rates to fund schemes and its other activities. In 2015/16, Council will review the complete set of rating policies to better balance the impacts on affordability.
30 YEAR INFRASTRUCTURE STRATEGY (2015-45)
L O N G T E R M P L A N 2 0 1 5 - 2 5 Maintain levels of service
Council plans to maintain the levels of service provided through its infrastructure assets. Many of these assets provide services that are required by regulation and will be maintained as efficiently and cost-effectively as possible. If levels of service are to be increased, the additional cost will be made clear to ratepayers.
Undertake new capital projects
When an increase in levels of service is required, new capital works funded by borrowing are considered, therefore: • Council will prioritise new capital projects based on an objective assessment against key decision-making criteria;
• Council will spend about $10m per year (averaged over the 10 years of the LTP) on these projects to ensure both affordability and timely delivery.
Purpose
Infrastructure provision accounts for 54% of Council’s operating expenditure and 88% of the Council’s capital expenditure. This expenditure provides the foundations on which the Far North community is serviced – it is essential to health, safety, transport, and has a significant impact on the physical environment. Timely and fit-for-purpose infrastructure enables businesses and communities to flourish. Inadequate infrastructure inhibits economic performance and has a negative effect on community wellbeing. Getting the balance of infrastructure spending right determines how Council contributes to communities’ quality of life and adds significant value to attracting tourists, residents and businesses.
This infrastructure strategy outlines:
• the key infrastructural service issues the Far North community must address over the next 30 years; • the main options for dealing with those issues;
• the cost and service delivery implications for residents and businesses of those options; and • Council’s current preferred scenario for infrastructure provision.
The strategy will help Council and the community:
• to make informed decisions in the next three and ten years, and
30 YEAR INFRASTRUCTURE STRATEGY (2015-45)
L O N G T E R M P L A N 2 0 1 5 - 2 5
What is infrastructure?
The strategy covers: • Water supply
• Sewerage and the treatment and disposal of sewage • Stormwater drainage
• The provision of roads and footpaths
• Community infrastructure - only the provision of any new, heated community pool(s) due to the significant community interest in these projects.
Assumptions and capital expenditure drivers
Council, both for this strategy, and for the 2015-25 Long Term Plan, has to make some key decisions about how much capital expenditure is to be invested in infrastructure. Assumptions do not necessarily cover the full 30 years of this strategy, but will be continually assessed for significant change, and amendments will be made as part of each subsequent LTP and Infrastructure Strategy review.
Capital investment decisions are driven by three considerations: • When should existing infrastructure be replaced?
• When should Council invest in improving the existing service?
• How much needs to be invested to provide affordable infrastructure for a growing community?
In preparing this plan, Council has had to make assumptions related to these matters; especially around where communities are growing or will grow in the future grow, despite the static district-wide population.
30 YEAR INFRASTRUCTURE STRATEGY (2015-45)
L O N G T E R M P L A N 2 0 1 5 - 2 5
When should infrastructure be replaced?
The useful lives and associated depreciation rates of major classes of assets are estimated below. Ideally, replacement timing should be based on asset condition rating, which can lead to either early or deferred renewal. In some cases, where condition rating is difficult (i.e. underground assets), the timing for replacement can be made based on a combination of the known asset age and the estimated condition. Council uses closed circuit television (CCTV) surveys, destructive testing and industry benchmarking to estimate the condition of buried assets. Council currently holds comprehensive information on asset age and is developing its capability for assessing asset condition over the next 3 years. During regular asset valuation exercises, Council physically inspects a selection of assets to confirm that the condition is consistent with the accounting life being used in the forecasts. The Infrastructure and Asset Management Department will continue to develop a physical inspection programme, focussed particularly on those assets that are most critical because: they either service large numbers of properties, essential services, and businesses; or are reaching the end of their estimated lives, bearing in mind that geography and storms contribute to a reduction in some assets’ lives.
The performance of reticulation assets typically deteriorates gradually over time. Therefore, it is not critical that any particular pipe is replaced in a specific year. Council will smooth the planned replacement programmes to achieve a balance between optimal timing of replacement, keeping funding demands on ratepayers balanced, and ensuring that work affecting street surfaces is integrated with other work undertaken by Council or other corridor infrastructure providers. Council monitors asset failure rates to identify trends and to adjust the renewals programme accordingly to maximise the life of the assets. Critical assets have been identified and rated in the Northland Lifelines Group Infrastructure Resilience Plan. Council cannot foresee any significant engineering technology that will impact in the near future on our static assets.
Assumption:
Despite a shortage of data for older assets and condition data for buried assets, Council has adequate information about its assets for forward planning.
30 YEAR INFRASTRUCTURE STRATEGY (2015-45)
L O N G T E R M P L A N 2 0 1 5 - 2 5
Water Supply
• 8 potable (drinkable) water schemes that incorporate: • 3 non potable supply areas • 9 water treatment plants Water is sourced from: • 3 dams
• 4 bore fields • 8 stream intakes
• 36 treated water reservoirs • 333kms of water mains • 18 booster pump stations • 9,859 connected properties
Map 1. Shows where in the district Council provides potable water
The network contains approximately 120kms of asbestos cement (AC) pipes (36% of the network), which were laid in 1950-1970’s. This material has a life of about 50 years. It is expected that these pipes will need to be renewed over the next 30 years. The remainder of the network has been constructed from modern materials that have a longer life. These pipes are not expected to require significant replacement for another 30 - 50 years. The total value of water assets is $110,499,757.49. The value for groups of assets can be found in Appendix 2.
Water Supply Infrastructure Assets
Pipes Valves, hydrants Pump stations Tanks, dams Estimated asset life 50 – 100yrs 50 - 70yrs 10 – 50yrs 40 – 80yrs
30 YEAR INFRASTRUCTURE STRATEGY (2015-45)
L O N G T E R M P L A N 2 0 1 5 - 2 5
Wastewater
• 19 communities serviced with wastewater
• 16 wastewater treatment plants (11 pond systems, 5 mechanical plants) • 392 km of sewer pipe
• 149 pumping stations • 10,998 connected properties
Map 2. The location of Council’s 18 wastewater systems.
The network contains approximately 100km of asbestos cement (AC) pipes (34% of the network), which were laid in 1950-1970’s. This material has a life of about 50 years. It is expected that these pipes will need to be renewed over the next 30 years. The total value of water assets is $171,396,792.15. The value for groups of assets can be found in Appendix 2.
Wastewater Infrastructure Assets
Pipes Manholes Treatment plants
Estimated asset life 40 - 100yrs 80yrs 15 – 50yrs
30 YEAR INFRASTRUCTURE STRATEGY (2015-45)
L O N G T E R M P L A N 2 0 1 5 - 2 5
Stormwater
• 126 km of pipes
• 39.4 km of lined and unlined channels • 2,884 manholes
• 18 retention dams • 50 floodgates
• 1901 inlets and outlets • 1 pump station.
Typically stormwater pipes have a longer life than water and sewer pipes. While routine maintenance is a planned activity, the replacement of stormwater assets is largely reactive. Therefore, over the life of this strategy, there is generally a relatively low-level stormwater renewals programme. However, to date, Council has invested very little in stormwater reticulation replacement, and Council will need to commence a modest stormwater replacement programme during the next 30-year period. The total value of stormwater assets is $66,253,781.83. The value for groups of assets can be found in Appendix 2.
Stormwater Infrastructure Assets
Pipes Manholes
Estimated asset life 40 - 120yrs 100yrs
30 YEAR INFRASTRUCTURE STRATEGY (2015-45)
L O N G T E R M P L A N 2 0 1 5 - 2 5
Roading
• 891 km of sealed roads • 1,651 kms of unsealed roads • 716 bridges and culverts • 1619 streetlights
• 637 minor structures • 1 Ferry – Kohu Ra Tuarua • 7 inactive quarries
• 183.1 kms of concrete footpath
The wear and tear from heavy traffic requires that Council periodically rebuilds sections of road. Council expects that significant harvesting of pine forests will continue to occur. This will result in significant additional heavy traffic on rural roads during that period, which in turn will require an increased programme of road renewals. General pavement renewals programmes are developed from physical condition assessments carried out annually, while bridge replacement and maintenance programmes follow a rolling programme of formal inspections. The total value of roading assets is $1,580,466,889.52. The value for groups of assets can be found in Appendix 2.
Roading Infrastructure Assets
Top surface (seal) Pavement (base course) – sealed Culverts, cesspits
Footpaths Kerbs Street lights Signs Bridges
Estimated asset life 5 - 50yrs 35yrs 15 - 100yrs 25 - 60yrs 50 – 80yrs 8 - 60yrs 10 - 15yrs 50 - 100yrs
30 YEAR INFRASTRUCTURE STRATEGY (2015-45)
L O N G T E R M P L A N 2 0 1 5 - 2 5
Completion of the Twin Coast Cycle Trail
While not mandatory for the Infrastructure Strategy, this important proposed project is included as there is considerable public interest. The Far North District Council is applying to Central Government for further funding to complete the Twin Coast Cycle Trail, which is part of the nationwide New Zealand Cycle Trail (NZCT) initiative. Isolated sections of cycle trail have been completed and three unconnected sections of the trail are currently open to the public. The date of 31 December 2015 is the proposed completion date for the construction of the remaining sections (excluding the permanent Opua to Kawakawa section). Timing for securing the permanent route from Opua to Kawakawa extends through to 2017 to accommodate the Bay of Islands Vintage Rail Trust, as the Trust gradually takes back the rail corridor.
Council has begun a process to form an independent legal entity, which will take over the operation of the completed cycle trail, including running events and maintenance. Also, this entity will be able to seek funding outside of Council from such organisations as Foundation North (formerly known as the ASB Trust) and Lotteries, etc. The ability to raise funds from the operation of the trail, as well as through funding applications will reduce the ongoing burden on rates reliance.
Community Facilities
Community Pools
While not mandatory for the Infrastructure Strategy, this important proposed project is included as there is considerable public interest. One of the principles of the draft aquatic strategy is that new pools need to be affordable for ratepayers. Another is that development of new pools must be led by the community. To achieve these, Council has proposed that communities will need to contribute a minimum of 66% of the capital costs through local fundraising, sponsorship, grants, or contributions from philanthropic agencies. Council may borrow up to 33% of the capital cost of a new pool and will fund this from a differential targeted rate based on both the location of the property and its use. This approach recognises that residential properties and properties located close to new pools would benefit most. The community contribution is significant and will be reliant on the success of grant applications. There are limited funders that will consider significant projects such as swimming pools. Often applications to these organisations are accepted once per year and this lead-in period will need to be factored into any timeframe. Potential funders will also want to see the level of Council support for these community-led projects before they commit.
In recognition of the need for Council support in order to increase the success of grant applications, and the lead time required by the community to secure their share, it is proposed that any differential targeted rate required to fund Council’s loan will be levied no earlier than in year 4 (2018/2019) of the 2015 - 2025 Long Term Plan for the Kaitaia pool.
Council’s community development and infrastructure staff will continue to work with the Mid-North Aquatic and Fitness Facility and the community group in Kaikohe on their proposals and options prior to the development of the 2018-2028 Long Term Plan.
30 YEAR INFRASTRUCTURE STRATEGY (2015-45)
L O N G T E R M P L A N 2 0 1 5 - 2 5
When should Council invest in improving the existing service?
Generally, Council intends to maintain reasonable levels of service to ensure affordability. There are four reasons why the council would improve existing infrastructure services. These are responding to:
• rising environmental and regulatory expectations/requirements; • climate change;
• catch-up of capital deferrals; and • demand (growth and levels of service).
Environment & Regulatory Expectations
The main areas in which this is likely to affect council are:
• Upgrades required at Kerikeri and Paihia wastewater treatment plants to meet consented effluent discharge quality limits;
• Increasing quality standards for the discharge of wastewater from all Council’s treatment plants, in response to resource consent renewals and compliance with the National Policy Statement on Freshwater Management under the Resource Management Act (particularly Kaikohe, Kohukohu, and Whatuwhiwhi, where the consents will be renewed and upgrades required in the next 10 years);
• Response to sewage reticulation overflows due to excessive wet weather inflow and infiltration in Kaitaia, and other systems, subject to further investigations;
• Public health concerns over the provision of adequate community drinking water supplies for Omanaia and Te Kao; and • Public health concerns arising as a result of dust from the unsealed road network
Assumption
Due to continually increasing quality and environmental standards, Council’s resource consents will be in line with the quality requirement at the time of renewals.
Environmental Hazards
The Ministry for the Environment suggests that Councils plan for a sea level rise of between 0.5m and 0.8m for periods up until 2090, due to the impact of climate change. Sea level rise may generate additional flooding around the mouths of rivers and coastal flat land that occurs in many of our inner harbours and coastal bays, unless steps are taken to manage that risk.
30 YEAR INFRASTRUCTURE STRATEGY (2015-45)
L O N G T E R M P L A N 2 0 1 5 - 2 5
Climate change is likely to result in more extreme storm and drought events. More frequent storms require Council to consider the level of flood protection and the capacity of the district’s stormwater drainage system. Increased frequency and severity of flooding and landslides will cause increased frequency of damage to the roading networks, with associated requirements for repairs and replacement.
More frequent droughts may affect the security of water supply to Kaitaia and other stream based water sources, such as those in the Hokianga. Currently, for Kaitaia, Council relies on adequate water flows from the Awanui River and has some stored water at Kauri Dam for supplemental supply, but typically, the same drought conditions result in a toxic algal bloom that makes this reservoir unusable for household consumption. Council, within this infrastructure strategy and the LTP, has committed funding to new water sources for Hokianga and Kaitaia. Assumption
The rate of climate change and its associated climatic and natural hazard conditions (i.e. that the Far North will become warmer, experience higher winds, more intense and more frequent severe weather events, droughts, flooding and sea level rise) will be in line with climate change predictions by the Ministry for the Environment, which are consistent with the advice given by the International Panel on Climate Change and the National Institute of Water and Air. The timing of changes that will have a significant effect on our operations are not within the immediate ten year period.
Catch-up - Getting Back to Delivery
Council is emerging from a very lean spending period when we responded to the Global Financial Crisis (and lower than predicted growth in the district) by taking strong action to tackle and restrict further debt and keep rates low. Generally, all capital expenditure is initially funded by debt and our focus on paying down debt means Council did not proceed with many previously planned infrastructure projects and looked for lower or lowest cost solutions to the issues of the day. This impacted not only on new infrastructure projects but also on the maintenance of existing assets and services. In conjunction, Council cut back on staff and other operational spend to ensure rates rises were as low as possible.
Demand - Council Capacity Gap
Increased resourcing for areas such as strategic planning, asset and project management will enable Council to address the backlog of capital investment needs, and to ensure that the right solutions are delivered at the right time.
Improvements in strategic planning will assist decision makers to ensure capital investment is aligned with Council’s strategic objectives and outcomes. Improved asset management systems and processes will assist in developing accurate programmes of maintenance, asset renewals and new capital expenditure, based on real time asset condition assessment.
30 YEAR INFRASTRUCTURE STRATEGY (2015-45)
L O N G T E R M P L A N 2 0 1 5 - 2 5
Process improvements planned over the next 3-year period will result in significant benefits for development of the 2018 - 2028 Long Term Plan and the updating of the 30-Year Infrastructure Strategy.
Demand – Infrastructure Gap
In terms of demand for infrastructure, the main determinant of demand for reticulation is the growth in the number of households. Demand is influenced by population numbers, consumption drivers (such as changes in appliance use and conservation) and changes in business use. Business use is not a significant factor in the Far North, except in Kaitaia, where seasonal drought occurs regularly and may disrupt the level of service to keep the Tri-board Mill fully operational. Otherwise, unless new businesses establish in the district, demand will be mostly driven by the residential population. Additionally, residents and communities of residents in the area of benefit around the assets and wastewater schemes may want a higher level of service and are willing to either pay or accept a lower level of service on other district facilities to compensate.
Demand by the forestry industry had been forecast to have a significant impact on the roading network, with a need for additional maintenance, renewal and upgrade works. As this trend is expected to continue over the next 30 years, Council has included additional budget for targeted maintenance and renewal of logging routes.
Assumption
No more than 50 new lots (the current level of subdivision) will be created each year across the district, as a result of subdivision activity. Building activity will remain at a fairly constant level, with approximately 60 new dwellings being constructed each year within the district.
Seasonal Demand
The seasonal impact of visitors to the district’s coastal areas places demands on systems far beyond those needed by the usually resident population.
Projections indicate that drinking water supplies and waste water treatment at Kerikeri and Paihia will be impacted by seasonal demand, such that upgrades to these schemes will be required within the next 20 years.
Assumption
The number of visitors to, or staying within, most of the district will continue to decline except for Kerikeri and Paihia, which will continue to increase and therefore significant new demand will be made on existing water and waste water infrastructure.
30 YEAR INFRASTRUCTURE STRATEGY (2015-45)
L O N G T E R M P L A N 2 0 1 5 - 2 5
Growth
Future Population
Although net population increase is readily associated by most people as being ‘growth’ or a decrease is conversely ‘decline’, other land and building development factors also have a bearing. Growth is a function of:
9,859 connected properties Net population increase (including inward and outward migration); • Changes in the structure of the population;
• Changes in the composition of households;
• Increases or changes in the style or character of business activity;
• Seasonal fluctuations in areas that attract high numbers of visitors and have a significant proportion of holiday homes and visitor accommodation; and
• Further subdivision of landholdings.
Growth in the Far North District has typically been acknowledged to sit between the Statistics New Zealand low and medium growth population projections. However, the district’s usually resident population remained static for the period between the 2006 Census and the 2013 census. Under the Statistics New Zealand medium growth population projections, the Far North district’s usually resident population is expected to grow steadily to 60,000 in the next 20 years. However, the modelling shows (see graph below) that if growth is low, then there will be a continued slight decline.
30 YEAR INFRASTRUCTURE STRATEGY (2015-45)
L O N G T E R M P L A N 2 0 1 5 - 2 5
The Far North Council has determined that for the first 3 years of this strategy and the 2015-2025 Long Term Plan, growth will continue to decline at a rate of approximately 0.02% per annum.
30 YEAR INFRASTRUCTURE STRATEGY (2015-45)
L O N G T E R M P L A N 2 0 1 5 - 2 5 Assumption
Change in the usually resident population will continue to be uneven across the district. While some Eastern coastal communities will see growth of between 0.05% and 2% per annum, most townships will continue to experience a decline in Usually Resident Population (at a rate of between -ve0.02 to -ve2% p.a.). The settlement areas which will see continued slow to moderate growth (of between 0.2 – 1.6% p.a.) in URP are:
• the Bay of Islands Resorts’ towns (comprising Russell, Opua, Paihia, Waitangi, Haruru Falls), along with the accessible coastal areas within the Pokere-Waihaha Census Area Unit (CAU);
• the accessible coastal areas of the Eastern Ward;
• the Kerikeri and Waipapa townships (servicing the horticultural sector, rural-residential and coastal living across the greater Kerikeri area, Kapiro, Waipapa, and the Waihau Valley-Hupara CAUs), along with continued usually resident population and investment growth within the rural-residential zoned areas within the CAUs;
• Within the Te Hiku Ward, along the Eastern seaboard around Doubtless Bay, Mangonui Harbour and the Karikari Peninsular; and • On the West coast at Ahipara.
30 YEAR INFRASTRUCTURE STRATEGY (2015-45)
L O N G T E R M P L A N 2 0 1 5 - 2 5
Other Assumptions
Management of Council Assets
For the most part, Council currently outsources the delivery and maintenance of assets, whilst retaining the operation and management in-house. Council is not intending to change the way in which its assets are managed. However, there are three areas where significant change could occur:
• Divesting of Council assets, including options for possible disposal of community halls/hubs (subject to public consultation);
• A rating review in 2015/16, which could result in a change of ownership for some water schemes to improve affordability (as included in the LTP Consultation Document); and,
• Future investment in shared services, which could include joint management of services, outsourcing of joint services or setting up Council Controlled Organisations (CCO) to manage services, in collaboration with other Councils or organisations in the region.
Inflation
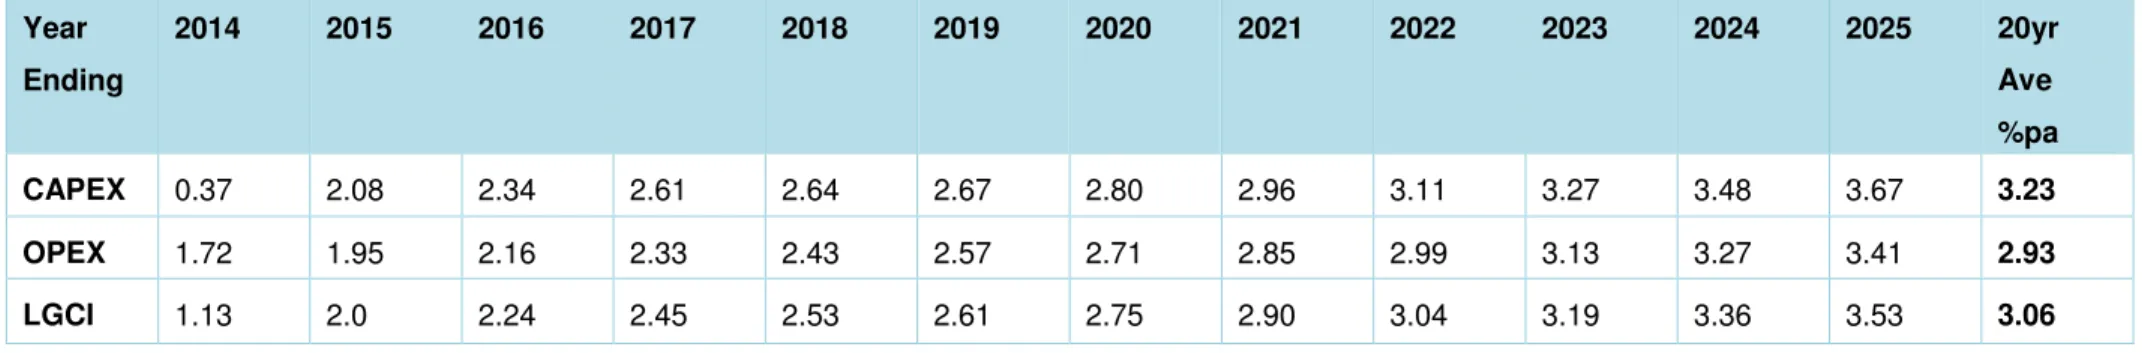
The Consumer Price Index (CPI) as the factor representing annual cost changes is well known to the public, the CPI for price changes does not reflect accurately or appropriately the price change movements experienced by Council (for the types of goods it procures). The CPI is a consumer-level measure and is defined by Statistics New Zealand as meaning, "the changing price of a fixed basket of goods and services purchased by New Zealand households. The selection and relative importance of the goods and services in the CPI basket represents the overall expenditure pattern of New Zealand households". The main groups of goods in the CPI are: food, alcohol and tobacco, clothing and footwear, housing and household utilities.
Economic Research Limited (BERL) has, for a number of years, published an index called the Local Government Cost Index (LGCI) in conjunction with SOLGM and LGNZ. This index was developed explicitly for Councils to use in the development of their Long Term Plans. The index is therefore appropriate for use in this Infrastructure Strategy as it and the LTP must align.
30 YEAR INFRASTRUCTURE STRATEGY (2015-45)
L O N G T E R M P L A N 2 0 1 5 - 2 5 Year Ending 2014 2015 2016 2017 2018 2019 2020 2021 2022 2023 2024 2025 20yr Ave %pa CAPEX 0.37 2.08 2.34 2.61 2.64 2.67 2.80 2.96 3.11 3.27 3.48 3.67 3.23 OPEX 1.72 1.95 2.16 2.33 2.43 2.57 2.71 2.85 2.99 3.13 3.27 3.41 2.93 LGCI 1.13 2.0 2.24 2.45 2.53 2.61 2.75 2.90 3.04 3.19 3.36 3.53 3.06Table 1. Local Government Cost Index, Average annual % change – baseline year June 2014
The index has nine categories: roading and transport, property, reserves and parks, water, staff, energy, pipeline, earthmoving, private sector wage costs. Council uses the LGCI to inflate its costs for future years in the ten year plan forecasts. Financial forecasts for the first 10 years of this strategy (until June 2025) are adjusted for projected inflation based on the BERL local government cost index as shown in Table.1 above. The financial forecasts for years 11 to 30 have been inflated using 3.06%, the 20-year average.
Inflation assumed to be at 2% for NZTA funded works for the next 3 years due to the reduction in the oil price.
Strategic Financial Context
Council’s Financial Strategy 2015-2015 discusses the context in further detail. In summary, Council must plan its expenditure in a way that is sustainable to ensure that the istrict will have the capacity and resources available to deliver affordable services to our residents and ratepayers in the medium and long term.
Council’s financial strategy for infrastructure is to:
• Maintain (including replace or renew) the existing infrastructure assets where it is reasonable and economic to do so;
• Maintain the existing core services as efficiently as possible (many of these are essential services and legislatively required);
• Aim to limit the borrowing attached to new capital works (excluding the heated, indoor pools programme) to an average of $10m per year to ensure affordability and deliverability of the programme;
30 YEAR INFRASTRUCTURE STRATEGY (2015-45)
L O N G T E R M P L A N 2 0 1 5 - 2 5 • Prioritise capital projects based on an objective assessment against key decision criteria.
Our overall approach to funding is that Council funds approximately 85% of operating costs from rates, with the balance funded from other sources such as subsidies (from Government agencies such as the New Zealand Transport Agency) and user fees and charges.
• To ensure that the users of the district’s assets pay their fair share. Council uses depreciation (which is operating expenditure) to fund renewals;, and
• Council uses borrowing to spread the cost of new capital expenditure over a longer period; • Council will review our complete set of rating policies in the 2015/16 financial year, and • Council will place affordability limits on rates and rates increases.
Levels of Service
Levels of service are the service outputs for a particular activity or service area, against which performance can be measured. Generally, Council’s aim is to maintain reasonable levels of service that are affordable for our communities.
We will only increase levels of service when dictated by: • regulation;
• demand due to population growth (seasonal or permanent);
• a communities’ willingness to pay for a higher level of service (current proposed projects funded on this basis are explicit in the LTP Consultation Document);
• a communities’ willingness to accept a lower level of service in order to achieve a higher level of service elsewhere (funding does not change); or
• the availability of externally-sourced funds.
Level of service impacts for key projects are summarised in Table 2 Summary of capital expenditure options and Table 3 Future Capital Projects. Further details on levels of service associated within specific activity areas and assets are outlined in the relevant Activity Statements and Asset Management Plans.
30 YEAR INFRASTRUCTURE STRATEGY (2015-45)
L O N G T E R M P L A N 2 0 1 5 - 2 5
For the full set of Council Planning Assumptions, including impact on levels of service, relevant to the preparation of this strategy and for the management of our infrastructural assets, refer to Appendix 1.
Most likely scenario
The following timeline shows the most likely scenario for Council’s infrastructure investment. A feature of this scenario is that infrastructure investment in the first decade covered by this plan requires significant investment due to:
• the need to increase expenditure to replace aging reticulation; including deferred work; • the need to increase standards of sewage treatment as resource consents expire; and
• the need to expand the capacity of existing infrastructure to meet the needs of a growing population.
30 YEAR INFRASTRUCTURE STRATEGY (2015-45)
L O N G T E R M P L A N 2 0 1 5 - 2 5
Most likely scenario – major projects timeline
LTP first 3 Year’s funding LTP 10 Year funding
2015 2016 2017 2018 2019 2020 2021 2022 2023 2024 2025 2030 3035 3040 2045
Cycle Trail Completion
(Incl Permanent Opua section)
South Hokianga Water Supply Opononi/Omapere +
Rawene/Omanaia Forestry Road Repairs
& Renewals Te Kao Water Supply Road Resilience Emergency Repairs Road Resilience Repairs & Renewals
Kaitaia Water Supply Paihia Water
Supply
Kaikohe Wastewater Upgrade
Bay of Islands Wastewater – Riverview, Reinga and Waipapa
Whatuwhiwhi Wastewater Upgrade
Whangaroa Wastewater
Kerikeri Water Supply Replacement Hokianga Ferry
Community Pools Kaitaia + Kaikohe + Kerikeri
Bay of Islands Wastewater Treatment Project
Kaitaia Wastewater Reticulation
30 YEAR INFRASTRUCTURE STRATEGY (2015-45)
L O N G T E R M P L A N 2 0 1 5 - 2 5
What will it cost?
Cost of most likely scenario
The following graph shows the annual capital and operating costs of the most likely scenario. Details of the first 10 years’ expenses for each infrastructure activity are shown in the funding impact statements for those services. The graph shows each of the first ten years and annual average expenditure for the next twenty years in five year blocks. The finances for each individual year in the five yearly blocks were developed and then aggregated. The graph does not include funding for Community Pools as there is a requirement for communities to raise 66%. The funding will be included in the final LTP document, based on the Consultation Document outcome.
Expenditure has been inflated. From the graph, it can be seen that operating costs are expected to rise in line with inflation, significant capital spend on core infrastructure will take place in the first 5 years, and the renewals programmed, which includes deferred renewals, has been smoothed out over the 30 year period.
0 50,000 100,000 150,000 200,000 $ 0 0 0 's
Annual operating and capital expenditure required for
the infrastructure strategy
Renewal capital costs New capital costs operating costs
30 YEAR INFRASTRUCTURE STRATEGY (2015-45)
L O N G T E R M P L A N 2 0 1 5 - 2 5
Depreciation is used to fund the renewals programme
Council funds (or recovers the expense of) depreciation through rates. The depreciation charge is made at a rate that spreads the cost of the asset being depreciated over its useful life. Council maintains their assets on an annual basis and periodically renews the assets that make up the component parts of the larger systems so that, generally, the asset is kept in a condition to provide the required level of service over the long term. Over the lifetime of our assets, the amount of depreciation charged and the value of the renewals programme should be equal. Council has identified that over the last seven years there is a discrepancy between depreciation funded of around $85m and actual renewals of $49m. In aggregate the difference is around $36m.
0 2,000 4,000 6,000 8,000 10,000 12,000 14,000 16,000 2008 2009 2010 2011 2012 2013 2014 $ M il li o n s
Historical depreciation -v- renewals
Depreciation funded Actual renewals
30 YEAR INFRASTRUCTURE STRATEGY (2015-45)
L O N G T E R M P L A N 2 0 1 5 - 2 5
There are a number of reasons for this. Firstly, the useful life of many asset components (e.g. underground pipes and bridges) is very long and renewal of those components did not fall due within the 6 year period just past. Secondly, renewals can be deferred in the short-term, to reduce capital expenditure in particularly uncertain times, such as the global financial crisis. This deferral of renewal work requires a catch-up over the medium term to restore on-going levels of service. Thirdly, depreciation is collected evenly over the useful life of each asset. Renewal work does not happen in the same even spread – the nature of renewals is that the expenditure is “spikey” and it is only over the very long-term that equality between depreciation and renewal expenditure will be seen. All of these factors contribute to the “gap” identified above.
The renewal programme is driven by the Asset Management Plans prepared for each asset. In this Strategy, Council is responding to the deferral of renewals and is spending depreciation funds received on work identified in the AMP as shown in the graph below. This is the catch-up identified in reason two above. The on-going “gap” in some years is caused by reasons one and three described above.
0 5,000 10,000 15,000 20,000 25,000 30,000 35,000 40,000 45,000 50,000 2016 2017 2018 2019 2020 2021 2022 2023 2024 2025 2030 2035 2040 2045 $ M il li o n s
Depreciation -v- renewals
Depreciation funded Actual renewals30 YEAR INFRASTRUCTURE STRATEGY (2015-45)
L O N G T E R M P L A N 2 0 1 5 - 2 5
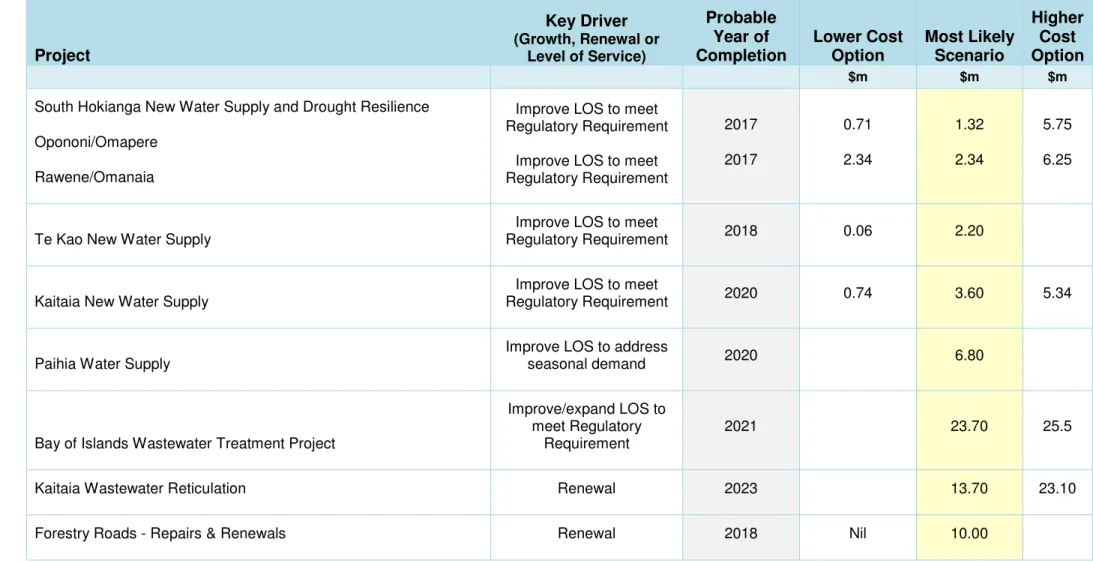
Cost implications of significant capital expenditure decisions
There are a number of significant capital expenditure decisions that could affect those costs. These are summarised in Table 2. Table 2: Summary of capital expenditure options
Project Key Driver (Growth, Renewal or Level of Service) Probable Year of Completion Lower Cost Option Most Likely Scenario Higher Cost Option $m $m $m
South Hokianga New Water Supply and Drought Resilience Opononi/Omapere
Rawene/Omanaia
Improve LOS to meet Regulatory Requirement
Improve LOS to meet Regulatory Requirement 2017 2017 0.71 2.34 1.32 2.34 5.75 6.25
Te Kao New Water Supply
Improve LOS to meet
Regulatory Requirement 2018 0.06 2.20
Kaitaia New Water Supply
Improve LOS to meet
Regulatory Requirement 2020 0.74 3.60 5.34
Paihia Water Supply
Improve LOS to address
seasonal demand 2020 6.80
Bay of Islands Wastewater Treatment Project
Improve/expand LOS to meet Regulatory
Requirement
2021 23.70 25.5
Kaitaia Wastewater Reticulation Renewal 2023 13.70 23.10
30 YEAR INFRASTRUCTURE STRATEGY (2015-45)
L O N G T E R M P L A N 2 0 1 5 - 2 5 Project Key Driver (Growth, Renewal or Level of Service) Probable Year of Completion Lower Cost Option Most Likely Scenario Higher Cost Option $m $m $mRoad Resilience - Emergency Repairs Maintain LOS 2016 Nil 2.77 29
Road Resilience - Repairs & Renewals Maintain LOS 2018 Nil 6.91 18
Completion of the Twin Coast Cycle Trail
Improve LOS (external
funding contribution) 2017 3.61 3.9
Community Pools Kaitaia
Kaikohe Kerikeri
Improve LOS (external funding contribution) Improve LOS (external
funding contribution) Improve LOS (external
funding contribution) 2018 2020 2023 8.38 3.3 15.7
Introduction
For the projects above that fall within the 10 years of the Long Term Plan 2015-25, there is a preferred option set out in the draft Infrastructure Strategy and the Long Term Plan Consultation Document. This section has now been updated with the decisions and the funding levels determined by Council at Deliberations. The standalone Infrastructure Strategy set the context and options for inclusion within the Consultation Document. Therefore, Council considered these options including the preferred option, as well as community support and concerns via submissions, hearings and from 10 public meetings, when they confirmed the projects for the Long Term Plan 2015-25 at Deliberations on 9 June 2015.
30 YEAR INFRASTRUCTURE STRATEGY (2015-45)
L O N G T E R M P L A N 2 0 1 5 - 2 5
1. South Hokianga New Water Supply and Drought Resilience
Opononi/Omapere
The raw water for the Opononi/Omapere water supply is taken from the Waiarohia Stream (25%) and the Waiotemarama Stream (75%). Because the resource consent for the Waiotemarama Stream limits extraction to maintain a residual flow to sustain the streams ecology, over recent droughts, the volume extracted from the Waiotemarama has resulted in less than consented residual flow remaining in the stream. In 2019, the level of residual flow will be increased, exacerbating the situation. The change will result in insufficient water to maintain supply to the Opononi/Omapere consumers for several months from mid to late summer each year.
An initial assessment has been undertaken as to potential raw water sources. The key findings are:
• Raw water storage must be covered to prevent algae growth, which peaks late summer and can make the water unsuitable for treating to a potable standard. Covering to prevent algae growth substantially increases the cost;
• There are currently no known ground water bores in the area that have sufficient yield. What is unknown is the potential yield in the higher basalt zone. Without drilling a test bore it is not possible to predict whether sufficient ground water is available; and
• There are only two rivers, the Waimamaku and the Whirinaki, that have sufficient flow to enable extraction without an adverse environmental impact. Of these two, the Waimamaku costs less to develop.
The funded scenario in the LTP 2015-25
It is proposed to install a test bore to see if there is ground water available. If ground water is found, this cheaper option will be developed further. If not, a supplementary intake will be constructed on the Waimamaku River. Because of the risk of not finding ground water, the funding of $1.32m is based on the Waimamaku option. Council recognised there are significant issues for Iwi regarding this option and considers more work is required, so proposes to ensure that there is sufficient budget in the 2015-2025 Long Term Plan to allow further investigation. However, Council has retained funding levels, to a maximum of $1.32 million in the Long Term Plan 2015-25, to allow options for water supply to the Opononi-Omapere communities to be investigated, await the outcome of the Ministry of Health subsidy application, and continue to work with the local community.
Alternative:
Construct raw water storage (site to be determined). Raw water storage must be covered to prevent algae growth which peaks late summer and can make the water unsuitable for treating to a potable standard. Covering to prevent algae growth substantially increases the cost. Cost is estimated at $5.99m.
30 YEAR INFRASTRUCTURE STRATEGY (2015-45)
L O N G T E R M P L A N 2 0 1 5 - 2 5 Rawene/Omanaia
Between the raw water source and the water treatment plant in Rawene, there are approximately 59 homes (approximately 125 people) and a Marae that receive untreated water direct from the raw water main. The consumption of this raw water places those people at a high level of risk of contracting water borne diseases. The consumers receiving this untreated water have for a long time requested Council to rectify the situation by installing the necessary treatment and reticulation to provide them with potable water. Currently, Rawene has less than adequate treated water storage, making it more vulnerable to water shortages through mains breaks, plant failure, or drought situation. Most options include additional 500 m3 treated water storage. Water treatment options are:
Potable water
Option Description Investigation Capital estimate Operational cost
1
Decommission the existing water treatment plant and build a new water treatment plant (using membrane filtration) near the intake thereby using the existing raw water main to provide potable water. Includes 500 m3 reservoir
$200,000 $3,360,000 No change from existing
2 Pipe treated water to Omanaia from the existing water
treatment plant plus 500m3 reservoir $80,000 $2,670,000 Additional $4,000 p.a.
3
Rawene raw water sourced from Whirinaki with a new water treatment plant near the existing raw water source
for Omanaia. Includes 500m3 reservoir
$200,000 $3,580,000 Additional $20,000 p.a.
4
Supply Omanaia and Rawene with treated water from a new treatment plant (using conventional treatment) that would be built next to the current intake at Petaka Stream. The existing Rawene Water Treatment Plant at De Thierry Street would be decommissioned. A 500m3 raw water storage and 300m3 treated water storage reservoir would also be built to provide a modest level of drought resilience.
30 YEAR INFRASTRUCTURE STRATEGY (2015-45)
L O N G T E R M P L A N 2 0 1 5 - 2 5 Potable water
Option Description Investigation Capital estimate Operational cost
Drought Resilience
Option Description Investigation Capital estimate Operational cost
1
Raw water storage near intake
(Could apply to treatment options 1,2 and 4) $150,000 $2,890,000 Additional $10,000 p.a.
2
Raw water storage near Rawene Rd
(Could apply to treatment options 1,2 and 4) $150,000 $2,300,000 Additional $10,000 p.a.
3
Pumped supply from Waima River including raw water storage tank to maximise the existing source
(Could apply to treatment options 1,2 and 4)
$60,000 $1,120,000 Additional $10,000 p.a.
4
Storage tank to maximise the existing source and enable trucking of water. This concept is viable up to around a 1:20 year drought.
(Could apply to treatment option 1 and 2 only)
$50,000 $ 370,000 $10,000 p.a. Additional
Recent droughts have shown the Rawene supply will run short of water for any drought greater than a 1 in 5 year drought. Various options for drought resilience have been evaluated, of which, the following four are considered the most viable.
The potable water funded scenario in the LTP 2015-25
To pipe treated water to Omanaia and Rawene from a new water treatment plant and additionally build a 500m3 raw water reservoir and a 300m3 treated water storage reservoir at a cost of $1.97m (Treatment option 4). Council considered that more work is required and looked to ensure that there is sufficient budget in the Long Term Plan 2015-2025 to enable further investigation into the best option to resolve this issue. Therefore, Council confirmed retaining funding levels of $1.97 million, as per Option 4 (Rawene-Omanaia - Planning for Potable Water) in the Long Term Plan 2015-2025, and will await the outcome of Ministry of Health subsidy application, and continue to work with the local community.
30 YEAR INFRASTRUCTURE STRATEGY (2015-45)
L O N G T E R M P L A N 2 0 1 5 - 2 5 The Drought Resilience funded scenario in the LTP 2015-2025
Council proposed to provide additional drought resilience, construct a pumped supply from Waima River and raw water storage tank at a cost of $1.12m (Drought resilience option 3). Council, after listening to the community about affordability, decided to change from the preferred Option 3 to Option 4 (build a storage tank and truck in water during droughts) and set the funding at $370,000 in the LTP 2015-25.
Alternatives
Alternatives are as described in the above table.
2. Te Kao New Water Supply
Te Kao currently has a water scheme supplying approximately 65 homes and 3 farms. The water scheme was divested by Council to a private provider in 2002. Since then, water quality has struggled to meet drinking water standards for a number of reasons including poor raw water quality and ineffective treatment. The water is sourced from Lake Wahakari. Council is currently working with the local community via the Te Aupouri Māori Trust board to identify options for improving the water quality to drinking water standards. To date, work has focused on finding
alternative, better quality, and more secure sources.
This work is ongoing and Council has submitted a funding application for improvement to the Ministry of Health (MOH) in February 2015. If the funding application is successful, it will enable Council to proceed in either improving the existing scheme, developing a replacement scheme or a combination of both, subject to agreement with the current scheme provider. Current Options are:
Option 1 – Do Nothing
Advantages Disadvantages
Relative low cost to community Water quality remains below drinking water standards, resulting in health
and safety risks.
30 YEAR INFRASTRUCTURE STRATEGY (2015-45)
L O N G T E R M P L A N 2 0 1 5 - 2 5 Option 2 – Investigate/implement options for improving water quality to drinking water standard
Advantages Disadvantages
Water quality improves to comply with drinking water standards Council’s current scheme-based, targeted rating may impact on
affordability for the local community Potential MOH Subsidies available (final funding round February 2015)
Removes current health risks to community
The funded scenario in the LTP 2015-25
1. To continue to look for alternative and better water sources
2. Design an appropriate scheme that may or may not include existing infrastructure
3. Apply for funding to support infrastructure development to preserve options and reduce costs
4. Continue to work with Te Aupouri Māori Trust Board in partnership to provide drinking water to the community
5. Ultimately assist in an appropriate way to provide the Te Kao community with safe, sustainable and affordable drinking water. The current estimate by Council is that it will cost $2.2m to source, treat and supply existing users, and allow for future demand increases. Council has included this cost estimate in our financial projections. It is hoped that most capital costs would be covered by a MOH subsidy, although the scheme’s owner would still need to charge depreciation costs on the asset. Council will continue to work with the Te Kao community and Te Aupouri Maori Trust Board to ensure that the residual cost to the community is affordable. Appropriate alternative water supply options will sourced, be costed, compared and discussed with the community before final decisions are made. Council confirmed retaining funding levels of $2.2 million, as per Option 2 in the 2015-2025 Long Term Plan, and that it would await the outcome of the Ministry of Health subsidy application and continue to work with the local community to progress the Te Kao scheme.
Alternative:
Ownership and management of the scheme remains under the private provider. The MOH would work with the private provider to ensure water quality was of potable standard. The community has tried to gain a subsidy from the MOH but was declined. However, the community could still put together another proposal to take over the scheme.
30 YEAR INFRASTRUCTURE STRATEGY (2015-45)
L O N G T E R M P L A N 2 0 1 5 - 2 5
3. Kaitaia New Water Supply
Council draws water from 3 sources (Awanui River, Kauri Dam and Okahu Stream) for the Kaitaia community. However, the system struggles to cope with daily demand in dry summers when flows in the main source, the Awanui River, drop and algal blooms make water in the dam unsuitable for use. River flows at the water supply intake dropped to below permitted levels during dry weather in 2010 forcing us to restrict the use of water in Kaitaia for 111 days. It also put new pressure on us to investigate alternative water sources for the town which uses, on average, 2,640 cubic-metres of water a day, of which nearly a quarter (623 m3) is used by Juken New Zealand Ltd at its timber plant. Council has already ruled out the Kauri Dam as a viable long-term water source and the Okahu Stream is too small to serve as a primary source, so have been investigating the Aupouri Aquifer as a possible source. A private company offered to supply aquifer water from bores in the Sweetwater area shortly after the 2010 drought. The company undertook to supply water from the aquifer to our treatment plant in Kaitaia and agreed to install and finance the required infrastructure, including pumps and pipes. Council was to obtain a resource consent to take water from the aquifer. Council did this, and in 2012, the Northland Regional Council granted a consent allowing 5,000 cubic metres of water to be drawn each day from no more than two bores at the aquifer. The company, SWEETH20, drilled and developed one production bore and several monitoring bores. Work on the new water source proceeded until it became clear that agreement could not be reached on certain aspects of the project. The then Council purchased the assets and interests of the company with a view to developing the water source itself. However, the Council that was elected in 2014 is investigating all water sources in the Kaitaia area, including a source offered by Te Runanga o Te Rarawa, before committing further funds to the project, which has been put on hold pending the outcome of this investigation.
The funded scenario in the LTP 2015-25
Draw aquifer water from the SWEETH20 bores at Sweetwater. Estimated capital cost is $3.6m. There are unresolved issues with some components of the current system relating to subdivision and land acquisition. A Kaitaia water options study is being progressed and addressing the Kaitaia water source has been scheduled for Year 4 of the Plan by ensuring there is adequate budget in the 2015-2025 Long Term Plan for further investigation, feasibility and business case preparation of alternative water sources Therefore, Council has confirmed funding of $3.6 million for Kaitaia water in the 2015-2025 Long Term Plan, to provide for a solution that will be subject to further investigation, feasibility and business case sign-off, and subsequent approval by Council.
Alternative:
Keep drawing water from the Awanui River, but invest in plant upgrades that improve supply security. Estimated capital cost is $735,000; or Draw Aupouri Aquifer water from three other bores about 1km apart in the Kaitaia area. Estimated capital cost is $3.73m.
30 YEAR INFRASTRUCTURE STRATEGY (2015-45)
L O N G T E R M P L A N 2 0 1 5 - 2 5
4. Paihia Water Supply
The Paihia water treatment plant is located next to the Waitangi River adjacent to the Haruru Bridge. When the water in the river becomes turbid, the capacity of the water treatment reduces significantly; and when the river is very turbid, it is unable to treat water. If the turbid river water coincides with high demands, then the water treatment plant cannot treat enough water to meet demand. The risk of water shortage occurs most summers and during 2014, occurred twice outside the peak summer period.
The other risk associated with this site is that the intake is now downstream of an urban area, thus increasing risk of pollutants entering the water treatment process. The plant building is located on a flood plain with a 1:50 year flood estimated to reach the roof level of the treatment plant building. If flooding of the electrical equipment did occur, there is likely to be a medium to long term loss of potable water.
Funding to rectify this critical issue has been placed into the LTP, but initially, further investigation work is required. The investigation will consider:
• Availability of suitable land;
• Untreated and treated water storage requirements; • Flood zones and other hazards;
• Distance from existing reticulation; and • Proximity to development.
The funded scenario in the LTP 2015-25
A new Water Treatment Plant with additional water storage. Estimated capital cost is $6.8m. Council has confirmed funding of $6.8 million in the 2015-2025 Long Term Plan for the development of a new water source and treatment plant for Paihia.
Alternative:
Continue with the status quo and develop contingency plans to manage the risks. Develop additional treated water storage to increase resilience. Estimated capital costs are $2.5m; or develop raw water storage only and maintain the existing treatment plant. Estimated capital cost $2.0m.
30 YEAR INFRASTRUCTURE STRATEGY (2015-45)
L O N G T E R M P L A N 2 0 1 5 - 2 5
5. Bay of Islands Wastewater Treatment Project
The purpose of Bay of Islands Wastewater Treatment Project was originally prepared to extend the sewage reticulation for Kerikeri to encourage intensification and growth; to reduce reliance on old onsite disposal systems such as septic tanks; and to address failing wastewater treatment plants at Kerikeri and Paihia. Kerikeri is the main area that has continued to grow slightly, despite growth remaining static across the district. However, the unprecedented growth prior to the recession has not continued. The current treatment plant cannot accommodate further connections and some development close to the reticulation network has not been connected.
The funded scenarios in the LTP 2015-25
Paihia wastewater treatment plant
A new Resource Consent for Paihia WWTP was awarded in August 2014, and to comply with the new discharge consent requirements, an extra treatment stage, a Submerged Aerated Filter (SAF), will be required to treat effluent from the ponds. This has been developed to preliminary design stage and has been conservatively estimated as costing $3.2m. Council has funded $3.2 million for the Paihia WWTP as part of a total funding package for Kerikeri and Paihia.
Kerikeri wastewater treatment plant
The resource consent for Kerikeri wastewater treatment plant expires in 2015, and an application for a replacement consent was submitted in December 2014. It is planned to construct a new treatment plant alongside the existing plant, on land already owned by Council. The old plant will then be decommissioned and demolished. The new plant will have a capacity of 1000 m3/day, compared with the current plant’s capacity of 570m3/d. This extra capacity will allow for the construction of the extended reticulation in central Kerikeri. The new plant will be designed to eliminate, as far as possible, any odour or noise issues, which are of concern in such an urban location. The new plant will be of modular construction to facilitate future expansion and increased flows. The cost of the new plant has been estimated at $9.27m. However, Council is still actively exploring cost-effective options for an alternative site outside of the township which, if pursued, could add an additional estimated $1.5m to the cost of this option.
A new, larger diameter treated effluent discharge main will also be required, and this has an estimated cost of $2.25m. The new main will follow the route of the existing mains to discharge at the same location in a wetland in the Waitangi Forest. The pipe route crosses private land before entering the forest. Easements will be required over the private land and permission from Land Information New Zealand will be required within the Waitangi Forest.
Total capital costs for the Bay of Islands Wastewater Project is $22.2m. Kerikeri reticulation $7.5m
30 YEAR INFRASTRUCTURE STRATEGY (2015-45)
L O N G T E R M P L A N 2 0 1 5 - 2 5 Kerikeri new effluent pipeline $2.25m
Paihia WWTP SAF upgrade $3.2m
While it is clear that ratepayers are telling Council they would prefer two separate schemes, Council is aware of a number of concerns, including meeting statutory requirements, impacting on those who live around the existing plant, and affordability. As a result, Council supports completing a Multi Criteria Cost-Benefit Analysis which will consider all available options as an important step in the process of developing a robust and defendable solution, which will be the subject of public consultation before a decision is made. Consequently, Council increased the funding by $1.5 million over the estimated $22.2 million (including the $3.2million for Paihia upgrade) to ensure that an out of town option could be considered as an option. Therefore Council confirmed increasing the funding in the Long Term Plan 2015-25 for Kerikeri Wastewater by $1.5 million, complete the Multi-Criteria Cost/Benefit Analysis, and then select the most appropriate option, which will be subject to further consultation with the affected parties and subsequent final approval by Council. Work will also continue on improvements to the Paihia Wastewater Treatment Plant.
Alternative:
The initial proposal estimated at $42m was to construct a new modern wastewater treatment plant at the site of the existing pond-based treatment system located in the Waitangi Forest and currently treating flows from the Paihia catchment. The new plant was to be sized to accommodate flows from Kerikeri and Paihia, which were experiencing significant growth prior to the global financial crisis. The project included construction of a transfer pumping station and delivery main to transfer sewage from Kerikeri to the new Paihia plant, the decommissioning of the existing Kerikeri plant, and the construction of new sewage reticulation to serve a substantial portion of the Kerikeri area, abandoning onsite disposal systems.
For comparison purposes, a smaller version of the original Bay of Islands principle of transferring the sewage from Kerikeri to a new treatment plant to be constructed at Paihia, but allowing for less growth, has been evaluated at the same time as the above option. The total cost of $25.5m has been estimated as follows:
Kerikeri reticulation $7.5m Transfer pumping station and pipeline $6.7m New treatment plant at Paihia $11.3m
6. Kaitaia Wastewater Reticulation
The bulk of the Kaitaia sewage system was installed in the late 50’s to early 60’s. Due to a combination of leakage through aging pipes and flows increasing through long term growth, as well as during rain events, the rainfall entering the wastewater sewers is resulting in untreated wastewater overflows occurring from the pipe network to the streams that run through Kaitaia. During a typical year, there are 30 to 40 untreated wastewater overflow events.