1
University Degree in Energy Engineering
Academic Year (2018-2019)
Bachelor Thesis
“Effect of renewable
energy-generation technologies on
electricity prices”
Daniel Ramón Revilla
Tutor
Julio Usaola García
Leganés, 2019
This work is licensed under Creative Commons Attribution – Non Commercial – Non Derivatives
III
ABSTRACT
The integration of renewable-generation technologies in the energy mix is crucial for the achievement of the goals settled regarding technological development, environmental sustainability, energy dependence and security of supply.
Favourable regulatory frameworks have been established in Spain during the last decades with the aim of encouraging the investment in renewable technologies. But, and moreover, further benefits are said to be achieved with high penetration rates of renewables into the electric markets. There is evidence supporting the fact that electricity prices are cheapened because of the participation of renewable generation plants in the Day-ahead Market of electricity.
Thus, the aim of this thesis has been devoted to study the implications renewable generation has on the prices of electricity and their respective impact on its sustainability. Simulations of the auction process carried out at the 2017 Daily Market of electricity were performed for two different scenarios regarding the energy mix: one such as that of 2017 and other identical to this, but with no renewable generation.
The results obtained confirmed the fact that renewables undersell electricity prices. For year 2017, the presence of renewable generation units in the Day-ahead Market of electricity cheapened final electricity prices by 7,5%. This is due to the fact that renewable generation units sell their energy at quasi-zero prices, as a result of their low opportunity costs compared with fuel-based generation technologies. However, the savings generated by this cheapening of prices could not cover all the regulated costs associated to the specific remuneration provided to renewable technologies. Still, it must not be forgotten that year 2017 in Spain was
extraordinarily bad regarding renewable generation, due to the poor production of hydraulic power stations, resulting from the severe droughts that took place during that year.
These results were compared with those published by APPA, an association of firms operating in the renewables sector, and several conclusions were drawn. The results of the simulations performed in this thesis under Simple Bidding conditions converged almost totally with those published in the report (97% similarity in prices and 100% in savings). Therefore, it was concluded that there was enough evidence to believe the figures published by APPA , regarding the prices cheapening and savings generated by renewables, might have been
computed under Simple Bidding conditions. These figures sized the prices reduction in the Day-ahead Market at 16,4% while the actual computed cheapening under Complex Conditions was of 12,1%.
As additional implementations, it would be interesting to extend the study period to the last ten years, so that trends regarding the cheapening of electricity prices due to renewables integration can be drafted and analysed. This way, further implications of renewables integration on the system’s costs and prospects could be outlined.
Keywords: Bids, Electricity Markets, Matching, Simulation, Prices, Bids, Auction, Savings, Cheapening
V
ACKNOWLEDGEMENTS
I would like to sincerely thank all the people I am surrounded of for their priceless support, comprehension and affection during the process of elaboration of this thesis, especially when difficult moments arose.
A particular mention is deserved to my parents, Federico and Beatriz, and my sister, María, for being the ones I owe everything to and for staying always by my side.
To my friends; Mauro, Joaquín, Íñigo and Héctor; for always having the sincerest and most meaningful words, for being always available when their company was needed, regardless the time and place.
To my tutor, Julio, for his disinterested and immediate help in the drafting, development and final crafting of these pages, together with all the lessons taught.
And, very specially, to my grandfather José Manuel, for being one of the most exceptional human beings I have been fortunate to share life with.
1
LIST OF FIGURES ... 3
LIST OF TABLES ... 5
1. INTRODUCTION ... 7
1.1. MOTIVATIONS AND CONTEXT ... 7
1.2. GOALS AND SCOPE ... 7
1.3. THESIS STRUCTURING AND PROCEDURE... 8
1.4. AVAILABLE MEANS AND SOFTWARE-BASED TOOLS EMPLOYED... 9
2. STATE-OF-ART OF RENEWABLE ENERGIES IN SPAIN ... 10
2.1. ENERGY MIX IN SPAIN IN 2017 ... 10
2.2. MAIN RENEWABLE TECHNOLOGIES ... 11
2.3. SPANISH REGULATORY FRAMEWORK ... 12
2.4. COSTS OF THE ELECTRICAL SYSTEM ... 14
2.4.1. Costs face-off: Regulated term in the electric bill ... 15
3. IBERIAN ELECTRICITY MARKET (MIBEL)... 18
3.1. OPERATORS AND MARKETS ... 18
3.2. AGENTS ... 19
4. DAILY MARKET ... 20
4.1. BIDS SUBMISSION ... 20
4.2. MATCHING ... 21
4.3. MERIT-ORDER EFFECT OF RENEWABLE GENERATION ... 22
5. MATCHING SIMULATION ... 24
5.1. PLANNING AND EXECUTION ... 24
5.2. ASSUMPTIONS MADE ... 26
5.3. INPUT DATA ... 26
5.3.1. Data processing ... 31
5.4. CASE 1:MATCHING WITH RENEWABLE GENERATION ... 32
5.5. CASE 3:MATCHING WITHOUT RENEWABLE GENERATION ... 34
5.6. RESULTS ANALYSIS ... 35
5.6.1. Market prices lowering and savings increment... 38
6. COMPARATIVE ANALYSIS VS. APPA REPORT 2017 ... 40
6.1. SENSITIVITY ANALYSIS... 45
7. CONCLUSIONS ... 48
7.1. FUTURE WORK LINES ... 49
8. REFFERENCES ... 51
9. ANNEXES ... 52
9.1. SCRIPT ”RENAME_FILES” ... 52
9.2. SCRIPT ”MATCHING_REN” ... 52
9.3. FUNCTION ”FMATCHING_REN” ... 54
2
9.5. SCRIPT ”MATCHING_NO_REN_APPA” ... 59
9.6. FUNCTION ”FMATCHING_NO_REN” ... 62
9.7. SCRIPT “LOAD_OMIE_FILES” ... 63
9.8. SCRIPT “COMPUTE_SAVINGS” ... 64
3
LIST OF FIGURES
FIGURE 1:GRAPHICAL REPRESENTATION OF SPANISHIMPORT DEPENDENCY BY KIND OF FUELS.SOURCE: EUCOMMISSION [5]. ... 10
FIGURE 2:EVOLUTION OF THE INSTALLED RENEWABLE POWER CAPACITY IN SPAIN THROUGHOUT 2008-2017.SOURCE:REE[6]. ... 11
FIGURE 3:INSTALLED RENEWABLE POWER CAPACITY BY TECHNOLOGIES IN SPAIN DURING YEAR 2017. SOURCE:REE[6]. ... 12
FIGURE 4:EVOLUTION OF THE AVERAGE COSTS AND REVENUES AND ITS ASSOCIATED DEFICIT DURING
1998-2011.(P) PREVISION. SOURCE:CNE[12]. ... 14
FIGURE 5:ELECTRIC SYSTEM’S COST EVOLUTION DURING 1998-2017.(P) PREVISION.SOURCE:CNMC [13]. ... 15
FIGURE 6:ELECTRIC SYSTEM’S TARIFF DEFICIT EVOLUTION DURING 1998-2017.(P) PREVISION.SOURCE: CNMC[13]. ... 15
FIGURE 7:ELECTRIC SYSTEM’S EVOLUTION OF PREDICTED VS. REAL REGULATED COSTSDURING 1998-2017. (P) PREVISION.SOURCE:CNMC[14]. ... 17
FIGURE 8:.TIMELY SEQUENCE OF ALL MIBEL MARKETS.SOURCE:ENERGÍA Y SOCIEDAD [11]. ... 19
FIGURE 9:EXAMPLE OF THE HOURLY MATCHING PERFORMED AT THE DAY-AHEAD MARKET.SOURCE: OMIE AND OWN COMPILATION. ... 21
FIGURE 10:GERMAN MERIT ORDER CURVE.SOURCE:ENERGY ECONOMICS [20]. ... 22 FIGURE 11:HOURLY EQUILIBRIUM BETWEEN DEMAND, SUPPLY AND SYNTHETIC SUPPLY (EXCLUDING RENEWABLES) OF
ELECTRICITY AT THE DAY-AHEAD MARKET.SOURCE:ENERGY POLICY [21]. ... 23
FIGURE 12:FLOWCHART DESCRIBING THE RESULTS RETRIEVAL PROCESS.SOURCE:OWN COMPILATION 25
FIGURE 13:EXAMPLE OF SOURCE FILE CONTAINING HOURLY SALE AND PURCHASE BIDS FOR A GIVEN DAY. SOURCE:OMIE. ... 27
FIGURE 14:.EXAMPLE OF ESIOS’S ANALYSIS TOOL FOR THE PBF BIOMASS PROGRAMMED GENERATION. SOURCE:ESIOS ... 28
FIGURE 15:EXAMPLE OF SOURCE FILE CONTAINING HOURLY BIOGAS PROGRAMMED ENERGY GENERATION. SOURCE:ESIOS. ... 29
FIGURE 16:ESIOS’S ANALYSIS TOOL FOR THE HOURLY MATCHED ENERGIES AT THE 2017 DAILY SPOT
MARKET.SOURCE:ESIOS. ... 29
FIGURE 17:EXAMPLE OF SOURCE FILE CONTAINING HOURLY MATCHED ENERGIES AT 2017 DAILY SPOT
MARKET.SOURCE:ESIOS. ... 30
FIGURE 18:ESIOS’S ANALYSIS TOOL FOR THE HOURLY MATCHED PRICES AT THE 2017 DAILY SPOT
MARKET.SOURCE:ESIOS. ... 30
FIGURE 19:EXAMPLE OF SOURCE FILE CONTAINING HOURLY MATCHED PRICES AT 2017 DAILY SPOT
MARKET.SOURCE:ESIOS. ... 31
FIGURE 20:FLOWCHART DESCRIBING THE OPERATION OF “RENAME_FILES” SCRIPT.SOURCE:OWN COMPILATION. ... 31
FIGURE 21:FLOWCHART DESCRIBING THE OPERATION OF “MATCHING_REN” SCRIPT.SOURCE:OWN COMPILATION. ... 33
FIGURE 22:FLOWCHART DESCRIBING THE OPERATION OF “FMATCHING_REN” FUNCTION.SOURCE:OWN COMPILATION. ... 34
FIGURE 23:PIECE OF CODE FROM SCRIPT “COMPUTE_SAVINGS” COMPUTING “K” AND “J”.SOURCE:OWN COMPILATION. ... 36
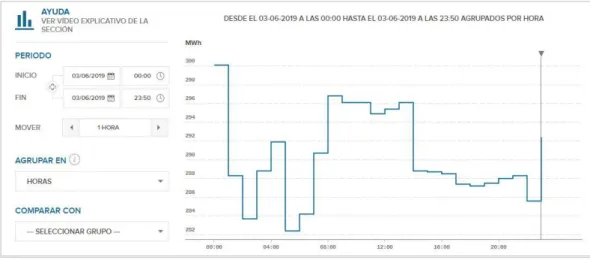
FIGURE 24:OMIE’S ONLINE TOOL DISPLAYING HOURLY AGGREGATED CURVES OF PURCHASE AND SALE BIDS.SOURCE:OMIE. ... 37
FIGURE 25:MATCHED PRICE AND ENERGY OF CASE 1 FOR THE GIVEN DATE DETAILED IN FIGURE 24. SOURCE:OWN COMPILATION. ... 37
4
FIGURE 26:OMIE’S ONLINE TOOL DISPLAYING HOURLY AGGREGATED CURVES OF PURCHASE AND SALEBIDS UNDER MARKET-SPLITTING CONDITIONS.SOURCE:OMIE. ... 38
FIGURE 27MATCHED PRICE AND ENERGY OF CASE 1 FOR THE GIVEN DATE DETAILED IN FIGURE 26.
SOURCE:OWN COMPILATION. ... 38
FIGURE 28:HISTORICAL RESULTS OF POOL’S PRICE UNDERSELLING PUBLISHED BY APPA THROUGHOUT
2010-2017.SOURCE:APPA. ... 41
FIGURE 29:OMIE’S ONLINE TOOL DISPLAYING MEAN HOURLY MATCHED PRICES AT THE POOL YEARLY. SOURCE:OMIE. ... 41
FIGURE 30:WEIGHT OF RENEWABLE GENERATION IN TOTAL GENERATION.SOURCE:REE[6]. ... 42
FIGURE 31:ESIOS’S ANALYSIS TOOL FOR THE END USER HOURLY PRICES MATCHED AT ALL MIBEL
MARKETS.SOURCE:ESIOS... 46
FIGURE 32:ESIOS’S ANALYSIS TOOL FOR THE END USER HOURLY ENERGIES MATCHED AT ALL MIBEL
5
LIST OF TABLES
TABLE 1:TABLE COLLECTING THE RESULTS OBTAINED AFTER THE EXECUTION OF THE IMPLEMENTED CODE. SOURCE:OWN COMPILATION. ... 39
TABLE 2:RESULTS OBTAINED AFTER THE EXECUTION OF THE CODES STATED IN 6.1.SOURCE:OWN COMPILATION. ... 40
TABLE 3:TABLE CONDENSING THE RESULTS OF THE MATCHING SIMULATED IN THE APPA REPORT 2017. SOURCE:APPA ... 40
TABLE 4:GRAPHICAL REPRESENTATION OF RENEWABLES UNDERSELLING DURING 2010-2017.SOURCE: OMIE,APPA AND OWN COMPILATION. ... 42
TABLE 5:RENEWABLES PRICES UNDERSELLING VS RENEWABLES GENERATION.SOURCE:APPA,REE[6],
AND OWN COMPILATION. ... 43
TABLE 6:EVOLUTION OF RENEWABLES PRICES UNDERSELLING VS. RENEWABLES GENERATION.SOURCE: APPA,REE[6] AND OWN COMPILATION... 43
TABLE 7:BREAKDOWN OF RENEWABLE TECHNOLOGIES SPECIFIC RETRIBUTION IN FISCAL YEAR 2017. SOURCE:CNMC AND OWN COMPILATION. ... 44
TABLE 8:EFFECT OF RENEWABLES OVER ELECTRICITY PRICES SIMULATED UNDER COMPLEX BIDDING CONDITIONS.SOURCE:OWN COMPILATION... 45
TABLE 9:EFFECT OF RENEWABLES OVER ELECTRICITY PRICES PUBLISHED BY APPA.SOURCE:APPA AND OWN COMPILATION. ... 45
TABLE 10:RESUME OF TYPE OF BIDDING EFFECT OVER FINAL PRICES AND SAVINGS FOR END USERS.
7
1.
INTRODUCTION
1.1.
Motivations and context
Renewable energy-generation technologies provided 46,3% of the installed power capacity in Spain at 2017 and provided a share of 33,7% of the overall electricity generation in this country. The positive effects of the integration of this kind of technologies is widely known: socio-economic and environmental benefits arise as a result of their development and use. To absorb these positive externalities, the installation of these kind of generation technologies has begun to be encouraged from the UE to its Member States during the last decades, with Spain among them. Moreover, several goals regarding renewables generation coverage ratios and installed power capacity shares have been settled through European directives and guidelines, for the 2020, 2030 and 2050 horizons. Programmes and regimes have been created with the aim of assessing this integration both nationally and internationally.
More concretely, the Spanish Government finally established in 1997 the so-called Special Regime, that settled the regulatory and economic framework under which “special” generation units were given incentives to generate electricity and install new plants. Throughout the last years, this regime has been under constant evolution until 2013, when it was finally supressed. Instead, a specific remuneration system for co-generation, renewables and waste-based generation technologies was used. Thus, these generation units were remunerated through two different channels: the revenue associated to the price matched at electricity markets in the bid-auctioning process and an additional specific remuneration, which varied with different factors associated to the plant’s characteristics and operational parameters. However, almost no subsidies are currently devoted to renewable-generation plants, as a result of the progressive constraining of the remunerative regime, achieved through regulatory updates. The new installed renewable-power capacity is now adjudicated through an auction system.
However, criticism regarding renewables integration in Spain has emerged as a consequence of the uncertainty surrounding it; symmetrically similar to that of any new-born technology in views of revolutionizing its sector. Thus, some of the negative aspects associated to their integration are usually brought out when discussing about renewables mid-term horizon: their effect over the tariff deficit, the limitation of the resource disposal to climate conditions, the curtailment of the incentives for enhancing conventional generation technologies, etc.
Therefore, this thesis aims to deeply study one of the most used arguments against this criticism: the cheapening effect renewables have on electricity prices. The hesitations concerning the sustainability of its integration in the electric sector will be studied from an economic point of view. Therefore, conclusions regarding the implications renewables have over the Daily Market operation, the main responsible of electricity prices settlement, are to be drawn at the end of this paperwork.
1.2.
Goals and scope
This document aims to reach relevant conclusions regarding the effect of renewables integration on electricity prices by means of simulating two different scenarios: one energy mix such as the 2017 Spanish one and another identical to this, but with no renewable generation. This way, by means of performing a comparative analysis between these two scenarios, the different prices settled at the electricity markets of both cases can be easily contrasted, so that the effect renewable generation has on it can be isolated and analysed.
8
Then, a deep understanding of the functioning of the Spanish Daily Market of electricity and the variability of its output associated to renewable generation is meant to be acquired. Also, conclusions regarding the data model fitting and solidness will be drawn after performing a comparative analysis of results with those published in the 2017 APPA report [1]. This report is yearly published by APPA, an association of companies related to the renewable energy sector. In this document, a macroeconomic analysis regarding renewable technologies is performed to study the impact of their integration. Thus, current information about the overall status of the renewables sector is provided in the document.In addition to this, the implications of this price variability will be used to study the savings generated by renewables (if any), so that prospects regarding renewables economical self-sustainability can be reached.
1.3.
Thesis structuring and procedure
To accomplish the above-mentioned goals, it is essential to properly step-up the procedures to be executed in the overall analysis, together with carrying out an efficient articulation of the tasks to be performed.
Thus, the thesis will be structured in four different phases, as stated below:
1.
Documentation: Information regarding the Spanish electricity sector and markets
will be retrieved with the aim of building a theoretical background standing for
their operation and status at 2017. This step turns vital as a deep understanding of
the mentioned fields is mandatorily required for the optimal execution of the
following.
2.
Data model execution: The necessary input data needed to perform the mentioned
simulation of scenarios will be collected for its later processing. Through
Matlab
-based software tools, a prototype simulating the matching process of the Spanish
Daily Market of electricity will be implemented. To do so; different scripts,
functions and algorithms will be programmed. This is, undoubtedly, the key step
of the overall process. Thus, all the programming skills of the developer must be
put in practice to properly debug the matching process of electricity prices taking
place hourly in the Daily Market, so that a solid data model can be implemented.
Once this is achieved, the simulations of the different scenarios will be carried out
so that their outcomes can be properly stored for further study. The analysis of
these results will draw the final conclusions of the thesis.
3.
Comparative analysis: The results obtained from the simulations performed will
be compared with those published by 2017
APPA
report so that conclusions
regarding the reliability and solidness of the data model implemented can be
reached.
9
4.
Conclusions: Considering all the elements that have shaped both the data model
and the analysis performed, conclusions converging with the previously stated
thesis’ goals and objectives will be drawn.
1.4.
Available means and software-based tools employed
Only Matlab-based software tools will be employed for the simulations of the Daily Market operation for the different scenarios to be implemented. The reasons behind the choice of this software tool are its simplicity and cleanliness, together with the availability of an online user-support tool [2], hosted by Matlab. At its website, Matlab users can find useful documentation detailing and clarifying the operation of the different implementable commands, data types, structures and functions. This way, new users with limited experience in programming software (such as the author) can deeply understand most of the features of the tool, enabling them to properly implement functional pieces of code for the tasks required.
Other software tools such as Microsoft Excel’s Visual Basic have been initially discarded due to its not-so-good user interface and solidness, besides the considerably smaller online-available collections of documentation regarding its operation, compared with Matlab’s.
Regarding the data collections to be used, only information of public access found at ESIOS and OMIE’s websites is used and processed in this thesis.
10
2.
STATE-OF-ART OF RENEWABLE ENERGIES IN SPAIN
2.1.
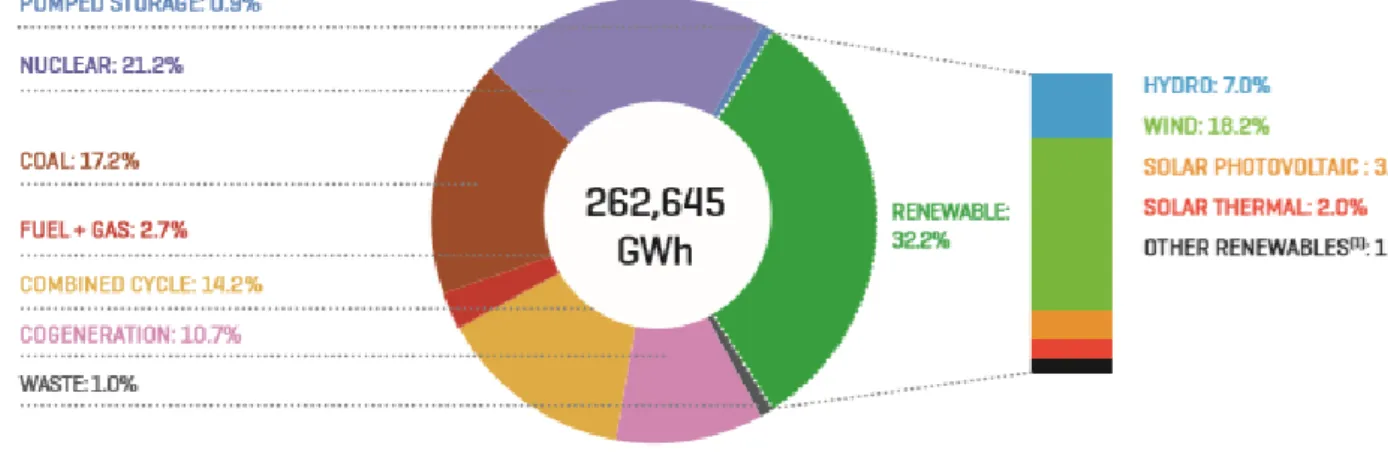
Energy mix in Spain in 2017
Data collections from Red Eléctrica de España (REE) towards Spanish energy sector [3] states that he installed power capacity in the Spanish energy mix shrank for the second consecutive year, by 0,5% with respect 2016. Much of this had to do with the definitive closure of the Santa Maria de Garoña nuclear power plant, sized at 455 MW of production. Thus, at this point, 104,122 MW constituted the whole installed capacity of the Spanish energy-generation mix in 2017, with a 46,3% of its share corresponding to renewable-generation units.
By means of an efficient use of this capacity, Spain and Portugal managed to supply 96,4% of the overall energy demanded in their territory, with the remaining 3.6% being covered by energy imports coming from neighbouring countries. However, in 2017, Spanish energy imports grew at lower rates than the exports (7,6% against 12,2%, with respect 2016); setting, for the second year in a row, a net importer balance regarding energy trading. Therefore, since most part of its demand is covered with domestic production, the peninsular territory could be said to be self-sustainable from a technical point of view. However, this has another reading: 66,3% of the overall electricity generated in Spain in 2017 came from non-renewable energy technologies using coal and natural gas as main fuels, of which 73,3% need to be imported [4].
Figure 1: Graphical representation of Spanishimport dependency by kind of fuels. SOURCE: EU Commission [5]. Therefore, as seen in Figure 1, among all EU Member States, Spain stands out with one of the most severe energy dependencies (about twenty points over the European average). This fact turns even more critical when attending to natural gas and oil, which reached in 2015 almost absolute maximums (96,6% and 99,5%, respectively) in the degree of external dependence. This makes the country extremely sensitive and vulnerable to the fossil fuels’ prices fluctuation, as shall be seen later in the report.
Hence, renewables integration arises as one of the implementable potential solutions to mitigate this dependence. The main renewable-generation technologies do not use any fuel other than natural resources such as wind, sun or water flow. Other renewable technologies, such as biomass, do use fuels. However, these are made out organic matter, usually coming from urban, farming and sewage sludge residues so that there is no need to massively import them, as they aim to be produced domestically.
11
2.2.
Main renewable technologies
As stated above, 66,3% of the electricity generated in Spain came from non-renewable generation technologies. Thus, the remaining 33,7% corresponded to renewables production. However, it must be noted that during 2017 renewable generation share fell by 16,3%, with respect the previous year [3]. This falling was mainly due to the extraordinary lack of hydroelectric generation, resulting from the severe droughts that struck the country during this year, which also fell by 49.1%. These falling placed the 2017 renewable generation on its lowest production output since 2009 [6]. Consequently, both combined-cycle and coal-fired power generation outputs grew, contributing to a 17,9% increment of the CO2 emissions regarding 2016.
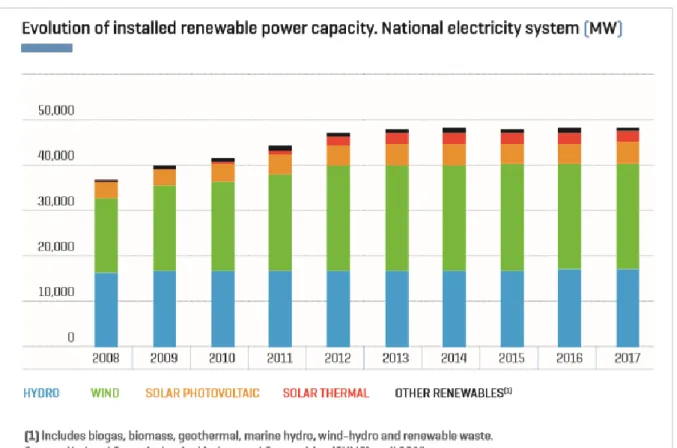
On the other hand, installed renewable power capacity growth rates remained essentially frozen, following the trend of the years subsequent to 2013. Figure 2 shows the evolution of these figures in the last years:
Figure 2: Evolution of the installed renewable power capacity in Spain throughout 2008-2017. SOURCE: REE [6]. Thus, wind energy is the most relevant renewable technology in the energy mix, followed by the hydraulic. In fact, wind energy stands out as the runner-up regarding the overall installed power capacity by technologies, behind only nuclear (Figure 3).
12
Figure 3: Installed renewable power capacity by technologies in Spain during year 2017. SOURCE: REE [6]. This is due to the fact that wind energy is, probably, the renewable technology with the smallest rates of dependence on meteorological conditions. Wind energy assures a better resource disposal than the hydro power, which is the second leading renewable technology in terms of installed power capacity. Hydraulic energy, as seen in the 2017 reports of REE, halved its generation output when unfavourable climate conditions arose. On the contrary extraordinary meteorological conditions causing weak winds are not usually sustained over time, unlike droughts. Moreover, wind energy ensures way more potential generation hours that solar energy, for example, which is only able to generate electricity during sun hours. Also, technological development has managed to reduce the uncertainty surrounding new-born wind power projects. The elaboration process regarding the preliminary wind atlas and wind-resource studies has been noticeably optimized and enhanced [7].
Thus, the aggregated effect of all these facts has given incentives to increase the spending in wind energy throughout the last years, driving this generation-units to reach the second position in the ranking in installed power capacity by technology in 2008.
2.3.
Spanish regulatory framework
The regulatory framework under which renewables have constrained its operation and integration has been in constant evolution since the 1980s. The implementation of these enhancements has been driven by the pretension of mitigating Spanish energy dependency.
However, the first relevant change introduced in the regulatory framework regarding renewables dates from 1997. The Law 54/1997 dated 27th November, regarding the Electric Sector
established the so-called Special Regime. Renewables, co-generation and residual-based generation technologies would operate within the constraints of this regime [8].
Associated to the growing general interest in this kind of technologies, the Royal Decree-Law 841/2002 settled the incentives to their participation in electric markets, prior obligation to inform about their generation forecasts and, by means of obliging retailers to acquire the produced energy, establishing annual premiums to the renewable sector [9].
13
These premiums were said to be the main responsible for the severe increment of Spanish tariff deficit throughout the years in which the financial crisis, initiated in 2008, stroked the country. Thus, the Royal Decree-Law 9/2013, dated 13th July, was published with the aim ofestablishing urgent measures to ensure the financial sustainability of Spanish electrical system [10]. New remunerative regimes were settled for all generation technologies so that, the Special Regime established in Law 54/1997 was finally supressed. This new-born remunerative regime was later updated in subsequent pieces of regulation. Thus, Law 54/1997 was finally repelled by the subsequent Law 24/2013, dated 26th December, regarding the Electric Sector
Thus, under the new economical regime of the Electric Sector, first declared in Royal Decree-Law 9/2013 and updated in current years, generation plants are remunerated following the dual-term regime stated below. Thus, they are eligible to receive [11]:
1.
One revenue associated to the sale of energy evaluated at the matched market
price.
2.
Another specific revenue associated to two different concepts:
a)
Investment: additional remuneration per unit of installed power is given to
those facilities which cannot pay-off their initial investment with the
market revenue.
b)
Operation: additional remuneration is given to all facilities which cannot
pay-off their operational expenses with the market revenue. This amount
is sized at the difference between the mentioned costs and revenues.
However, the Government reserves the right to provide the renewables, residual and co-generation technologies extraordinary pieces of supplementary remuneration; as long as these satisfy the goals settled by the EU or either ensure costs and energy dependence reductions, regarding the overall energy mix.Nevertheless, renewable-generation facilities can avail themselves to this regime, counting from the date of the expenditure of the installation authorisation, only during twenty years for wind technologies and up to thirty for PV plants. Thus, expiration dates for this specific remuneration to be perceived by renewables have been settled. This fact drives renewable generators to be obliged to seek and explore new methods aiming to optimize their operation, in order to make it profitable in the long run. Renewable technologies need to evolve to ensure their profitably in the following years, once the public funds devoted to their activity are extinct.
Moreover, throughout the next years, new regulatory modifications such as that of Royal Decree-Law 413/2014 updated the economic constraints of the additional operational remuneration to be perceived by these plants, so that they have been considerably limited. Moreover, investment incentives are now provided through auction systems in which generators willing to invest in renewables are awarded with a marginal subsidy. Thus, it can be said that public spending in renewables funding has fallen markedly since 2016, when the first auction for the adjudication of 700 MW of renewable power capacity for installation was held. The year after, the Spanish Government succeeded in the execution of several subsequent auctions. Thus, given the efficient economic performance achieved in these processes and the increasing demand of generators, further auctioning processes can be expected to take place in the following years. Moreover, in order to accomplish the goals settled by the EU in the 2030 horizon, the estimated need of renewable power capacity to be installed yet is sized at 22.000 MW [11].
14
Therefore, as seen above, their operation in the Daily Market and the effect of their integration in the energy mix on electricity prices need to be deeply studied. Thus, the price matched at the Daily Market of electricity is the key factor to understand their profitability in the medium term. Also, by means of studying this parameter, some of the most important socio-economic benefits associated to their integration can be analysed; as initially aimed in the goals declaration of this thesis.2.4.
Costs of the Electrical System
As in any cost-benefit analysis, the economic sustainability of renewables is intimately related to the costs of the system. Year 2013 constituted a perfect example of this: the costs associated to the premiums remunerated to the Special Regime were said to be the main causes of the tariff deficit growth, so that urgent regulatory measures were taken to mitigate the worsening of the situation, compromising renewables survival in the medium term.
The evolution of this tariff deficit during the years previous to the regulatory change can be seen in Figure 4.
Figure 4: Evolution of the average costs and revenues and its associated deficit during 1998-2011. (P) prevision. SOURCE: CNE [12].
Thus, as stated by the CNE (currently integrated in the CNMC) [12], before Royal Decree-Law 9/2013 the costs of the regulated activities were noticeably larger than the revenue coming from the payment of the regulated term of electricity prices by consumers. Moreover, the growing tendency of the tariff deficit seems to firstly take-off in 2002, right after the Royal Decree-Law 841/2002 stablishing the first premiums to the Special Regime.
15
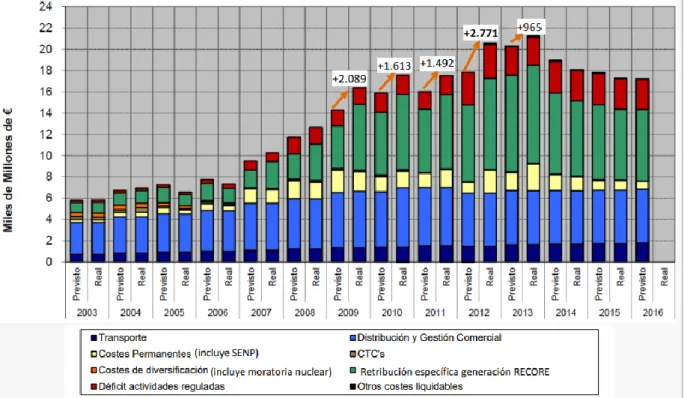
Figure 5: Electric System’s cost evolution during 1998-2017. (P) prevision. SOURCE: CNMC [13].Figure 5 shows the weight of the premiums to the Special Regime regarding the total regulated costs of the system. It can be seen how these began to grow also in 2002, from which it can be deduced that they were indeed the main responsible of the growth of the tariff deficit. However, after 2013, it can be seen how these began to moderate, having the consequent positive impact over tariff deficit (Figure 6). Yet, it is still necessary to face shares standing for annuity payments to this tariff deficit in the regulated price of electricity.
Figure 6: Electric System’s tariff deficit evolution during 1998-2017. (P) prevision. SOURCE: CNMC [13].
2.4.1.
Costs face-off: Regulated term in the electric bill
Thus, the Electric Sector splits its total costs in two: the regulated and the production costs; which are paid-off through two different terms in the final price of electricity.
The regulated costs of the system are divided into:
Access costs: including payments to the transmission and distribution grids
networking the peninsular territory and its commercial management,
16
complementary payments to the generators operating in non-mainland territory,
payments to the old
Special Regime
, payments associated to the additional
remuneration to be perceived by generators stated in
Royal Decree-Law
413/2014
, shares to Market and System Operators (
OMIE
,
REE
) and regulator
(
CNMC
), annuity payments to the tariff deficit, compensations to nuclear
generators for the nuclear moratorium, costs associated to the disposal of nuclear
residues and the strategic stock of nuclear fuel, etc.
Capacity payments: including those incentives willing to promote the building of
new power plants (auctions) and those devoted book power availability of
technologies to be used in peak demand periods (interruptibility). These bookings
can be only executed in a one-year horizon.
Thus, access costs are remunerated through the payment of a regulated term in the final price of electricity, through the so-called access tolls; which are composed of:
One constant term (
€/kW
) for contracted power, in order to guarantee anytime the
supply of the contracted power.
Another variable term (
€/kWh
) for energy, which directly depends on the
consumed energy.
Access tolls are annually settled by the MINCOTUR, who reserves the right to review them when extraordinary conditions arise, on a quarterly basis maximum. Thus, the aim of this tolls is to completely pay-off the costs. These are settled one-year-ahead on the basis estimation of the regulated costs for the following year. Thus, if predictions mismatch the real costs, these cannot be fully covered. Hence, the difference between total revenue generated by this access tolls and the regulated costs of the system is the tariff deficit. Figure 7 graphically shows the yearly tariff deficit generated as the result of the mentioned fact. However, it can be also noticed how these began to fall after 2013, with Royal Decree-Law 9/2013 and its subsequent regulatory updates.
17
Figure 7: Electric System’s evolution of predicted vs. real regulated costsduring 1998-2017. (P) prevision. SOURCE: CNMC [14].
On the other hand, production costs are constituted by the amount to be paid to generators for the total of energy fed to the network. This energy is evaluated at the prices matched at both forward and spot markets, as it will be explained in the following chapter.
18
3.
IBERIAN ELECTRICITY MARKET (MIBEL)
As the main goal of this thesis is to study the effect of renewables on the price of energy matched on the Daily Market, prior to this analysis, some introductory paragraphs need to be devoted to explain the functioning of the electric markets in Spain.
The first detail to point out is that the Electric Sector in Spain has not always worked the way today does. Before 1997, it was structured as a regulated system in which prices settled by the Government paid-off all the incurred costs. These payments; mostly devoted to cover the operation costs of generation, transport and distribution of energy; were made to the few private companies operating in the sector. Thus, with the drastic regulatory implications of Law 54/1997, Spanish Electrical System was liberalized with the aim of increasing companies’ competitiveness and system’s overall efficiency. Thus, as introduced in the previous point, the activities of the sector were differentiated into two kinds: regulated (transport and distribution) and partially-liberalized (production and commercialization). Therefore, there are two key actors responsible for the operation and competitiveness of the sector: System Operator and Market Operator.
3.1.
Operators and markets
Red Eléctrica de España (REE) is the System Operator in Spain. Its main functions are to ensure the correct operation of the system and guarantee, at any time, the continuity and safety of the supply negotiated in the wholesale markets. To do so, some of the markets devoted to satisfy this technical conditions of the system (matching between demand and supply at any time) are also operated by them.
However, the Market Operator is in charge of supervising the matching process between the sale and purchase bids periodically auctioned to the market. Thus, it is responsible of satisfying, in the most efficient way for the end-users’ purse, the scheduled demand of energy with the most convenient sale bids, in views of maximizing social welfare. Thus, we can distinguish two different kinds of markets: spot and derivatives.
In spot markets, commodities such as electricity are traded for immediate delivery. Hence, the main spot markets in the peninsular territory are then operated by the Operador del Mercado Ibérico - Polo Español (OMIE): the wholesale Daily Market and the Intraday Market. These two markets trade electricity to be finally delivered few hours after their adjudication.
Future or derivative markets, on the contrary, perform electricity trades in which the delivery date is settled in a way longer horizon (counting from several days after the adjudication to years). These markets, in peninsular territory, are operated by Operador del Mercado Ibérico- Polo Portugués (OMIP). However, bilateral contracts are also carried out at OTC markets [11].
Thus, all these markets are jointly operated by Spain and Portugal through their integration into the Mercado Ibérico de la Electricidad (MIBEL). Figure 8 shows their timely sequence and schedule.
19
Figure 8:. Timely sequence of all MIBEL markets. SOURCE: Energía y Sociedad [11].
3.2.
Agents
Thus, different natural and legal persons have the capacity to take part in the trading process performed in these markets by means of auctioning sale or purchase bids, prior commitment to undertake the established requirements. Hence, different agents can operate in the above-mentioned markets [15]:
Electricity generators: they are responsible for the electricity production, together
with the setting-up, maintenance and operation of the plants needed to perform
these task.
Retailers: they re-sell the energy bought at the markets to end-users or other
retailers.
Reference
retailers work constrained to the
PVPC
(
Precio Voluntario al
Pequeño Consumidor
) regime, under which they are forced to sell electricity to
end-users at a given price, settled by the Government.
Consumers: they can buy the energy directly at the market by means of auctioning
purchase bids or through retailers.
Representatives: they are authorised by third parties to bid in their behalf.
Load balancers: these are consumers enabled to re-sell electricity to services
devoted to the charging of electric vehicles.
20
4.
DAILY MARKET
From all the MIBEL markets, the Daily Market is, undoubtedly, the most relevant regarding electricity prices settling. In 2017, the matched price at the Daily Market (also called pool) weighted the 68,43% of the final price of electricity, after its negotiation in the subsequent markets. Moreover, the amount of energy traded in the pool constituted the 78% of the overall energy traded in all the remaining markets. The participation in the Daily Market is mandatory for all the units not subjected to bilateral contracts.
4.1.
Bids submission
As stated in Figure 8, the Daily Market is held D-1, one day before the delivery of the purchased energy to the buyer. Thus, all agents taking place in the auctioning process must submit their purchase (retailers, representatives and consumers) or sale bids (generators, load balancers) to OMIE no later than 12:00 the day before the day of delivery. Thus, each agent is able to submit bids containing up to 25 blocks to the auction process, each for the hour of the following day (taken also into account the extra hour associated to the time change in summer).
This bids can be either simple or complex. By means of submitting simple bids, agents transfer the Market Operator an amount of energy and its corresponding price for each of the hourly blocks. However, in complex bids, agents determine additional conditions to be fulfilled in the matching process. Consequently, if these are not fulfilled, the matching process of the given unit is not accomplished. Otherwise, the fulfilment of these conditions and the effective matching of these units, usually, shifts the supply aggregated curve to the left, setting higher matched prices and smaller matched amounts of energy. However, this doesn’t apply for early morning hours, in which complex bids may set even lower matched prices than simple ones, due to the moderated demand. Still, it can be said that complex conditions set important constraints to the matching process [16]. The above-mentioned conditions are those of indivisibility, load gradient, minimum income and scheduled stop.
These are stated by OMIE at its market activity rules, available at its website [17]:
“The indivisibility condition enables a minimum operating value to be fixed in the first block of each hour. This value may only be divided by applying distribution rules if the price is other than zero.
The load gradient enables the maximum difference between the energy in one hour and the energy in the following hour of the production unit to be established, limiting maximum matchable energy by matching the previous hour and the following hour, in order to avoid sudden changes in the production units that the latter are unable to follow from a technical standpoint.
The condition of minimum income enables bids to be submitted in all hours, provided that the production unit does not participate in the daily matching result if the total production obtained by it in the day does not exceed an income level above an established amount, expressed euros, plus a variable remuneration established in euros for every matched MWh.
The condition of scheduled stop enables production units that have been withdrawn from the matching process because they fail to comply the stipulated minimum income condition to carry out a scheduled stop for a maximum period of three hours, avoiding stoppages in their schedules from the final hour of the previous day to zero in the first hour of the following day by accepting the first slot of first three hours of their bids as
21
simple bids, the only condition being that energy offered in bids must drop in each hour.”
[17]
4.2.
Matching
The matching is performed under a marginalist mechanism, implemented by EUPHEMIA algorithm [18]: sale and purchase bids are sorted by growing and decreasing prices, respectively. This way, the matched price is settled as that of the last accepted bids; or, in other words, when both the demand and supply aggregated curves intersect. Hence, all units are remunerated by their respective auctioned energy at this matched price.
This way, the maximization of social welfare is achieved. This welfare is said to be the sum of both buyers and producers’ surplus. Thus, the buyers’ surplus is the difference between the marginal price initially auctioned in the purchase bid and the final matched price for that hours. The same applies to producers but with sale bids.
Figure 9: Example of the hourly matching performed at the Day-ahead Market. SOURCE: OMIE and own compilation. Figure 9 represents graphically the achieved welfare with the marginalist mechanism characterizing the matching process, together with the shifting effect complex bids inclusion has on aggregated sale curves. As seen above, all the bids “entering” into the matching are those to the left of the accepted volume of energy.
Hence, from this it can be deduced that the Daily Market mechanisms drive agents participating on it to submit their bids at their marginal costs of production: the smaller the price at they bid, the bigger chance of entering into the matching and getting its corresponding piece of surplus. However, in order to achieve market efficiency, generators should not submit their bids at prices evaluated at their variable costs of production, but at their opportunity costs. These are defined as the costs the generator will avoid incurring in when choosing not to produce energy, in addition to the hypothetical revenue that is given up when taking this decision. For example, when a hydraulic power station decides to release its impounded reserves, the plant is giving up the possibility of releasing water at any other time with predictions of higher market prices. Also, the costs associated to, for example, the maintenance of the machinery regarding the water retrieval when that decision is taken, shall be taken into account as opportunity costs [11].
22
4.3.
Merit-order effect
of renewable generation
In order to understand the process through which renewables integration is said to undersell pool prices, some clarifications must be provided firstly.
Under the current regulatory framework, nuclear power plants submit their sale bids to the auction process at price zero: they are price takers. Due to their low stopping capability and the expensiveness and complexity of nuclear waste management, nuclear power plants present minimal opportunity costs. For them, it is much more expensive to give up producing rather than keeping on working [19].
Something similar happens with renewable generation units, which sell their generation at quasi-zero prices in the Day-ahead Market. This is due to the fact that no opportunity costs associated to fuel usage are incurred when deciding to keep on producing. Conventional generation units may consider to re-sell the fuel to be used in secondary markets, when prices of electricity are predicted to be lower than the revenue obtained through this process. Thus, most renewable technologies’ opportunity costs will be mainly integrated by the costs incurred in when choosing to produce, such as maintenance costs. However, as these are moderated, they manage to auction bids at lower prices than conventional generation units.
Consequently, as sale bid curves are aggregated and sorted from least to greatest price, renewables (and nuclear) generators’ bids are always included in the matching. Thus, the greater renewable generation, the greater demand coverage by this technology and the lesser remaining demand to be covered by more expensive ones. Therefore, conventional and expensive generation units are said to be “price settlers”, regarding the electricity markets [20].
Figure 10: German merit order curve. SOURCE: Energy Economics [20].
Thus, there is evidence for stating that renewable energy integration is able to lower the prices matched at de Daily Market, as a result of the merit-order effect. Thus, the remaining pages of the thesis will be devoted to study its event. The goal will be to, first, confirm if renewables did undersell electricity prices in Spain during 2017 and, if so, compute to which extent and under which limitations this is true. To do so, the aggregated supply curves of bids auctioned to the
Day-23
ahead Market will be simulated, dismissing the bids coming from renewable generation plants, as stated in the introductory paragraphs. The goal will be to obtain a global picture similar to that of Figure 11.Figure 11: Hourly equilibrium between demand, supply and synthetic supply (excluding renewables) of electricity at the Day-ahead Market. SOURCE: Energy Policy [21].
24
5.
MATCHING SIMULATION
5.1.
Planning and execution
As previously explained in the introductory paragraphs, the main goal of this study is to reach conclusions regarding the effect of renewable energy-generation technologies on electricity prices. Thus, four different scenarios must be considered regarding the hourly matching process of 2017’s Spanish Daily Market of electricity:
a)
Case 1: It considers the 2017 generation mix, including renewable generation, as
the baseline scenario. The matching process at the Daily Market is simulated with
simple bids files provided by
OMIE
.
b)
Case 2: It considers the real scenario of 2017’s Spanish generation mix. The
results of the Daily Market operation for this year were, obviously, computed
under Complex Bidding conditions. Thus, these are the official matched prices
and energies in 2017 provided by
OMIE
.
c)
Case_3: It considers a synthetic generation mix, such as that of 2017 but excluding
renewable generation, as the baseline scenario. The matching process at the Daily
Market is simulated with the same bids as those of
Case 1,
but dismissing sale
bids auctioning renewable generation from the matching process.
d)
Case 4: It considers the same synthetic generation mix as that of
Case 3
. However,
the results of the Daily Market operation for this year are not simulated, but
computed out of the previous. Thus, this is the
goal
scenario. Its results will be
later compared with those of
Case 2
so that conclusions can be drawn.
Consequently, the matching results need to be inexorably computed assuming
Complex Bidding conditions.
The matching process of Spanish electricity Daily Market for cases 1 and 3 is simulated, while Case 2 is considered as the virgin scenario for the further calculations. Case 4 is computed out of the results of the previous. In these different scenarios, the different bid units integrating each matching process will vary the hourly matched prices obtained. Once the simulations are performed, matching prices from cases 2 and 4 are analysed and compared in order to compute the savings in electricity prices associated to the integration of renewable-generation technologies in the energy mix, so that conclusions regarding the merit-order effect can be reached. Figure 12 shows the flow-chart diagram of the main steps integrating the whole process.
25
Figure 12: Flowchart describing the results retrieval process. SOURCE: Own compilation
In order to execute all these processes, only Matlab-based software tools are to be employed. Different algorithms, scripts and functions need to be implemented with the aim of performing the tasks needed. As the simulation explanation goes by, all the relevant details regarding these tools operation will be properly clarified and brought to the table.
Through the interactive and analytic tools supported by both OMIE and ESIOS websites, input data will be accessed and downloaded for its later processing. For cases 1 and 3, the same sale and purchase bids be considered (those of Case 2). Moreover, for Case 3, hourly renewable energy-generation units need to be taken into account, so that the sale bids auctioning renewable energy can be properly dismissed in the matching process.
26
For cases 1 and 3, once all the input data is properly processed, only the relevant information for the later analysis will be selected and disposed. This way, Matlab is able to work at its highest rates of efficiency and cleanliness. The scripts and functions are then executed to simulate the matching process, obtaining for every hour in the year reliable reproductions of the matched prices and energies that would have been obtained in the Daily Market operating in each of the different cases.Finally, the results are properly stored and selected: only matched prices and energies obtained at the end of each yearly simulation are to be considered for the later analysis.
5.2.
Assumptions made
The main assumption regarding the entire simulation of the matching process detailed in this paper is analytically described below.
𝑘 = 𝑚𝑎𝑡𝑐ℎ𝑒𝑑𝑃𝑟𝑖𝑐𝑒2− 𝑚𝑎𝑡𝑐ℎ𝑒𝑑𝑃𝑟𝑖𝑐𝑒1= 𝑚𝑎𝑡𝑐ℎ𝑒𝑑𝑃𝑟𝑖𝑐𝑒4− 𝑚𝑎𝑡𝑐ℎ𝑒𝑑𝑃𝑟𝑖𝑐𝑒3
Thus, 𝑚𝑎𝑡𝑐ℎ𝑒𝑑𝑃𝑟𝑖𝑐𝑒2 is the hourly matched price of Case 2 under Complex Bidding conditions while 𝑚𝑎𝑡𝑐ℎ𝑒𝑑𝑃𝑟𝑖𝑐𝑒1 is the hourly matched price obtained after the simulation of Case 1, taking only into account simple bids in the auctioning process. The energy mix considered for both cases is that of 2017, including renewable generation. The third part of the equality works symmetrically for cases 3 and 4 (2017’s synthetic energy mix with no renewable generation).
However, it must be also said that for the simulation of Case 3 and the later computation of Case 4, it is assumed that the installed power capacity in Spain is large enough to cover the demand that would have been supplied by renewables. This assumption could be said to be realistic, as the total energy auctioned to the market in an hourly basis is way larger than the market accepted volume of energy: there is supply enough to satisfy the whole demand.
Also, the Base-Functioning Program (PBF) was the official generation schedule employed to determine the hourly renewable production achieved in 2017. This schedule includes all the programmed-renewable generation to be negotiated in all spot markets and through the most recent bilateral contracts. It must be noted that, as explained in point 4, the participation in the Daily Market is mandatory for all the units not subjected to bilateral contracts. Thus, due to the impossibility of differentiating these energy blocks from each other, all renewable-programmed generation scheduled in the PBF has been included in the matching processes simulated in this paperwork. Therefore, even though share of energy traded in the most recent bilateral contracts is almost negligible regarding the overall production of renewables, this assumption must be taken into account when analysing the results reached.
Moreover, only data regarding the Spanish Daily Market operation during the year 2017 have been considered. However, the results obtained and conclusions reached in this paperwork do not aim to be extrapolated to any other period of time. The scope of the project has been focused on this year to show the effect renewable generation has nowadays over electricity prices.
5.3.
Input data
All the input data used in this simulation is of public access and can be accessed through both OMIE and ESIOS websites. As previously stated on Figure 12, the execution of the model for both cases requires access to the aggregated curves of sale and purchase bids hourly auctioned to the 2017’s Daily Market. These can be found in the form of daily text files at OMIE’s website,
27
grouped in monthly folders stored in an outer one, named “Zips mensuales con curvas agregadas de oferta y demanda del mercado diario incluyendo unidades de oferta”. These folders need to be properly unzipped with the required software. The information collected in them dates back from 2001 and spans in time up to three months before the moment of the enquiry. Bids more recent than that are not yet published due to privacy issues.The information available in each of this text files can be seen Figure 13, containing the following columns:
Hour (“Hora”)
:
Ranging from 1 to 24
Date (“Fecha”)
: The date of the day specified in file’s name
Country (“País”)
: With three different possible values
MI (Iberian Market)
: For bids in normal market conditions
ES (Spain)
: For bids auctioned to the Spanish Market when
market-splitting occurs
PT (Portugal)
: For bids auctioned to the Portuguese Market when
market-splitting occurs
Unit (“Unidad”)
: Not to be used
Bid Type (“Tipo Oferta”)
: With two different possible values
C
: Referring to auctioned purchase bids
V
: Referring to sale purchase bids
Energy (“Energía Compra/Venta”)
: Energy auctioned in its corresponding
bid (MWh)
Price (“Precio Compra/Venta”)
: Price auctioned in its corresponding bid
(€/MWh)
Auctioned/Matched (“Ofertada (O)/Casada (C)”)
: With two different
possible values
C
: Referring to matched bids. Not to be used
O
: Referring to auctioned bids
28
Additionally, for the simulation of Case 3 it is required to determine the 2017 programmed renewable-energy generation so that it can be dismissed from the auctioning process. As stated in point 5.2, the Base Functioning Program (PBF) schedules energy production to be negotiated at the Day-ahead Market and through bilateral contracts. This way, by accessing to the detail of its operation, this planning can be known. This information can be found at ESIOS website, hosted by REE, and can be interactively visualized through its recently-implemented analysis software tool shown in Figure 14. By means of selecting the desired period of time to be studied, different files containing the programmed yearly energy to be generated by each kind of renewable technology can be exported in CSV, EXCEL and JSON formats.Figure 14:. Example of ESIOS’s analysis tool for the PBF biomass programmed generation. SOURCE: ESIOS The considered renewable-generation technologies in this paperwork were those contained in the old Special Regime stated in Law 54/1997:
Biomass Energy
Wind Energy
Mini-Hydraulic Energy
Photo-Voltaic energy
Solar Thermo-Electric Energy
And so were considered other renewable-generation technologies, not included into the Special Regime:
Biogas Energy
Oceanic and Geothermal Energy
Other Renewables
Once the files have been properly exported, its content appears as in Figure 15, including the following columns:
ID
: Not to be used
Name
: The kind of renewable-generation technology specified in file’s name
Geoid
: Not to be used
Geoname
: Not to be used
29
Datetime
: Hourly date of the corresponding generation
Figure 15: Example of source file containing hourly biogas programmed energy generation. SOURCE: ESIOS. In order to compare the results obtained for Case 4 (computed out of the outputs from the simulation of cases 1 and 3) with those of Case 2, data collections containing the actual matched prices and energies in the 2017’s Daily Market operation need to be also accessed. Again at ESIOS website, files containing the hourly matched energies can be exported by means of using its analysis tool as shown in Figure 16.
Figure 16: ESIOS’s analysis tool for the hourly matched energies at the 2017 daily SPOT market. SOURCE: ESIOS. Once the file has been properly exported, its content appears as in Figure 17, including the following columns:
ID
: Not to be used
Name
: Not to be used
30
Geoname
: Not to be used
Value
: Hourly matched energy
Datetime
: Hourly date of the corresponding energy
Figure 17: Example of source file containing hourly matched energies at 2017 daily SPOT market. SOURCE: ESIOS. Similarly, files containing the hourly matched prices can be also exported by means of using again ESIOS’s analysis tool as shown in Figure 18:
Figure 18: ESIOS’s analysis tool for the hourly matched prices at the 2017 daily SPOT market. SOURCE: ESIOS. Once the file has been properly exported, its content appears as in Figure 19, including the following columns:
ID
: Not to be used
Name
: Not to be used
Geoid
: Not to be used
Geoname
: Not to be used
Value
: Hourly matched price
31
Figure 19: Example of source file containing hourly matched prices at 2017 daily SPOT market. SOURCE: ESIOS.
5.3.1.
Data processing
Once the input data has been properly selected, it is essential to properly process it. The first issue to take care of, is the files format. As seen before, there are daily text files containing the published sale and purchase bids. The name of these files is a generic one associated to its date and, moreover, it has been added a digit at the end of it. This way, they all have the following form: “curva_pbc_uof_yyyymmdd.1”, being “.1” the extension of the file.
In order to adequate the 365 daily files format into another readable for the Matlab software, a code is implemented to rename all these files and convert them into DAT-files: the script “rename_Files”. This script erases the “1” after the dot and then adds the “dat” extension. The execution of this script is represented below through a flow-chart diagram (Figure 20).
32
Once all input files are readable and manageable for Matlab, for cleansing and operational reasons, input data still needs further processing. To do so, scripts “matching_Ren” (Case 1) and “matching_NO_Ren” (Case 3) are written. The code implemented in them is embed into a loop which executes the following steps in each iteration, so that daily files are accessed and modified one by one.First of all, empty columns and rows are deleted. Also, leading rows containing the headers are removed so that only relevant data remains in the file. Afterwards, by means of logical indexing, matched bids and bids auctioned to the Portuguese Market when market-splitting occurs are also deleted, so that they are not taken into account in the bidding process simulation. Subsequent to this, columns containing numerical data saved as string need to be properly converted to double, where previously the dots and commas standing for thousands and decimals have been switched.
Again by means of logical indexing, vectors containing prices and energies bid to the Daily Market are generated. Different vectors are created for purchase and sale bids. Later on, these are grouped hourly into supply and demand matrices, which are then used as input parameters for the calling of the functions “Fmatching_Ren” (Case 1) and “Fmatching_NO_Ren” (Case 3).
5.4.
Case 1: Matching with renewable generation
In the script “matching_Ren”, before calling the function “Fmatching_Ren” an inner loop of 24 iterations is implemented on the code in order to call the matching function hourly. However, there is still need to solve the problems associated to the two time changes that take place over the year. Calendar of 2017 states that time changes on this year took place on March 26th and October 29th; which correspond to days 85 and 302 of the year, respectively.
Thus, manually, one hour must be subtracted to the 85th day and another hour must be
added to the 302th. To do so, two additional loops of 23 and 25 iterations are implemented. By
means of using conditional commands, these two loops are only accessed when the counter of the outer loop matches with the condition statement, so that code keeps running through the main loop if FALSE. Description of the operation-flow of the above-mentioned script is shown below in Figure 21.
33
Figure 21: Flowchart describing the operation of “matching_Ren” script. SOURCE: Own compilation.
Thus, the function “Fmatching_Ren” simulates the hourly matching process that would take place in the Daily Market. The operation of this function is detailed as follows.
First of all, the matrixes containing the hourly bids need to be sorted by price: sale bids (supply matrix) are sorted from least to greatest and purchase bids (demand matrix) from greater to lower price. Once they have been sorted, an accumulated sum of the energies column for each of the matrixes must be performed.
Later, the function seeks element by element, in ascending order, the first position at which the supply matrix (iofe) has a larger energy than the demand matrix at the given position (idem). The seeking process is iterated until the price of the supply matrix at position iofe is greater than the price of the demand matrix at position idem. Once this condition is fulfilled, matched prices and energies are settled. Performance of the function “Fmatching_Ren” can be seen below in Figure 22.
34
Figure 22: Flowchart describing the operation of “Fmatching_Ren” function. SOURCE: Own compilation.
Hourly matched process and energies are saved in two 1-by-8760 vectors (matchedPriceAcc and matchedQuantityAcc) for later study.
5.5.
Case 3: Matching without renewable generation
The simulation of the matching process for Case 3 is takes place through the execution of the script “matching_NO_Ren”. The code written on it is very similar to the one used in “matching_NO_Ren” (Case 1). The only difference between both scripts is the dismissal of the energy bid from renewable-generation units from the whole matching process (Case 3).
Thus, a new piece of code is implemented into the script “matching_NO_Ren”, so that renewable-generated energy auctioning to the matching process can be properly identified. However, files containing the scheduled hourly renewable generation by the PBF only include the hours of the year with non-zero renewable generation. Consequently, it is necessary to embed a new inner loop at the beginning of the script. In each iteration, this loop accesses to the file’s directory and reads one file at a time, writing vectors containing in each element the hourly energy generated. If any date leaps appear during this process, zero rows are then added to the vector in order for it to be consistent with the size of the remaining data collections in the simulation, obtaining the vector quantityGenRenAcc.
![Figure 1: Graphical representation of Spanishimport dependency by kind of fuels. SOURCE: EU Commission [5]](https://thumb-us.123doks.com/thumbv2/123dok_us/10014984.2493792/16.892.152.847.530.803/figure-graphical-representation-spanishimport-dependency-fuels-source-commission.webp)

![Figure 8:. Timely sequence of all MIBEL markets. SOURCE: Energía y Sociedad [11].](https://thumb-us.123doks.com/thumbv2/123dok_us/10014984.2493792/25.892.132.823.106.528/figure-timely-sequence-mibel-markets-source-energía-sociedad.webp)