Syddansk Universitet
Radiation-induced hypothyroidism after treatment of head and neck cancer
Rønjom, Marianne Feen
Published in:
Danish Medical Journal
Publication date:
2016
Document version
Publisher's PDF, also known as Version of record
Document license
CC BY-NC
Citation for pulished version (APA):
Rønjom, M. F. (2016). Radiation-induced hypothyroidism after treatment of head and neck cancer. Danish
Medical Journal, 63(3), [B5213].
General rights
Copyright and moral rights for the publications made accessible in the public portal are retained by the authors and/or other copyright owners and it is a condition of accessing publications that users recognise and abide by the legal requirements associated with these rights. • Users may download and print one copy of any publication from the public portal for the purpose of private study or research. • You may not further distribute the material or use it for any profit-making activity or commercial gain
• You may freely distribute the URL identifying the publication in the public portal ? Take down policy
If you believe that this document breaches copyright please contact us providing details, and we will remove access to the work immediately and investigate your claim.
PHD THESIS DANISH MEDICAL JOURNAL
This review has been accepted as a thesis together with three previously published papers by University of Southern Denmark 8th of May 2015 and defended on 27th of May 2015
Tutor(s): Jørgen Johansen, Carsten Brink, Laszlo Hegedüs & Jens Overgaard
Official opponents: Remco de Bree, Julie Gehl & Jens Lauritsen
Correspondence: Department of Oncology, Odense University Hospital, Sdr. Boule-vard 29, 5000 Odense C, Denmark
E-mail: m_feen_r@hotmail.com
Dan Med J 2016;63(3):B5213
THE 3 ORIGINAL PAPERS ARE
1. Rønjom MF, Brink C, Bentzen SM, Hegedüs L, Overgaard J, Johansen J. Hypothyroidism after primary radiotherapy for head and neck squamous cell carcinoma: normal tissue com-plication probability modeling with latent time correction. Radiother Oncol. 2013 Nov;109(2):317-22.
2. Rønjom MF, Brink C, Lorenzen EL, Hegedüs L, Johansen J. Variation of normal tissue complication probability (NTCP) estimates of radiation-induced hypothyroidism in relation to changes in delineation of the thyroid gland. Acta Oncol. 2015;54(8):1188-94.
3. Rønjom MF, Brink C, Bentzen SM, Hegedüs L, Overgaard J, Petersen JB, Primdahl H, Johansen J. External validation of a normal tissue complication probability model for radiation-induced hypothyroidism in an independent cohort. Acta On-col. 2015 Oct;54(9):1301-9.
INTRODUCTION
Head and neck cancer
Head and neck squamous cell carcinoma (HNSCC) is the sixth most common cancer worldwide, with an annual incidence of approximately 560,000 cases [1]. In Denmark the 2013 incidence of head and neck cancer (i.e. laryngeal, pharyngeal, oral cavity, sino-nasal and salivary gland cancer and unknown primary) was 1,287 [2]. This incidence has been increasing over the past 25 years, also when adjusted for age [3]. The 5-year age-adjusted relative survival is 64% for men and 68% for women [4]. This rate has been relatively constant for men between 1998 and 2012, but has been improving for women.
The term head and neck cancer covers a heterogeneous group of cancer diagnoses and locations, where squamous cell carcinoma of the oral cavity, pharynx and larynx is the most common histol-ogy. The environmental etiology of HNSCC is mainly related to tobacco and alcohol intake. However, the incidence of HNSCC caused by Human Papillomavirus (HPV) has increased over the last 30 years, especially for oropharyngeal cancer [5,6]. This has led to a new subgroup of patients with HNSCC, who have differ-ent clinical characteristics and molecular biology and increased radiosensitivity [7,8].
Treatment of HNSCC
HNSCC is predominantly a loco-regional disease with less than 5% of patients having distant metastases at diagnosis [2]. Around 60% of patients have locally advanced disease (i.e. stage III and VI) at diagnosis. The main treatment options are surgery and radiotherapy (RT), either alone or in combination, and in recent years with addition of chemotherapy. RT is the primary treatment for HNSCC in Denmark [9], thus 70% of patients receive primary RT and 30% receive surgery with or without post-operative RT [2]. For the majority of patients with early stage HNSCC, single modal-ity treatment may be sufficient for cure. For patients with ad-vanced disease, combined modality treatment including chemo-radiation [10], modification of tumor hypoxia [11] and altered fractionation [12,13] has improved outcome. Treatment with newer biological targeted agents, like epidermal growth factor receptor (EGFR) inhibitor, in combination with definitive RT is controversial [14-17].
Over the past three decades there has been a significant techno-logical development in the delivery of RT, from two-dimensional (2D)-RT based on X-ray images to CT-based three-dimensional conformal treatment (3D-CRT). 3D-CRT uses three or more treat-ment fields to deliver a homogeneous dose to the target area, and subsequent implementation of multi-leaf collimators and more advanced computer algorithms, has enabled intensity mod-ulated RT (IMRT) and later volumetric modmod-ulated arc therapy (VMAT). With these novel treatment techniques there is potential for sparing the normal tissues while increasing radiation dose to the tumor and other target areas [18-20].
The Danish Head and Neck Cancer Group (DAHANCA) has used standardized guidelines for treatment of head and neck cancer in all centers [21] since 2002, and DAHANCA trials have made a significant contribution to optimizing RT in patients with head and neck cancer, both nationally and internationally [11,12,22]. The DAHANCA database contains a variety of clinical, demographic, and treatment-related data including symptoms, etiological fac-tors, diagnostic methods, TNM stage, primary treatment, follow-up status, disease failure, death and cause of death of patients
Radiation-induced hypothyroidism after treatment
of head and neck cancer
diagnosed with HNSCC in Denmark since 1991 (and larynx carci-noma since 1971) [2,23]. The database provides a valuable tool for quality assurance of treatment [24] and for research, including the present PhD-project [25-29].
Radiation treatment planning
Treatment is delivered as external beam radiation using linear accelerators. In definitive RT for HNSCC in this project, standard target dose is 66-68 Gy in 33-34 fractions, 5-6 fractions/week [21].Treatment planning for head and neck cancer patients in daily practice is initiated with a therapeutic CT-scan of the patient fixated in the treatment position. The tumor volume and clinically relevant target areas are defined and delineated in the treatment planning system by the oncologist and the radiologist in collabo-ration. The critical normal tissues, organs at risk (OARs), are de-fined and delineated by the oncologist. Planning target volumes are then generated and a dose calculation is performed to ensure appropriate dose distributions to cover tumor areas during radio-therapy and to keep treatment doses below tolerance levels of the normal tissues as defined by clinical guidelines. Modern treatment planning systems allow a rather precise calculation of treatment dose to small areas (submillimeter). Knowledge of tolerance levels to ionizing radiation of different organs can be used in RT dose-planning to restrict a specific dose (dose-constraint) or treated volume to an organ using either a single value, such as the mean dose to the organ, or by multiple dose-volume constraints [30].
Toxicity
The limiting factor in RT is toxicity of the normal tissues. The greatest challenge in radiotherapy is thus to optimize disease control while minimizing toxicity to the surrounding normal tis-sue.
Toxicity has traditionally been divided into two categories: acute reactions, defined as effects that occur within 90 days after start of RT, and late reactions which develop ≥90 days after treatment (and up to years after RT). The relevance of this separation in grading and reporting adverse effects has been challenged inter-nationally, however, and identification of potential new temporal patterns of injury are encouraged [31].
Common acute reactions during treatment of HNSCC are pain, mucositis, dysphagia, xerostomia, loss of taste, mucosal edema and erythema, skin erythema and moist desquamation. Common late reactions include xerostomia, dysphagia, mucosal edema and skin fibrosis [32].
Such endpoints generally have been graded on four- or five-point scales [33]. Adverse event reporting in cancer treatment, and specifically radiation oncology have been the Common Terminol-ogy Criteria for Adverse Events (CTCAE) [31] and the LENT/SOMA scale [34-36]. LENT is an acronym for Late Effects Normal Tissues, while SOMA defines toxicity from Subjective, Objective, Man-agement-related and Analytic measures (i.e. blood test, CT or the like). Graded toxicity scorings can be converted into binary data to form the basis for analyzing radiation dose-response relation-ships that can be used to predict toxicity in patients undergoing radiation treatment.
Normal tissue complication probability (NTCP)
mod-eling
Since radiation of normal tissues is inevitable during external beam RT, knowledge about tolerance levels of OARs to ionizing
radiation is necessary to distribute the radiation dose appropri-ately to avoid unacceptable toxicity. With increasing radiation dose, the frequency (i.e. incidence) and the severity (i.e. grade) of radiation effects may increase.
In radiobiological studies, the impact of radiation dose on normal tissues (and tumor tissue) is often demonstrated by dose-response (dose-incidence) curves. Dose-dose-response curves describe the probability of a specific response (i.e. radiation effect) as a function of dose. They generally have a sigmoid (S-) shape where the risk of a given effect goes from 0% or close to at no radiation and close to 100% at high doses. Several mathematical functions have been used to model the relationship between radiation dose and normal tissue complication probability (NTCP); most fre-quently the Poisson, the logistic, or the probit models [37,38]. For endpoints requiring prolonged follow-up, such as late normal tissue reactions, these models may be embedded in a so-called mixture model, where the time to occurrence of the endpoint is also taken into account [39]. Dose-constraints as described above are derived from NTCP models and can be defined as dose-volume restrictions for a clinically acceptable risk of a given radia-tion effect [21].
In 1991, Emami et al. [40] pooled information regarding partial or total organ tolerance doses with the clinical experience and judgments of clinicians and researchers, and published tolerance doses for various organs, including the thyroid gland. The subse-quent development of 3D-CT based treatment planning and the possibility of calculating precise doses to normal tissues have enabled studies of normal tissue response in relation to different dosimetric parameters. In 2010, extended analyses applying volume modeling of normal tissue reactions in clinical radiothera-py were published in the Qualitative Analysis of Normal Tissue Effects in the Clinic (QUANTEC) papers [41]. However, data re-garding normal tissue reactions of the thyroid gland was omitted by the QUANTEC group.
The thyroid gland
The thyroid gland is located in the lower region of the neck, in relation to the lower part of the larynx and upper part of the trachea. The gland consists of two lobes, right and left, which are connected through the isthmus. The size of the thyroid gland in the Danish population was 15-28 ml [42], but after the introduc-tion of salt iodizaintroduc-tion around 2000, this size seems to have de-creased [43].
The follicle cells of the thyroid gland synthesize and secrete the hormones thyroxine (T4) and triiodothyronine (T3). These thyroid hormones regulate the metabolism of tissues and organs in man, and are tightly genetically regulated in healthy individuals, as shown e.g. in twin studies [44]. Thyroid hormones also influence most of the pathways of intermediary metabolism. If thyroid hormones are deficient, pathways of carbohydrate, lipid and protein metabolism are slowed, as is pathways’ responsiveness to other regulatory factors. Thyroid hormones are also essential for normal body growth and the development of the central nervous system, especially in the pre- and postnatal period.
Thyroid function is regulated by a delicate negative feedback loop between mainly the pituitary and the thyroid through secretion of thyrotropin (TSH) from the anterior pituitary, and T4 and T3 from the thyroid. TSH secretion is stimulated by thyrotropin-releasing hormone (TRH) from the hypothalamus but a complicated net-work of hormonal and non-hormonal factors, which will not be dealt with here, influences the serum TSH level. The hypothalam-ic-pituitary-thyroid axis follows a diurnal circadian rhythm, with
low TSH levels in the daytime and higher levels at night [45,46] in individuals following a normal day-night sleep-awake rhythm.
Pathophysiology and mechanism of
radiation-induced injury
Damage to the thyroid gland by ionizing RT is due to a variety of pathological mechanisms. These include vascular effects in the epithelium of small vessels and the development of fibrosis of capsular structures, while the damage to the follicular epithelial cells is considered less important [47,48]. Ultrasonography has shown that changes in both the blood vessels and the gland echogenicity occur during RT, and subsequent development of acute thyroiditis was correlated to vessel changes [49]. The pre-dominant late morphological changes consist of atrophy, chronic inflammation (thyroiditis) with lymphocytic infiltration, vascular fibrosis, and focal and irregular follicular hyperplasia [47,50,51]. The mechanisms for radiation-induced hypothyroidism are largely unknown but are assumed to be related to vascular damage [48].
Hypothyroidism
Hypothyroidism (HT) is defined as decreased function of the thyroid gland and is characterized by TSH above the normal range (at Odense University Hospital the normal range is 0.3-4.0 mIU/l [52]). HT can be subclinical HT (SHT) with elevated TSH and nor-mal T4 and T3, or overt HT with elevated TSH and T4 and/or T3 below the normal range.
Hypothyroidism, including SHT, has been linked to a number of metabolic changes such as hyperlipidemia [53], coagulopathy [54], endothelial dysfunction [55] and other cardiovascular disor-ders [56,57]. These changes are associated with increased mor-bidity such as cardiovascular diseases, lung diseases and diabetes mellitus [58]. HT has also been associated with psychiatric mor-bidity [59] and impaired quality of life [60,61]. Although effects on mortality have been uncertain [62], two recent Danish studies have found increased mortality in patients with overt HT com-pared to euthyroid controls [63,64]. While SHT has been linked to an increased risk of coronary heart disease [65,66] and mortality [67-70], the effect on overall mortality is still a matter of debate [64,66,67,69,71] and duration of thyroid dysfunction may matter [64]. For these reasons, radiation to the thyroid gland must be considered in RT of head and neck cancer.
The prevalence of HT is 1-2% [72]. In Denmark, the lifetime risk of overt HT has been reported to be 2.7% (with a 3:1 female pre-dominance) [73]. The prevalence of SHT increases with age and in the age group 60-65 years the prevalence is 7.1% for women and 1.6% for men [74]. Substitution treatment with Levothyroxine is indicated in overt HT and some cases of SHT [75].
Development of HT is influenced by a number of factors such as gender [73], genetic predispositions [76] and environmental factors of which iodine intake and cigarette smoking are best characterized [77-79]. In a Danish study of overt HT, Carlé et al. [73] found that the dominant cause of HT was spontaneous HT (85%), mostly of autoimmune origin, while non-spontaneous HT was caused by post-partum thyroiditis (4.7%), medications such as Amiodarone (4.0%) or Lithium (1.6%), subacute thyroiditis (1.9%), congenital (1.6%), and previous treatment with radioio-dine, external beam radiation and surgery (1.8%). Importantly, the prevalence of HT after external beam radiation may well be underestimated, since measurements of TSH after RT have until now not been performed routinely in Danish oncology centers.
Background for the PhD project
Radiation- induced HT (RIHT) was a recognized late effect of RT to the neck when this PhD project was initiated [47,80-95]. Howev-er, the reported incidences varied significantly as the design, endpoint, and treatment regimes in previous studies were differ-ent. Overt HT was reported in 6-20% of head and neck cancer patients [80,81,83,85,90,95] and SHT in 24-50% [82,87,88,91-93,95]. The role of chemotherapy as a risk factor of RIHT was unclear [84-86], but surgery seemed to be critical [81-83,87,89,94,95]. Table 1 shows an overview of studies. No relevant Danish data was available on the incidence of RIHT, and TSH assessment after RT had not been part of the national routine follow-up of head and neck cancer patients. Furthermore, the tolerance dose of the thyroid gland to ionizing radiation was poorly defined. Data had been derived from only a few studies that were able to report calculated absorbed doses to the thyroid gland (see Table 1). Consequently, the radiotherapy units of Dan-ish oncology centers did not routinely consider calculated radia-tion doses to the thyroid gland when optimizing radiaradia-tion treat-ment plans.
Aims
Overall aims of the PhD project
1. To estimate the incidence of biochemical hypothyroid-ism in a large cohort of patients with head and neck squamous cell carcinoma (HNSCC) of the oral cavity, oropharynx, hypopharynx, and larynx treated with de-finitive radiotherapy and no surgery, and to assess the time-course of the development of hypothyroidism. 2. To establish a dose-response relationship for
biochemi-cal hypothyroidism by assessing the absorbed radiation doses in the thyroid gland in individual patients and thus to estimate the tolerance level of the thyroid gland to ionizing radiation.
Aims of the studies
Study I:
1. To identify risk factors for hypothyroidism after defini-tive radiotherapy for HNSCC.
2. To establish an NTCP dose-response relationship for bi-ochemical hypothyroidism.
3. To provide clinical recommendations for thyroid con-straints in dose planning for radiotherapy.
Study II: Validation of input data
1. To evaluate the variability of estimated NTCP values from the mixture NTCP model derived in study I and to assess the intra- and inter-observer variability in deline-ation of the thyroid gland.
Study III: Validation of the NTCP model
1. To investigate risk factors for hypothyroidism in a new, independent population of HNSCC patients.
2. To generate an (equivalent) NTCP model for comparison with the original data set to test the robustness of the previous NTCP model.
PHD THESIS DANISH MEDICAL JOURNAL
Table 1. Overview over studies on radiation-induced hypothyroidism (RIHT). (Studies published after the start of this PhD project have a grey background).
PHD THESIS DANISH MEDICAL JOURNAL
MATERIAL AND METHODS
This thesis is based on three studies. The first study was a retro-spective cohort study from the Department of Oncology, Odense University Hospital (OUH), studying the incidence and risk factors for RIHT and development of an NTCP model for RIHT after defini-tive radiotherapy for HNSCC. The second study was a validation of the input data in Study I, assessing the impact of observer varia-bility in delineation of the thyroid gland on the estimates from the NTCP model. The third study was a validation of the NTCP model from Study I on a similar cohort of HNSCC patients treated at another center, the Department of Oncology at Aarhus Univer-sity Hospital (AUH).
An overview of the designs, methods, data and analyses are pre-sented in Table 2. Further details are provided in the following sections.
Table 2. Overview of the methods used in the three studies of this thesis.
Study I
Study population
Participants were patients with HNSCC in the oral cavity, orophar-ynx, hypopharynx or larynx treated with definitive RT (66-68 Gy in 33-34 fractions) with or without concomitant chemotherapy at the Department of Oncology, OUH, in the period 2002-2010 (cohort1). Inclusion- and exclusion criteria and patient character-istics are described in Paper I.
2002 was chosen as the start of the study period, as all head and neck cancer patients treated at OUH from 2002 received treat-ment according to a CT-based 3D treattreat-ment plan that had been stored after treatment.
Material
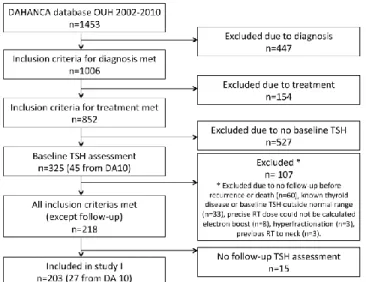
The study was designed as a retrospective cohort study with both prospective and retrospective collection of TSH assessments. HNSCC patients treated in the period 2002-2010 were identified from the DAHANCA database, see Figure 1. The clinical data from this database were crosschecked with patient charts. Missing data values were corrected, and information about thyroid disease and medication were collected.
TSH assessment
Patients were considered euthyroid if they had a normal TSH measurement within the last year before RT or in the first two weeks of RT (baseline TSH). Follow-up TSH assessments were obtained after the end of RT.
All TSH analyses were done at the Department of Biochemistry and Pharmacology (KBF) at OUH and the data were extracted from the OUH laboratory database (Netlab). All TSH assessments in the database were taken into account (i.e. from all OUH de-partments and from general practitioners in the county of Funen). The time period for data extraction was January 2001- March 2012.
Until 2006, serum TSH was measured using a time-resolving fluoroimmunometric assay (AutoDELFIA, Perkin Elmer, Turku, Finland), reference interval 0.30-4.0 mIU/l [52]. The intra- and inter-assay coefficients of variation (CVs) at serum TSH concentra-tions 0.046-17.6 mIU/l were 1.3-4.7% and 1.7-3.7%, respectively. From 2006 to September 2010, serum TSH was analyzed using a solid-phase, two-site chemiluminescent immunometric assay (third generation assay) on Immunolite 2000 equipment (Sie-mens, Erlangen, Germany). The intra- and inter-assay CVs at serum TSH concentrations 0.32-39 mIU/l were 3.8-5.3% and 4.5-6.4%, respectively. After September 2010, plasma TSH has been analyzed using a different third generation assay (Architect i system, Abbot, Wiesbaden, Germany). The intra- and inter-assay CVs at plasma TSH concentrations 0.088-28.4 mIU/l were 1.4-5.0% and 1.7-5.3%, respectively. To ensure compatibility between the different equipment, comparisons were done at KBF when equipment was replaced, and the same reference interval for TSH has been applied for all three methods.
Before 2008, TSH assessments of HNSCC patients were obtained at the Department of Oncology, OUH, when indicated. In 2008, a guideline for routine assessment of thyroid function in HNSCC patients was implemented, i.e. TSH and T3/T4 when indicated, before RT and once a year after RT. To include more patients from the first half of the study period, additional baseline TSH assess-ments were obtained from blood bank samples collected from participants in the DAHANCA 10 trial [111] (EDTA-plasma stored at – 80°C, analyzed in June 2011). Blood samples from 45 patients were analyzed, and 27 of these were included in the study. Anal-yses of TSH on EDTA-plasma compared to Li-heparin plasma were validated at KBF, OUH, by collecting blood samples from 20 healthy individuals (10 men and 10 women) aged 20-70 years. Analyses were done using the standard assay on Architect and showed no significant differences between the two types of plasma (p=0.423).
Patients eligible for this study who had finished scheduled follow-ups were invited for additional TSH assessment. Of the 38 pa-tients invited, 23 (61%) accepted and gave a blood sample after informed consent.
Delineation of the thyroid gland
Treatment dose-planning was done in Pinnacle3 (Philips Healthcare, The Netherlands). The thyroid gland was not previ-ously delineated, so the author (MFR) delineated the gland in all treatment plans. After delineation, the precise treatment dose to the gland was calculated and the corresponding dose-volume histograms (DVH) were exported for analysis. Thyroid gland vol-ume (Vthyroid) and mean (Dmean), maximal (Dmax) and minimal dose (Dmin) as well as V10 (defined as the percentage volume receiving 10 Gy or more), V20, etc. up to V70 were extracted from the DVHs.
Five of the included patients received treatment from two treat-ment plans. Here, the dose to the thyroid gland was evaluated in each case and if the dose per fraction was not significantly differ-ent in the two plans, the treatmdiffer-ent plan used for the majority of fractions was chosen (n=4). Otherwise, the doses were corrected for the number of fractions given and summarized (n=1).
Figure 1. Inclusion of patients in Study I
Endpoint
The endpoint of the study was biochemical hypothyroidism, defined as plasma-TSH above the normal range. The normal range in the OUH laboratory is 0.30-4.0 mIU/l [52]. The first TSH as-sessment above the normal range was defined as an event. Follow-up was defined as time from the last day of RT to the last TSH assessment or censoring.
Statistical methods
Data were initially analyzed using standard logistic regression. Univariable analyses were performed first. Subsequently, the two most significant factors were entered into a multivariable model and the significance of the other covariates was tested by enter-ing them into the model one by one. 95% confidence intervals (CI) were calculated using the profile likelihood method, and p-values were derived from the likelihood ratio (LR) test. The variables considered in the analyses were tested for possible interactions. Thereafter, data were analyzed using a mixture model. This was done using the logistic model and incorporating a latent time distribution. First, data were analyzed using two different time distributions, a Weibull distribution and a log-logistic distribution, representing two different classes of mathematical functions. Performance of the two models were evaluated by the models -2 log likelihood (-2LL) and residuals. There were no statistical dif-ferences between the two models, but the Weibull distribution showed slightly better -2LL and was therefore chosen for further analyses.
All parameters were optimized by maximum likelihood from the entire data set [39,112]. The mixture model was analyzed with univariable and multivariable analyses equivalently to the logistic model described above.
The significant variables from the multivariable analysis were applied to the NTCP models. The 95% CI for the NTCP models were derived by bootstrapping (10,000 samples).
The cumulative incidence of HT was calculated using the mixture model.
Study II
Study population
The thyroid gland was delineated in 246 clinically administered treatment plans in Study I by MFR, and 50 of these plans were randomly selected for this study.
Patient characteristics and treatment plans are described in Paper II.
Material
The study was designed to assess intra- and inter-observer varia-bility. The first 50 treatment plans in which the thyroid gland was delineated, were excluded from the study to avoid a potential bias of a ‘learning curve’ in delineation. Fifty other treatment plans were selected from a randomly ordered list for i) blinded re-delineation of the thyroid gland by MFR (intra-observer) and ii) a corresponding delineation of the thyroid by a radiation oncolo-gist, Jørgen Johansen (JJ) (inter-observer). Re-delineation was done at least three months after the first delineation. Guidelines were made for blinding the delineated structures in the dose plans and naming the structures, but no guideline for the delinea-tion of the thyroid was given.
Thyroid Dmean (Gy) and Vthyroid (cm3) from the new delineations were obtained from the DVHs in the dose-planning system equiv-alent to Study I.
Statistical methods
Differences in intra- and inter-observer delineated Vthyroid, Dmean and estimated NTCP of HT were assessed by Bland-Altman plots [113]. Wilcoxon signed-rank test was used to check for systematic differences and Spearman’s rank correlation was used to test for correlation between the paired differences and mean Vthyroid, Dmean and NTCP, respectively.
The correlation between the (random) variation and mean thy-roid volume was tested by dividing the paired differences into five equally-sized groups, depending on mean thyroid size, and testing the SDs of these groups with Spearman’s rank correlation. The Sørensen-Dice similarity index (DSI) was calculated for over-lap measure of delineated Vthyroid:
For assessment of spatial variations in delineated volume, the thyroid glands were manually divided into two lobes, and map-ping of each lobe was done using the center of mass as origin and 100 measurement points in both latitudinal and longitudinal direction (10,000 surface points in total). The distance from the center to the contours was measured, including the sign (plus/minus) indicating whether the first contour was inside or outside the second contour. Based on these spatially resolved values, population averaged values (systematic deviations) as well as SD (random deviations) could be calculated and visualized as a color surface plot of the “mean thyroid gland” using the color to illustrate the local deviation.
Study III
Study population
Participants were patients treated with definitive RT at the De-partment of Oncology, Aarhus University Hospital (AUH). Patients were included after a follow-up TSH measurement that was taken when they attended the outpatient clinic for routine follow-up (cohort2). Inclusion and exclusion criteria are described in Papers I and III, and patient characteristics are presented in Paper III.
Material
The study was a retrospective cohort study to validate the NTCP model from Study I. The study was conducted at the Department of Oncology, AUH, in collaboration with Odense University Hospi-tal (OUH).
TSH assessment
TSH had not previously been assessed routinely after RT at AUH, but was implemented as a routine assessment for patients in the outpatient clinic at the time of this study (partly on the basis of the findings from Study I). A baseline TSH was obtained. Due to the study design and lack of routine blood sampling, only one follow-up blood test was obtained from the AUH study group. To reduce bias due to analysis at different laboratories, all blood samples collected during the study time period were analyzed at the KBF at OUH. Blood samples were centrifuged, pipetted and frozen and sent to Odense for routine analysis. Blood samples were analyzed for TSH, TPO-antibodies and, if TSH was outside the normal range, total T3 and T4 and free T3 and T4. Baseline TSH and TPO-antibodies were analyzed on blood samples (lithi-um-heparin plasma stored at -80o C) from the blood bank at the Department of Experimental Clinical Oncology, AUH. Analyses were done in March 2013.
After collection of a blood sample, the patient’s chart was re-viewed to assess if the inclusion criteria were met, and the data-base from the blood bank was searched for a data-baseline blood sample. For the patients included in the study, all data were crosschecked with the DAHANCA database, and missing data values were corrected. The inclusion process is shown in Figure 2.
Figure 2. Inclusion of patients in Study III
Delineation of the thyroid gland and extraction of dose
The thyroid gland was delineated by the author (MFR) in all treatment plans using Eclipse (Varian, Palo Alto, USA). Thyroid volume and radiation doses were calculated. Afterward, the treatment plans were exported as DICOM RT data to the DICOM Collaboration system (“the CIRRO-server”) at Odense University Hospital [114]. Thyroid Dmean and Vthyroid were extracted from the recalculated DVHs in the database. The database has a built-in data validation and verification function, and the dose and vol-ume were also double-checked with the values extracted from Eclipse after delineation.
In cohort2, 32 patients received treatment from two treatment plans or more. It was therefore necessary to consider a uniform method to calculate Dmean to the thyroid gland in these treatment
plans. Eleven patients were treated using two or more treatment plans from one CT scan, while 21 patients were treated using two or more treatment plans from two or more CT scans. The Vthyroid of the first clinically applied treatment plan was chosen for fur-ther analysis of volume. The different treatment plans were ex-ported to the CIRRO server with the total dose corrected for the number of fractions given from the corresponding dose plan. Dmean values from multiple dose plans in an individual patient were extracted from the CIRRO server and the doses were then summarized.
Endpoint
The endpoint was biochemical hypothyroidism and follow-up was defined as the time from the last day of RT to the TSH assessment (as in Study I).
Statistical methods
The study was a validation study of the mixture NTCP model developed in Study I. Data from cohort2 were thus analyzed in the same way as in Study I, and the results were compared with cohort1.
Due to only one TSH assessment in cohort2 compared to multiple blood samples in cohort1, sampling bias was considered.
To reduce this potential bias in the comparison of the two co-horts, a new cohort (cohort1S) was generated from cohort1 by taking only one follow-up TSH-assessment into account. This was done by 10,000 Monte Carlo samplings. Analyses on cohort1S were done on each individual sample and the reported values and confidence intervals were obtained from the distribution of val-ues from all samples (median and standard deviation).
Latency could not be estimated from cohort2, therefore, the time factor (Weibull distribution) from cohort1 was fixed and applied to both cohort1S and cohort2.
More detailed descriptions of the statistical methods are given in Papers I and III. Analyses were done using STATA 11 and 13 and MATLAB version 2012b. All statistical tests were two-sided and a p-value <0.05 was considered statistically significant.
Ethics
The studies were approved by the Regional Ethics Commit-tees for Southern Denmark (S-20110027) and the Danish Data Protection Agency (J.nr. 2011-41-575 (Study I) and J.nr. 2012-41-0899 (Study III)). All patients invited for additional TSH measure-ment signed an informed consent form before the blood sample was collected.
RESULTS
The results of the three studies are summarized here. More de-tailed results, tables and figures are provided in the three papers (see appendix).
Hypothyroidism after primary radiotherapy for head and neck squamous cell carcinoma: normal tissue probability modeling with latent time correction (Paper I)
Two hundred and three patients were included in cohort1. The cohort was representative for all HNSCC patients treated with definitive RT at our institution in that time period (data not shown). A single follow-up TSH measurement was obtained in 96 patients and two or more (range 2-11) measurements were ob-tained in 112 patients. HT occurred in 35 (17%); 12 women (26%) and 23 men (15%). In 31 of these patients, free T4 or total T4
were available, and on the basis of this, five were diagnosed with overt HT and 26 with SHT.
The ultimate incidence of HT estimated from the mixture model was 26%, which corresponded to the 5-year risk. Figure 3 demon-strates that HT is most likely to develop within the first two to three years after RT.
Both logistic and mixture multivariable analysis found that higher Dmean and a small Vthyroid were significant risk factors for HT. Radia-tion technique (concomitant boost technique in the initial treat-ment period vs. integrated boost (IMRT) in the last period) was a significant factor in logistic analysis, but not when taking latency into account. None of the other factors were significant in multi-variable analysis, including concomitant weekly Cisplatin. Two NTCP models were developed that included the two signifi-cant factors from the multivariable analysis, Dmean and Vthyroid (Figure 4). NTCP values were calculated from the following equa-tions: NTCP= (1+exp(-s))-1 Logistic model: S=-2.019 + (0.0821 * Dmean) - (0.189 * Vthyroid) Mixture model: S= -1.235 + (0.1162 * Dmean) - (0.2873 * Vthyroid)
On the basis of the mixture NTCP model, we proposed dose con-straints for the thyroid gland in RT treatment planning of 26 Gy, 38 Gy, 48 Gy and 61 Gy (Dmean) to keep the 5-year risk of RIHT below 25%, for thyroid volumes of 10, 15, 20 and 25 cm3, respec-tively.
Two methods for analyzing clinical data after RT of HNSCC pa-tients were demonstrated, a logistic model and a mixture model that took latency into account, and these results showed the importance of taking latency into account in NTCP modeling. Conclusion:
Biochemical hypothyroidism is a frequent late effect after radio-therapy, with an estimated 5-year incidence of 26% in a HNSCC cohort. The risk of RIHT is significantly associated with small pre-treatment thyroid volumes and high thyroid mean dose. Compari-son of the logistic and mixture models demonstrated the im-portance of latent-time correction in NTCP modeling. Individual dose constraints based on thyroid volume should be considered in radiation treatment planning.
Figure 3. Cumulative events (with 95% CI) are shown on the left Y-axis, indicating the time to development of HT if HT occurs. Cu-mulative incidence (without 95% CI) of HT in the study population is shown on the right Y-axis.
Figure 4. NTCP models at thyroid volumes of 10, 15, 20 and 25 cm3, for the mixture model with 95% CI (blue lines) and the lo-gistic model with 95% CI (red lines).
Variation of normal tissue complication probability (NTCP) esti-mates of radiation-induced hypothyroidism in relation to chang-es in delineation of the thyroid gland (Paper II)
This study assessed the impact of intra- and inter-observer varia-bility in delineation of the thyroid gland on the risk estimates from the derived mixture NTCP model in Study I. Small mean (systematic) differences were found in intra- and inter-observer variability in Vthyroid, 0.4 cm3 (SD±1.6) and 0.3 cm3 (SD±1.8), and in Dmean, -0.5 Gy (SD±1.0) and 0.0 Gy (SD±1.3), respectively (Fig. 5). The corresponding mean differences of the estimated NTCP val-ues for RIHT due to intra- and inter- observer variations were small at -0.4% (SD±6.0) and -0.7% (SD±4.8), respectively. Howev-er, as demonstrated in Fig. 5 E and F and by the relatively large SD on the estimated risk of RIHT, there may be large differences in estimated risk for the individual patient due to variability be-tween delineations.
Mean Sørensen-Dice similarity index was 0.88 (SD± 0.03) for intra-observer delineations and 0.85 (SD ±0.04) for inter-intra-observer delineations.
The spatial differences in delineated thyroid gland volume showed that the most pronounced mean (systematic) variability was around the middle of the thyroid gland. For the majority of the surfaces, a variability of ±0.02 cm was found in both intra- and inter-observer plots. The highest local random variations were in the caudal and medial parts of the lobes, with a local SD of ± 0.1-0.2 cm. For the majority of the surfaces, random variation with local SD of ± 0.06-0.1 cm was found. This demonstrates that the local variation in delineations is generally small.
Conclusion:
The variation in predicted risk of RIHT was small for the study population as a whole. The derived NTCP model was shown to be robust towards observer variation in delineation of the thyroid gland. However, for the individual patient, there might be pro-nounced differences in estimated risk due to this variation, as reflected by the relatively large SDs of the risk estimates.
Figure 5. Bland-Altman plots demonstrating intra-observer (left column: A, C , E) and inter-observer (right column B, D, F) varia-tion in delineated volume (A, B), calculated mean dose (C, D) and variations in estimated risk of radiation-induced HT (E, F). Validation of a normal tissue complication (NTCP) model for radiation-induced hypothyroidism in two independent cohorts (Paper III)
A cohort of 198 patients (cohort2) was obtained after a single assessment of TSH after RT. There were no statistical differences between cohort1 and cohort2 on most patient characteristics, however, Dmean and baseline TSH were significantly lower in co-hort2.
Analyses using the mixture model with a fixed time factor were performed on cohort1, cohort2 and the sampled cohort1S. High Dmean and a small Vthyroid were found to be significant risk factors in all three cohorts. Baseline TSH was significant in cohort2; how-ever, this was not included in the NTCP model, due to the deci-sion to develop a model equivalent to the NTCP model from cohort1 (NTCP1).
Direct comparison of NTCP1 and the NTCP model (NTCP2) from cohort2, was not possible due to a discrepancy in the number of TSH samples. This was corrected for by developing a further NTCP model from cohort1 (NTCP1S) with just a single sample from each patient. When the number of TSH assessments was taken into account, the estimated risks were similar. Figure 6 shows dose-response curves for the three NTCP models. Differences in esti-mated risk between NTCP1 and NTCP2, and NTCP1S and NTCP2 are shown in Figure 7.
The NTCP model previously developed from cohort1 was: NTCP = (1+exp (-S))-1 , where:
S=-1.235 + (0.1162 * Dmean) – (0.2873 * Vthyroid)
The NTCP models for cohort1S and cohort2 with fixed latent time distribution resulted in the following values:
NTCP1S: S= -4.9177 + (0.18 * Dmean) – (0.30 * Vthyroid) NTCP2: S= -4.7071 + (0.17 * Dmean) – (0.28 * Vthyroid) The clinical recommendations and the latency function from study I were not validated in this study due to the differences between the cohorts.
Conclusion:
As in study I, this validation cohort showed that, a small pre-treatment thyroid volume and high mean dose were significant risk factors for RIHT. Direct comparison between the previously developed NTCP1 model and the NTCP2 model from the
valida-tion cohort was not possible. When taking the number of TSH assessments was taken into account, however, the two new models NTCP1S and NTCP2 were similar.
Figure 6. Dose-response curves for the three NTCP models for selected thyroid volumes: NTCP1 (black), NTCP1S (red) and NTCP2 (blue).
Figure 7. A) The risk of developing RIHT, estimated from NTCP1 (multiple blood samples) and NTCP 2 (single blood samples). B) The risk of RIHT, estimated from NTCP 1S and NTCP2 (both one blood sample).
DISCUSSION
The three studies in this thesis address risk predictions of radia-tion-induced hypothyroidism (RIHT) after treatment for head and neck squamous cell carcinoma, as well as validation issues in relation to a normal tissue complication probability (NTCP) model for RIHT.
Incidence of RIHT
Study I estimated the 5-year actuarial probability and the ultimate probability of RIHT in cohort1 to be 26% [95% CI: 18-36%]. Most of the patients who eventually developed RIHT did so within the first two to three years after RT. A peak in development of RIHT 1.5-3 years after RT is also reported in other studies
[81,83,88,91,92,109]. Some have described late occurrences up to 10-27 years after RT [81,84,85,94]. However, it should be noted that these studies do not consider other causes of HT.
The actuarial probability in Study I is in accordance with findings from a number of previous studies [81,85,97], but was somewhat lower than in most studies of RIHT [88,91,94,99,101,102,107]. This lower incidence may reflect the exclusion of surgically treat-ed patients and lower RT treatment doses, as describtreat-ed below. The high variability in reported incidence reflects the heterogene-ity in study populations in the literature, which should be taken into account when comparing the studies. Surgery can
significant-ly impact the risk of developing RIHT [89,115] and the incidence of RIHT is likely to be higher if surgical patients are included. The impact of a high radiation dose to the thyroid gland on the risk of RIHT is well established. This was demonstrated in Study I and III and is supported by many other studies [101,104,107-109,115]. The actual doses absorbed by the thyroid gland should thus be considered when comparing incidences of RIHT and also during treatment planning to avoid RIHT.
During the last 10-15 years, the addition of chemotherapy has become standard in curative treatment of HNSCC. However, in contrast to surgery, concomitant chemotherapy (i.e. platinum and 5-FU) of HNSCC does not seem to increase the risk of RIHT [101,102,115], as supported by our findings. Nor did we find gender to be a risk factor, in contrast to other studies [84,96,97]. Pretreatment Vthyroid on the other hand, was found to significantly affect the risk of RIHT in Study I and III. This finding has also re-cently been noticed in other clinical studies [91,100,101,109]. One explanation for this is the new ability to consider and deter-mine the thyroid volumes in CT-based dose planning systems. Alterio et al. [96] suggested that relatively higher levels of TSH were due to the smaller glands in women. This is supported by the findings in Study I, where, women had significantly smaller Vthyroid than men, but in subgroup analyses Vthyroid retained its significance in both men and women.
Do we need an NTCP model for RIHT?
As the cancer-specific survival for locally advanced HNSCC has doubled in Denmark since the first DAHANCA studies in the 1970s [116], the prevalence of HNSCC has increased as well. Due to the possible long-term consequences of hypothyroidism, dose con-straints for the thyroid gland are needed in treatment planning for radiotherapy.
The clinically acceptable risk of RIHT is a matter of debate. However, target coverage of tumor volumes should never be compromised to reduce the dose to the thyroid gland. We pro-pose to keep the risk of RIHT below 25% with respect to individual thyroid volumes, i.e. keeping thyroid Dmean below 26 Gy, 38 Gy, 48 Gy and 61 Gy for thyroid volumes of 10, 15, 20 and 25 cm3, re-spectively. The recommendation of taking both Dmean and Vthyroid into account is supported by Boomsma et al [101]. Others have recommended the use of threshold values for constraints, using different percentage values of V30 [99,100,107], V45 [108,109] and V50 [110]. However, due to the high correlation between these dose-volume parameters, we found that Dmean was a relevant descriptor of the dose distribution within the thyroid gland (dis-cussed in the section “Statistical considerations”).
Knowledge about the dose-response relationship in an OAR ena-bles us to balance the radiation dose to that organ against the dose to the surrounding normal tissues. Also of importance is that if the dose is below the tolerance level of an organ, the effect of further dose reductions may be negligible. Defining constraints for the thyroid gland allows for treatment planning optimization of thyroid doses in relation to other OARs in the neck area, includ-ing the brain [117], the pituitary [118], the parotid [119] and submandibular glands [120], swallowing organs [28,121] and the larynx [122]. Median Dmean was significantly lower in cohort2 than cohort1, which may be ascribed to a dose-planning strategy that had been implemented at AUH to reduce treatment dose to the larynx (to reduce the risk of radiation-induced dysphagia), and led to a lower dose to the adjacent thyroid gland. This is in accord-ance with two other studies that have found that doses to the thyroid gland were higher in IMRT plans than 3D-CRT, when the
thyroid gland was not included as a constraint during the dose optimization process [91,106]. However, thyroid doses could be reduced and target coverage maintained using a thyroid dose constraint [91].
Uncertainties of NTCP models
Study II showed that, for the study population as a whole, the NTCP estimates of our mixture model were robust against ob-server variability in delineation of the thyroid gland and the cor-responding variability in Dmean. The low variability between thy-roid gland delineations may due to the thythy-roid gland being relatively well-defined on CT scans because of its well vascular-ized tissue [123] and high content of iodine [124,125]. For some individual patients, however, there were considerable differences in estimated risk of RIHT (up to 26%), especially when the esti-mated risk of RIHT was on the steep part of the dose-response curve. Hence, precise delineation of the thyroid gland is still of importance for consistency of NTCP estimates.
Figures 4 and 6, as well as Table 3 in Paper I, show the 95% CI of our estimated dose-response curves and suggested thyroid con-straints. These demonstrate that it is important to consider not only the numerical value, but also the statistical uncertainty of an NTCP estimate or constraint in treatment planning. Furthermore, it must be kept in mind that a population-based NTCP model is only a prediction based on a standard population, thus there can be large uncertainties in the predicted probability for an individu-al patient, who typicindividu-ally deviates from the average population. Marks et al. [126] used the term “host factors” to describe specif-ic biologspecif-ical features that might affect radiation sensitivity in the individual. In the current context, these might be the presence of thyroid autoantibodies or thyroid nodularity before RT. The pres-ence of autoantibodies and their impact on the risk of RIHT is not fully elucidated [50,89,105] and should be considered in future NTCP modeling studies, or at least when assessing the individual patient risk of developing RIHT.
Despite all the uncertainties related to NTCP models, they will often be our best recommendation for considering effects on normal tissues and are therefore valuable tools for optimization of dose planning.
Choice of endpoint
Biochemical hypothyroidism was chosen as the endpoint for statistical analyses and NTCP modeling. This is the usual endpoint in RIHT studies, in both the clinical [50,82,84,86,87,91-96,109] and radiobiological [101,102] settings and corresponds to a grade 1 or more toxicity on the CTCAE classification [127] and the ana-lytical SOMA/LENT classification [128]. A single TSH assessment above the normal range was classified as an event, as also used in epidemiological studies. So far, only one group studying RIHT has used two elevated TSH assessments as endpoint [99,100]. The choice of endpoint reflects the choice of a pragmatic, patient-centered approach to the development of NTCP models rather than a mechanistic and biology-centered approach [36]. A TSH level >4.0 (irrespective of the baseline TSH value) leads typically to clinical action such as further blood tests, additional control or follow-ups, or possibly Levothyroxine treatment. Other endpoints could also have been chosen, and a biological effect measure was in fact evaluated.
As stated in Paper I, we also analyzed the data using the change in TSH (ΔTSH >2.7 mIU/l) from baseline to follow-up as endpoint. This threshold was chosen to produce the same number of pa-tients developing RIHT as with the clinical endpoint of TSH>4.0.
From a biological point of view, the endpoint expressing a certain change in TSH might be the best predictor of biological changes in the thyroid gland after RT. The analyses with either TSH >4.0 or a ΔTSH >2.7 as endpoint resulted in very similar dose-response curves, as most patients who experienced an event were classi-fied as experiencing an event using either endpoint.
Uncertainties in TSH assessments
TSH assessments can vary considerably. This was not taken into account either in our studies, or in any other studies of RIHT. Uncertainties in TSH assessment can be divided into pre-analytical, analytical and biological variation [129-131]. Pre-analytical variability relates to the blood sampling procedure as well as handling and storage of blood samples. The blood samples in our studies were taken in a routine setting. Analytical variability relates to the uncertainties of the assays used for TSH analysis. Biological variation can be divided into intra- and inter-individual variations. Intra-individual variation is due to the circadian varia-tion in serum TSH, with the lowest levels occurring in daytime and a nocturnal rise of more than 100% that peaks after midnight [132]. A decrease of up to 50% may be observed from 8:00 to 9:30 in the morning [133]. Moreover, the degree of glycosylation of TSH, non-thyroidal illness, weight change, pregnancy [134] and different medications [134,135] may affect individual TSH levels. There is substantial inter-individual variation in TSH assessments [136], demonstrated by the finding that individual 95% CI are approximately 50% of the reference range for TSH [137]. The relatively narrow individual reference range of TSH in the wide population-based reference range supports the use of ΔTSH as the endpoint for NTCP modeling of RIHT. However, as stated above, the 'patient-centered' endpoint (TSH>4.0) demonstrated similar dose-response relationships to those obtained from ΔTSH analysis.
Validity of the NTCP model
In the QUANTEC report, Bentzen et al. [41] introduced three concepts for validation of NTCP models: face validity, internal validity and external validity. Face and internal validity can be related to the mixture model (NTCP1) developed in Study I and external validity to Study III.
Face validity
Face validity relates to whether the findings of a study are rea-sonable. As expected in study I, an increasing radiation dose to the thyroid gland increased the risk of hypothyroidism. The dose-response relationship for development of RIHT is supported by most studies [80,82,84,95,98,99,108,109] and Dmean has generally been used as dose parameter in corresponding NTCP models for RIHT [101,102].
The thyroid gland is considered to be a “parallel organ” [138] with the follicle cells as functional subunits that are independent of their neighbor cells. In this context, Dmean is considered an appropriate dose parameter for predicting normal tissue toler-ance levels, equivalent to radiobiological investigations of other parallel organs like the parotid glands [119], lung [139], and liver [140]. Vthyroid was not expected to predict the risk of RIHT. How-ever, as mentioned before, the importance of Vthyroid was subse-quently supported by other studies of RIHT [91,100,101]. The study findings appeared intuitively correct and the dose-response curves “made sense” in that the risk of RIHT was zero (or close to) at dose zero and the confidence intervals were
rea-sonable in relation to our sample size and number of events. The NTCP1 model was therefore considered as having face validity.
Internal validity
Internal validity is a consideration of how well the model de-scribes the data. This is typically assessed by plotting the ob-served results against those predicted by the model. However, the mixture model predicts the risk of RIHT to infinite time, while our observation period varied in length from months up to nine years. The predicted risk by the mixture model was thus expected to be higher than the observed risk. Internal validity was there-fore explored in an additional way, by plotting the dose-response curves from our models in conjunction with the actual patients being either responders (equal to 1) or non-responders (equal to 0). This plot demonstrated that there were no events when Dmean was <25 Gy and the number of events in relation to non-events increased with increasing dose on the correspondingly rising dose-response curve.
The data seemed reasonable for both the logistic curves and the curves of the mixture model. Furthermore, when the likelihood ratio test was used to test the statistical significance of adding other parameters to the model, no other factors than Dmean and Vthyroid were statistically significant for the final models. It is thus reasonable to conclude that the mixture model has internal valid-ity in this study.
External validity
External validity relates to how well our mixture model describes other datasets. During the planning of Study III, the meaning of validating a model was considered whether the parameters of the model or the full NTCP model should be validated. The parame-ters of two models might be different, but if they mutually bal-ance each other in the full model so that the risk estimates of the two models are similar, the overall clinical impact of the two models are identical which is a way to seek model validation. Validation of the full model was chosen because it was consid-ered that risk estimates and the corresponding tolerance levels were of interest and relevance in daily clinical radiotherapy prac-tice. The aim was then to develop an NTCP model for use in treatment planning, hence, this approach to validation of the model. Data in Study III were thus analyzed in the same way as the mixture model in Study I.
NTCP1 was not directly comparable with the NTCP model devel-oped in the independent cohort (NTCP2), despite recruitment of another large study population. It became evident that the num-ber of TSH assessments and the definition of endpoint had a significant impact on risk estimates.
Due to the variability in TSH assessments, the probability of expe-riencing an event increases with repeated assessments, when only one assessment of TSH>4.0 defines an event.
Accounting for latency by the mixture model, i.e. considering events occurring at various time-points after treatment, would allow the two study cohorts to be compared despite their differ-ing observation times. But the latency function could not be validated in cohort2 due to only one TSH assessment. A sampling of an identical number of measurements in cohort1 allowed a comparison between the NTCP1S and NTCP2 models, and they (and the corresponding model parameters) were very similar. The aim of validating the NTCP model was not fully achieved. However, Dmean and Vthyroid were also significant risk factors in cohort2, and the NTCP models became very similar when the number of TSH assessments was taken into account. It is
conclud-ed that the NTCP model has external validity and at least, the model cannot be rejected.
Methodological and statistical considerations
Study I
A retrospective design was chosen for this study, both to obtain a study cohort of at least 150 patients and to obtain follow-up over several years for at least a proportion of the included patients. This design gave two main limitations to take into account when choosing the statistical methods for data analysis:
1. The variable number and timing of TSH assessments af-ter radiotherapy.
2. The considerable variation in follow-up time (median 25 months, range 2-94 months), and thus the probability that some patients would develop hypothyroidism after the last TSH assessment (time censoring).
Analysis was first done using a logistic regression model. Due to the above limitations, the standard logistic regression might underestimate the risk of HT so the data were analyzed using a mixture model taking latency into account [39,112]. The accumu-lated Weibull distributions used for analyses represent flexible time distributions, and the time probability distribution is mod-eled based on the observed data. Paper I shows a comparison of data analyses using standard logistic regression and the mixture model, shown in Figure 4 [103]. The mixture model is our pre-ferred model, and was used for modeling in Study III. A review of the DVH’s for the thyroid showed that Dmean was a simple descriptor for dose-distribution in the studied glands. We did not find any other parameter (i.e. V20, V30, etc.) to be a better predictor of the risk of RIHT. For example, if high doses were more harmful that could be demonstrated by Dmean (unpublished data). Dmean was highly correlated with the other dose-volume parameters.
NTCP modeling was done using physical doses and not fraction-size corrected doses, due to the lack of quantitative estimates of the fraction sensitivity (α/β-ratio) of the thyroid gland. An at-tempt was made to estimate the α/β-ratio for the thyroid gland from the dose distributions found in this study. However, this was not possible due to the small variations in dose distribution in the glands receiving almost the same Dmean. Consequently, the DVH’s could not be reduced to equivalent uniform doses used for esti-mation of more advanced models like a Lyman-Kutcher-Burman model (e.g. to evaluate the adverse effects of a high dose to a small part of the gland, compared to a low dose to the whole gland). By using physical doses, the risk estimates are directly applicable in the clinical setting.
The 95% CIs for the NTCP models were derived by bootstrap (Monte Carlo simulation). Bootstrap is a non-parametric method that allows estimation of the size of the model’s uncertainties. This is done by drawing new samples with replacement from the original data, under the assumption that the study sample is representative for the entire population [141,142].
The strength of the study was inclusion of the largest cohort used for NTCP modeling of RIHT, comprising only patients treated with definitive RT and without surgery. Additionally, the cohort was representative for the patient population treated at our depart-ment in that period, with three-quarters of the cohort being men. The exact radiation doses to the thyroid gland were calculated from the clinical treatment planning system. Delineation of the thyroid gland by one observer is thought to be a strength in
mod-eling studies, but this can be discussed in the light of our findings in Study II.
The limitations of the study relate to its retrospective design, the considerable variation in number of TSH assessments and the length of follow-up. Using the hospital database is a possible source of selection bias, There may have been over-selection of patients with symptoms of hypothyroidism (who had TSH as-sessed) resulting in a potential overestimation of RIHT, especially before 2008 when routine assessment of TSH after radiotherapy was established. However, the criteria of a normal baseline TSH and inclusion of patients from the DAHANCA 10 study should partly compensate for this effect.
Study II
This study was designed to investigate intra- and inter-observer variability in delineation of the thyroid gland, and subsequent variability in calculated dose to the thyroid gland and estimated risk of RIHT by the mixture NTCP model. The advantages and disadvantages of three main approaches (comparison of delineat-ed volumes, overlap measures and Hausdorff distance) are dis-cussed below.
Comparison of delineated volumes is the most common approach for assessing variability in organ delineation [143]. A limitation of this method is that it gives no information about overlap: two structures might have the same volume, but different locations. In this study, the variability of delineated Vthyroid, Dmean and esti-mated risk of RIHT were assessed using Bland-Altman plots. These plots allow visual assessment of measurement error (both sys-tematic and random) of continuous variables [113,144]. Overlap measures take both volume and location into account. Two commonly used approaches are the Sørensen-Dice Similarity index (DSI) and the Jacard similarity index (JSI) (also called con-cordance index) [145]. The definitions of the two indexes are different but related; both have the value of 1 when there is perfect overlap between two structures, and a value of 0 when there is no overlap. However, the index for the same partial over-lap is different, and the interpretation of values between 0 and 1 is not straightforward. DSI has been shown to be a special type of kappa statistics [146], and thus, a DSI >0.7 is commonly referred to as good agreement. We calculated DSI to facilitate comparison with other studies. DSI is a relative measure, however, and large structures are more likely to have higher DSI than small structures with the same variability [147,148]. Comparisons of DSI values should thus be limited to delineation studies of one specific or-gan. Another limitation of overlap measures is that they do not provide information on how contours may vary quantitatively in size, shape or location in absolute terms [143].
Hausdorff distance is often used to assess variation between delineations. For two surfaces, Hausdorff distance is defined as the maximum distance from any point on one surface to the closest point on the other surface [149]. It does not describe local variations, however, and there is no standard method for as-sessing local variability between delineations. Different 3D mod-els of surface variation can thus be used. Brouwer et al. [150] assessed the local variation in five distances to the median (SD) of the delineations to obtain a model of global 3D SD. We developed a method for displaying both systematic deviations (mean values) and random variations (SD) in local variation, using the center of mass as origin and measuring the distance between the contours. Strengths of the study were inclusion of a considerable sample size, judged to be representative for the population included in
Study I, and the use of different methods to study the variability in thyroid gland delineation.
A limitation was the low number of observers. This was ad-dressed in Paper II by analyzing the impact of extreme systematic variations on the estimated NTCP. Despite this, we cannot rule out an impact of local delineation traditions or training as the reason for the small systematic variation between delineations.
Study III
The aim of this study was to validate the mixture NTCP model developed in Study I (cohort1, OUH) in an equivalent cohort treated at a different hospital (cohort2, AUH). Patients at both hospitals were treated according to DAHANCA guidelines and the same inclusion and exclusion criteria were applied in both stud-ies.
It became evident during analysis that there were some differ-ences between the two cohorts that had not been considered as a limitation during planning of the study. While the difference in number of TSH assessments for two cohorts was adjusted for by the sampling of cohort1S, latency could not be estimated due to very large uncertainties on the estimates. Bentzen et al. [112] have previously estimated latency in late skin reactions from a single follow-up, hence the assumption that this would be possi-ble in cohort2. Both the sampling of a new cohort and the use of a fixed time factor from Study I might have been avoided by planning additional follow-ups and a study period to obtain more TSH assessments.
Baseline TSH was a significant risk factor in cohort2, but was not included in the model because we wanted to study an NTCP model equivalent to our model from cohort1, which only included Vthyroid and Dmean.
A strength of the study was the inclusion of a similar size cohort as in Study I. As we used the same inclusion and exclusion criteria as in Study I, and included consecutive patients from the outtient clinic, we believe that the cohort is representative for pa-tients treated with definitive radiotherapy at AUH. The blood samples were analyzed in the same laboratory in Studies I and III. Limitations of the study were the partly retrospective design and the limited number of follow-up TSH assessments (as discussed above). A bias in baseline TSH due to the timing of blood sampling is conceivable, since most of the patients had their baseline TSH during the first two weeks of radiotherapy. At this time the radio-therapy may theoretically have caused thyroiditis, which could have affected (typically lowering) the TSH levels.
CONCLUSION AND PERSPECTIVES
Radiation-induced hypothyroidism (RIHT) is a frequent late effect after definitive radiotherapy for head and neck squamous cell carcinoma. Dose constrains for the thyroid gland should thus be applied in radiation treatment planning to avoid RIHT, without compromising target coverage. Dmean and Vthyroid were significant risk factors for RIHT in two independent patient cohorts. Both factors were included in the NTCP models developed in Study I and III, that provide suggested dose constraints in relation to specific thyroid volumes.
Validation of the input data for the NTCP1 model (Study II) showed it to be robust against observer variations in delineations of the thyroid gland at the population level. There may be pro-nounced differences in estimated individual risk of RIHT, howev-er. Precise delineation is thus of utmost importance.
The NTCP1 model could not be fully validated and could not be directly compared to NTCP2. However, when the number of TSH assessments was taken into account, the estimated risks were very similar.
In light of the frequent occurrence of RIHT, and the potential repercussions of leaving this untreated, we recommend routine follow-up of thyroid function with regular TSH assessments after radiotherapy to the head and neck region. Since RIHT predomi-nantly developed within 2-3 years after radiotherapy, routine TSH assessments in the first five years may suffice, and not lifelong as proposed by others [81,88,94].
The current studies have provided an NTCP model for RIHT and dose constraints for the thyroid gland that can be implemented in a clinical setting. Further validation of the model and dose con-straints is desirable, however, in view of the uncertainties of NTCP models. Different strategies can be used for this. Despite the very similar risk estimates by NTCP1S and NTCP2, validation by obtaining more TSH assessments and a longer follow-up in cohort2 should be considered for validating the latency function and to form the basis for guidelines for follow-up assessment of thyroid function after radiotherapy. Pooling of data from more studies has been proposed for validation of NTCP models [151] as was done for establishing dose constraints for the parotid glands [119]. Pooling of the data from cohort1 and cohort2, and poten-tially data from other centers/countries with a longer follow-up, is an option that could be used to establish dose-response models on a very large cohort. To that end, uniform reporting of the data is needed. In support of this, we recommend biochemical hypo-thyroidism as an endpoint for modeling, with the possibility for further division of patients into subclinical and overt hypothyroid-ism.
The ultimate goal for further validation of the model is a pro-spective, longitudinal study with standardization of TSH assess-ments. Such a study could also include patient-reported out-comes, such as quality of life, in relation to RIHT. Furthermore, regular assessment of thyroid function might uncover the at-tributable factors and course of subclinical hypothyroidism after radiotherapy. Is it an inevitable road to overt hypothyroidism, or does remission occur?