Title
photon beam in head and neck intensity-modulated radiation
therapy
Author(s)
Hirata, Kimiko; Nakamura, Mitsuhiro; Yoshimura, Michio;
Mukumoto, Nobutaka; Nakata, Manabu; Ito, Hitoshi; Inokuchi,
Haruo; Matsuo, Yukinori; Mizowaki, Takashi; Hiraoka,
Masahiro
Citation
Journal of Applied Clinical Medical Physics (2015), 16(4): 52-
64
Issue Date
2015
URL
http://hdl.handle.net/2433/216369
Right
This work is licensed under a Creative Commons Attribution
3.0 License.
Type
Journal Article
a Corresponding author: Mitsuhiro Nakamura, Department of Radiation Oncology and Image-applied Therapy,
Graduate School of Medicine, Kyoto University, 54 Shogoin-Kawaharacho, Sakyo-ku, Kyoto, 606-8507, Japan; phone: +81-75-751-3762; fax: +81-75-771-9749; email: [email protected]
Dosimetric evaluation of the Acuros XB algorithm for a
4 MV photon beam in head and neck intensity-modulated
radiation therapy
Kimiko Hirata,1 Mitsuhiro Nakamura,1a Michio Yoshimura,1 Nobutaka Mukumoto,1 Manabu Nakata,2 Hitoshi Ito,1 Haruo Inokuchi,1 Yukinori Matsuo,1 Takashi Mizowaki,1 Masahiro Hiraoka1
Department of Radiation Oncology and Image-applied Therapy,1 Graduate School of Medicine, Kyoto University, Kyoto, Japan; Clinical Radiology Service Division,2 Kyoto University Hospital, Kyoto, Japan
Received 21 July, 2014; accepted 13 February, 2015
In this study, we assessed the differences in the dose distribution of a 4 MV photon beam among different calculation algorithms: the Acuros XB (AXB) algorithm, the analytic anisotropic algorithm (AAA), and the pencil beam convolution (PBC) algorithm (ver. 11.0.31), in phantoms and in clinical intensity-modulated radiation therapy (IMRT) plans. Homogeneous and heterogeneous, including middle-, low-, and high-density, phantoms were combined to assess the percentage depth dose and lateral dose profiles among AXB, AAA, and PBC. For the phantom containing the low-density area, AXB was in agreement with measurement within 0.5%, while the greatest differences between the AAA and PBC calculations and measurement were 2.7% and 3.6%, respectively. AXB showed agreement with measurement within 2.5% at the high-density area, while AAA and PBC overestimated the dose by more than 4.5% and 4.0%, respectively. Furthermore, 15 IMRT plans, calculated using AXB, for oropharyngeal, hypopharyngeal, and laryngeal carcinomas were analyzed. The dose prescription was 70 Gy to 50% of the planning target volume
(PTV70). Subsequently, each plan was recalculated using AAA and PBC while
maintaining the AXB-calculated monitor units, leaf motion, and beam arrangement. Additionally, nine hypopharyngeal and laryngeal cancer patients were analyzed in terms of PTV70 for cartilaginous structures (PTV70_cartilage). The doses covering
50% to PTV70 calculated by AAA and PBC were 2.1% ± 1.0% and 3.7% ± 0.8%
significantly higher than those using AXB, respectively (p < 0.01). The increases
in doses to PTV70_cartilage calculated by AAA and PBC relative to AXB were 3.9%
and 5.3% on average, respectively, and were relatively greater than those in the
entire PTV70. AXB was found to be in better agreement with measurement in
phan-toms in heterogeneous areas for the 4 MV photon beam. Considering AXB as the standard, AAA and PBC overestimated the IMRT dose for head and neck cancer. The dosimetric differences should not be ignored, particularly with cartilaginous structures in PTV.
PACS number: 87.55.-x, 87.55.dk, 87.55.kd
Key words: Acuros XB algorithm, intensity-modulated radiation therapy, head and neck cancer, low-energy photon beam, heterogeneous media
I. INTRODUCTION
Dose calculation accuracy is one of the most important steps in the radiation therapy treatment process; however, the dose calculation process is imperfect due to measurement uncertainties, inadequacies in beam modeling, and inherent limitations in the algorithms.
To maximize the therapeutic benefit of radiation therapy, it is essential that the estimated doses to tissues are delivered accurately. The human body consists of various tissues and cavi-ties with different physical and radiological propercavi-ties. Previous-generation dose calculation algorithms, such as the pencil beam convolution (PBC) algorithm, have not accurately calculated the doses for these tissue inhomogeneities. Current-generation dose calculation algorithms that have been used most commonly in clinical practice, such as the analytic anisotropic algorithm (AAA) and the convolution/superposition algorithm, enable moderate estimates of the changes in dose at locations at which electron disequilibrium exists.(1)
A newly released dose calculation algorithm was recently developed called the Acuros XB (AXB) algorithm, which explicitly solves the Linear Boltzmann Transport Equation (LBTE).
(2) LBTE is the governing equation that describes the distribution of radiation particles
result-ing from their interactions with matter. AXB directly discretizes the space, angle, and energy variables of the LBTE into grids and calculates the energy fluence variation of electrons and scattered photons in a substance. Some investigations have shown that AXB could achieve comparable accuracy to Monte Carlo methods, which are widely considered the gold standard for accurate dose calculation used in radiation therapy in phantom experiments, assuming the
presence of homogeneous water and heterogeneous media.(3,4)
Widely differing densities are evident among the head and neck region (soft tissue, bone, air cavities); moreover, primary tumors often exist next to air in the oral or pharyngeal cavities and in some cartilaginous structures. Additionally, certain treated nodal regions are located at
the shallow subcutaneous area in head and neck cancer. As reported by Petoukhova et al.,(5)
the 4 MV photon beam produced a somewhat smaller underdosage effect behind air cavities and a faster rebuildup than the 6 MV photon beam in experiments using the larynx phantom. Therefore, the 4 MV photon beam could be advantageous over the 6 MV beam for avoiding underdosage to treatment targets located at the air/tissue interface. However, no study has reported on AXB using the 4 MV photon beam.
Additionally, the target volumes are surrounded by several organs at risk (OARs) in the head and neck region; therefore, long-term toxicities of radiation therapy are highly prevalent with three-dimensional conformal radiation therapy. Particularly, radiation-induced xerostomia is one of the most commonly reported long-term side effects of radiation therapy for head and neck cancers. Intensity-modulated radiation therapy (IMRT) can spare the major salivary glands and aid saliva flow recovery.(6) Kan et al.(7) assessed the dosimetric impact of using AXB instead of
AAA for the treatment of nasopharyngeal carcinoma with IMRT using a 6 MV photon beam. However, no report has evaluated the dosimetric performance of AXB for oropharyngeal, hypopharyngeal or laryngeal carcinoma treated with IMRT. Kan and colleagues also stratified the target volumes into three groups — tissue, air, and bone targets — and evaluated the dose distributions to each group. In addition to this classification, assessing the dosimetric impact on pharyngeal cartilages should also be meaningful, because the cartilaginous structures are heterogeneous components of the target volume and clinically important organs that can be
invaded by progressive primary tumors for hypopharyngeal and laryngeal carcinoma.(8)
The purpose of this study consisted of two phases. First, we assessed the differences in dose distribution of a 4 MV photon beam among different calculation algorithms, including the PBC, AAA, and AXB, using homogeneous and heterogeneous phantoms. Second, to assess the dose distributions and dose-volumetric data, IMRT plans for oropharyngeal, hypopharyngeal, and laryngeal carcinoma patients using AXB were recalculated for PBC and AAA while maintain-ing the AXB-calculated monitor units and beam arrangement.
II. MATERIALS AND METHODS A. Phantom study
We investigated the differences in dosimetric performance among AXB, AAA, and PBC using homogeneous water phantom and heterogeneous slab phantom for measurement. In homoge-neous water phantom, the assigned computed tomography (CT) value was 0 Hounsfield unit
(HU) with a physical density (ρ) of 1.0000 g/cm3 and electron density relative to water (ρ*)
of 1.0000, corresponding to “water” as an assigned material. In heterogeneous phantom, the assigned CT values were averaged HU values for CT images obtained by scanning the respec-tive phantoms. In order to verify the calculated dose distribution under a condition close to patient calculation, physical density and corresponding material were automatically assigned to the heterogeneous slabs in this study. The material composition of a given voxel in a 3D CT image was assigned automatically from the CT value based on our own CT calibration curve determined from the Gammex 467 Tissue Characterization Phantom (Gammex, Inc., Middleton, WI) and the material data in AXB (ver. 11) (Acuros; Varian Medical Systems, Palo Alto, CA). The automatic assignment of the materials in AXB includes human material such as “Air”, “Lung”, “Adipose Tissue”, “Muscle Skeletal”, “Cartilage”, and ”Bone”. According to range of CT values, there are overlapping physical density regions weighted linearly between two adjacent materials.
To evaluate the percentage depth dose (PDD) and lateral dose profile, the following three phantoms were combined: 1) a phantom representing a middle-density area (TM phantom; 20 HU; Taisei Medical, Inc., Osaka, Japan) assigned to the mixed material of “Adipose Tissue” and “Muscle Skeletal” with a physical density (ρ) of 0.9895 g/cm3 and electron density relative to
water (ρ*) of 0.9780; 2) a phantom representing a low-density area (RMI-455; 710 HU, Gammex
Inc.) assigned to the material of “Lung” with a ρ of 0.2767 g/cm3 and ρ* of 0.2729; and 3) a
phantom representing a high-density area (RMI-450; 920 HU; Gammex, Inc.) assigned to the
material of “Bone” with a ρ of 1.6179 g/cm3 and ρ* of 1.5196. The phantom was the specific
slab with or without a hole hosting an ion chamber (CC04, IBA Dosimetry, Schwarzenbruck, Germany). The geometries of these phantoms are shown in Fig. 1.
The measurements and dose calculations were performed using the CLINAC-6EX linear accelerator (Varian Medical Systems) with a 4 MV photon beam in the composite phantom at a source-to-surface distance of 100 cm with a gantry angle of 0°. Dose calculations were performed using Eclipse version 11.0.3 (Varian Medical Systems). The dose was reported by
the dose-to-medium (Dm) mode for AXB. PDD was evaluated using a phantom with a
homo-geneous and heterohomo-geneous layer in Figs. 1(a) and (b) for a field size of 10 × 10 cm2. Depth
dose was measured using a small ion chamber with a sensitive volume of 0.04 cm3 (CC04;
Fig. 1. Geometries of the (a) water phantom, (b) phantom with a heterogeneous layer, and (c) phantom with a
IBA Dosimetry). In order to compare calculations with dose to medium measurements, the stopping power ratio with the correct materials of 1.011 and 0.965 were used for the low- and high-density area, determined by reference to the publication by Araki.(9) We used specific slab
phantoms with or without a hole hosting the ion chamber. The PDD curve was then generated by normalizing depth dose at maximum dose depth of 1.0 cm. The lateral dose profile was obtained using a phantom with the low- or high-density insert in Fig. 1(c) with a field size of
10 × 10 cm2 and was normalized to the dose on the beam central axis at a depth of 10 cm. The
lateral dose profile was measured using EDR2 film (Kodak, Rochester, NY).
B. Planning study
B.1 Patient selection and volume definition of targets and organs at risk
The treatment plans for 15 patients who underwent simultaneous integrated boost IMRT (SIB-IMRT) to treat oropharyngeal, hypopharyngeal, and laryngeal carcinoma in our institution between March and October 2013 were enrolled in the present study.
For the treatment planning, CT was performed using 100 cc iodinated contrast agent at a flow rate of 1 cc/sec. The scan was initiated 120 s after the start of the injection. CT was performed with the immobilization device in the treatment position and a slice thickness of 2.5 mm. The primary gross tumor volume (pGTV) and nodal gross tumor volume (nGTV) were contoured based on all available imaging methods, such as contrast-enhanced CT, magnetic resonance
imaging, and 18F-fluorodeoxyglucose positron emission tomography, as well as clinical
exami-nation. A clinical target volume (CTV70) was created by adding a 5 mm margin to each GTV.
The high-risk subclinical target volume (CTV63) was determined by adding 5–20 mm margins
to the GTV, depending on tumor location and disease stage. Then, anatomical boundaries based
on the microscopic invasion were edited manually. The CTV63 also included both node-positive
areas and adjacent nodal regions. The CTV56 was defined as the remaining neck nodal areas
considered low risk for potential microscopic spread. The planning target volumes prescribed
for 70, 63, and 56 Gy (PTV70, PTV63, and PTV56, respectively) were created by adding a 5 mm
margin to the CTV70, CTV63, and CTV56. PTVs were restricted to skin cropping at 2 mm from
the surface. Surrounding critical normal structures, including the brainstem, spinal cord, parotid glands, mandible, and larynx, were contoured. The planning organs-at-risk volumes (PRVs) of the brainstem and spinal cord were outlined using a 5 mm margin for each organ (PRV_Stem, PRV_Cord).
B.2 Treatment planning
IMRT plans were created using a seven-field sliding window technique via Eclipse and the Dose Volume Optimizer version 11.0.3 (Varian Medical Systems). To avoid uncertainties in oral reproducibility and metal artifacts in teeth, we used typical gantry angles of 80°, 120°, 150°, 180°, 210°, 240°, and 280°. All treatment plans were generated using 4 MV photon beams from CLINAC-6EX with a Millennium 120 multileaf collimator.
The dose prescription was 70 Gy in 35 fractions (2 Gy per fraction) to 50% of the PTV70. The
clinical objectives for the optimization are shown in Table 1. Dose calculations were performed using AXB version 11.0.31 with a heterogeneity correction and 2.5 mm grid resolution. Dose
calculations were made in the Dm mode. The material substances were allocated automatically
using the predetermined material table (ver. 11.0). Subsequently, each plan was recalculated using AAA and PBC version 11.0.31 with heterogeneity correction and the same monitor units and leaf motions as the plan using AXB.
B.3 Dosimetric evaluation
The following dose-volumetric data calculated using AXB, AAA, and PBC were compared
with the PTVs: the doses covering 50% volumes (D50), minimum doses represented by doses
covering 98% volumes (D98), and maximum doses represented by doses covering at least 2%
volumes (D2). The homogeneity index (HI) for the PTV70 was calculated as the ratio (D2 - D98)/
D50 to evaluate target dose homogeneity.
In addition, nine hypopharyngeal and laryngeal cancer patients were analyzed in terms
of the PTV70 for the hyoid bone, thyroid, and cricoid cartilages (PTV70_cartilage), which are
heterogeneous components of the PTV70 and clinically important organs that can be invaded
by progressed primary tumors.(8) Cartilaginous structures in PTV
70 were first delineated by
autosegmentation using the CT ranger tool with range of 120–3000 HU, with processing in 3D mode. The corresponding materials were “Cartilage” and “Bone” for 120 HU, and “Bone” for 3000 HU. Thus, there were overlapping physical density regions for two adjacent materials. Then, the contours were modified manually according to the patient’s anatomy by a radiation oncologist. The means and standard deviations (SDs) of CT values were measured to evaluate variations in contouring cartilaginous structures. We also created PTV70_c_edge and PTV70_a_edge by generating a shell via a 2 mm expansion of the cartilaginous structures and air cavity, respec-tively, using the autosegmentation tool, to evaluate the dose near the cartilage/tissue and air/ tissue interfaces, respectively. Examples of the structures are shown in Fig. 2.
Clinically relevant dose-volumetric data for the OARs were compared. The doses received in
volumes of at least 2 cc (D2cc) to the brainstem and spinal cord were reported. Those volumes
receiving 30 Gy (V30Gy) and the mean doses to the parotid glands were reported, as were the
mean dose differences to the larynx in oropharyngeal cancer patients.
To determine the statistical significance of the observed differences, two-sided paired t-tests were used. A p-value less than 0.05 was deemed to indicate statistical significance.
Table 1. Clinical objectives for the optimization.
Structure Index Per Protocol Acceptable Variation
PTV70 D50 =100% 98%–103% D98 >93% >90% D2 <105% <115% PTV63 * D 90 =100% >97% D50 <105% <108% PTV56 † D 90 = 100% >97% D50 <105% <108% CTV70 D95 >100% >98% CTV63 D95 >100% >98% CTV56 D95 >100% >98% GTV D95 >100% >98% PRV_Stem D2cc <54 Gy <60 Gy
Brainstem Maximum dose <54 Gy <60 Gy
PRV_Cord D2cc <45 Gy <50 Gy
Spinal cord Maximum dose <45 Gy <50 Gy
Lt. Parotid V30Gy <50%
Rt. Parotid V30Gy <50%
* The PTV
63 index percentages are calculated based on a prescribed dose of 63 Gy. † The PTV
56 index percentages are calculated based on a prescribed dose of 56 Gy.
DX = the dose covering X% volumes; D2cc = the dose received in a volume of at least 2 cc; V30Gy = volume receiving 30 Gy; Lt. = left; Rt. = right.
III. RESULTS A. Phantom study
PDD values on the homogenous and heterogeneous phantoms are shown in Fig. 3. For the homo-geneous phantom, each algorithm was in agreement with measurement within 1.5%, particularly AXB and AAA, which were within 1.0%. Additionally, regarding the phantom containing the low-density area, the dose calculated using AXB showed agreement with measurement within 0.5% at the low-density area and within 1.5% at the rebuildup area. The greatest differences between AAA and PBC calculations and measurement were 2.7% and 3.6%, respectively, in the low-density area. AAA and PBC overestimated the dose distribution by more than 5.5% and 3.5%, respectively, at the rebuildup area. For the phantom containing the high-density area, the dose calculated using AXB was in agreement with measurement within 2.5% at the high-density area, but was overestimated at the high-density/tissue interface, with a difference of 3.5%. AAA and PBC overestimated the dose distribution in the high-density area by more than 4.5% and 4.0%, respectively.
Lateral dose profiles are shown in Fig. 4. With the low-density phantom, the greatest dif-ferences obtained near the boundary (off-center distance of x = 0.8 cm) were 0.4%, 2.9%, and 1.2% for AXB, AAA, and PBC, respectively. Additionally, the greatest differences obtained near the boundary (off-center distance of x = 0.8 cm) were 0.3%, 3.4%, and 1.3% for AXB, AAA, and PBC, respectively, in the high-density phantom. The averaged doses in the high-density area (from a 2.0 to 4.0 cm off-center distance) calculated by AXB, AAA, and PBC were 1.5%, 5.3%, and 6.7% greater than the measurement dose, respectively.
Fig. 2. An example of the axial image of a hypopharyngeal cancer patient indicating the structure of (a) PTV70,
Fig. 3. PDD of 4 MV photon beams in the (a) water phantom, (b) low-density phantom, and (c) high-density phantom.
Differences are represented as PDD (calculation) - PDD (measurement).
Fig. 4. Lateral dose profile of 4 MV photon beams in the (a) low-density phantom and (b) high-density phantom. Differences
B. Planning study
All of the treatment plans calculated by AXB were per protocol or at least acceptable for the
dose-volume constraints of our protocol. The dose per fraction to the PTV70 was 2 Gy. The
averaged total number of monitor units was 1269 ± 137.1 (range, 1037–1534) per fraction. Table 2 summarizes the averaged dose-volumetric data of the PTVs for the 15 patients. The
D50 to PTV70 calculated using AAA and PBC were 2.1% ± 1.0% and 3.7% ± 0.8% higher,
respectively, than those using AXB significantly (p < 0.01). The D50 to PTV63 calculated using AAA and PBC were 1.8% ± 1.1% and 3.4% ± 0.6% significantly higher, respectively, than
those using AXB (p < 0.01). The D98 to PTV63 estimated using AAA was also significantly
higher than that using AXB, whereas no significant difference was found in the D98 to PTV63
between PBC and AXB estimates.
The mean ± SDs of CT value in cartilaginous structures ranged from 179 ± 124 to 319 ±
209 HU (corresponding ρ ranged from 1.1269 to 1.2199 g/cm3). The SDs ranged from 124 to
209 HU. The minimum and maximum of mean ± SDs of CT value was 55 and 528 HU,
respec-tively (corresponding ρ ranged from 1.0724 to 1.3736 g/cm3). The corresponding materials
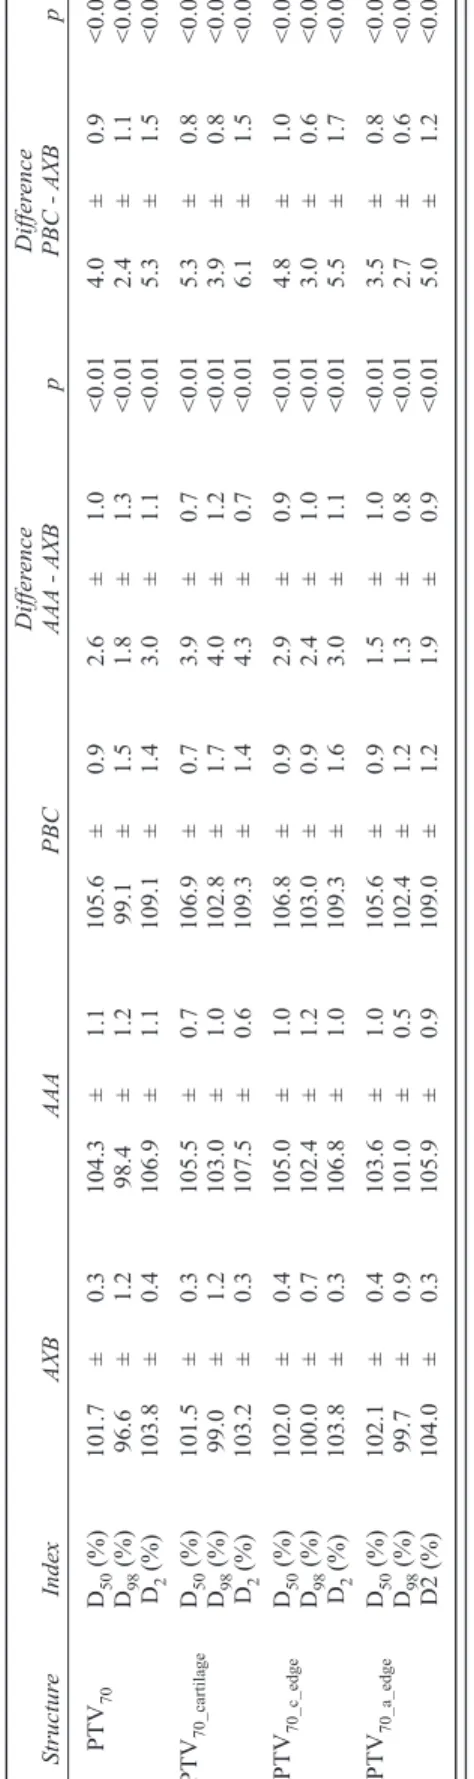
were “Muscle Skeletal” and “Cartilage” for 55 HU, and “Cartilage” and “Bone” for 528 HU. The averaged dose-volumetric data of cartilaginous structures and air in PTV70 (PTV70_cartilage, PTV70_c_edge, and PTV70_a_edge) for nine patients with hypopharyngeal and laryngeal carcinoma
are shown in Table 3. The D50 calculated by AAA was 3.9% higher for PTV70_cartilage than that
by AXB, and the D50 calculated by PBC was 5.3% higher than that by AXB. The dose increase
to PTV70_cartilage calculated by AAA and PBC was greater than that in the entire PTV70. For the PTV70_c_edge, the D50 values calculated by AAA and PBC were higher than those by AXB, and the differences were somewhat greater than the difference in the entire PTV70. For the PTV70_a_edge,
the difference between AAA and AXB was smaller than that in the PTV70. Differences in PBC
from AXB showed a similar trend. The averaged dose-volumetric histograms of nine patients for the PTV70, PTV70_caritlage, PTV70_c_edge, and PTV70_a_edge, calculated using the three algorithms,
are shown in Fig. 5. The dose differences between PTV70 and PTV70_caritlage or PTV70_c_edge
were emphasized in AAA and PBC. Figure 6 shows the dose difference distributions between (a) AXB and AAA and (b) AXB and PBC of the axial slice of the thyroid cartilage level in a representative case. Their line profiles are also shown in Fig. 6(c). In particular, AAA and PBC overestimated the dose to the thyroid cartilage, compared with AXB.
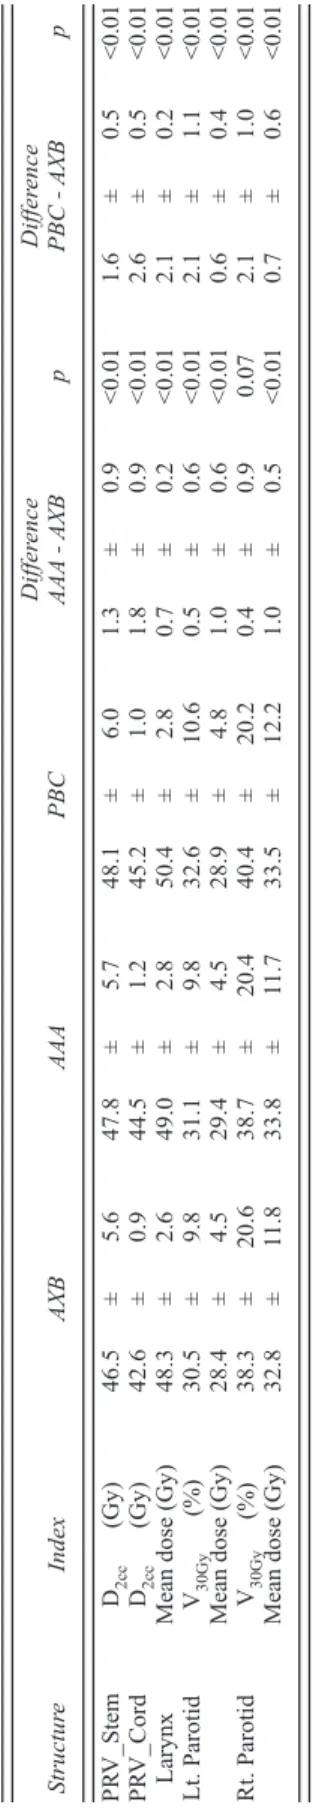
Table 4 summarizes the averaged dose-volumetric data to OARs. Using AAA and PBC,
the averaged differences of D2cc for PRV_Stem were 1.3 Gy and 1.6 Gy higher and those for
PRV_Cord were 1.8 Gy and 2.6 Gy higher, respectively, than that using AXB. Little increase
was found in the mean dose to the parotid area and volume of V30Gy estimated using AAA and
T
able
2.
A
veraged dose-volumetric data for PTVs.
Differ ence Differ ence Structur e Index AXB AAA PBC AAA - AXB p PBC - AXB p PTV 70 D50 (%) 101.7 ± 0.4 103.8 ± 1.1 105.4 ± 0.9 2.1 ± 1.0 <0.01 3.7 ± 0.8 <0.01 D98 (%) 95.5 ± 2.1 96.8 ± 2.6 97.6 ± 2.6 1.2 ± 1.3 <0.01 2.1 ± 1.2 <0.01 D2 (%) 104.2 ± 1.0 106.9 ± 1.2 109.2 ± 1.5 2.7 ± 1.0 <0.01 5.0 ± 1.3 <0.01 HI 0.085 ± 0.028 0.098 ± 0.030 0.1 10 ± 0.030 0.012 ± 0.010 <0.01 0.024 ± 0.014 <0.01 PTV 63 * D50 (%) 104.3 ± 0.6 106.1 ± 1.0 107.6 ± 1.0 1.8 ± 1.1 <0.01 3.4 ± 0.6 <0.01 D98 (%) 94.9 ± 1.9 95.7 ± 2.2 94.4 ± 1.8 0.8 ± 1.3 0.04 -0.5 ± 1.0 0.06 D2 (%) 110.8 ± 1.6 113.2 ± 1.9 115.4 ± 1.5 2.4 ± 1.0 <0.01 4.5 ± 0.7 <0.01 PTV 56 † D50 (%) 104.5 ± 0.6 106.8 ± 1.5 110.2 ± 1.0 2.4 ± 1.3 <0.01 5.7 ± 1.0 <0.01 D98 (%) 96.2 ± 2.2 97.8 ± 2.8 98.3 ± 3.1 1.6 ± 1.5 <0.01 2.1 ± 1.7 <0.01 D2 (%) 110.8 ± 2.0 113.3 ± 2.9 117.0 ± 2.0 2.5 ± 1.3 <0.01 6.1 ± 1.2 <0.01 * The PTV 63
index percentages are calculated based on a prescribed dose of 63 Gy
.
† The PTV
56
index percentages are calculated based on a prescribed dose of 56 Gy
.
DX
= the dose covering X% volumes; HI = homogeneity index.
T
able
3.
A
veraged dose-volumetric data for PTVs among hypopharyngeal and laryngeal cancer patients.
Differ ence Differ ence Structur e Index AXB AAA PBC AAA - AXB p PBC - AXB p PTV 70 D50 (%) 101.7 ± 0.3 104.3 ± 1.1 105.6 ± 0.9 2.6 ± 1.0 <0.01 4.0 ± 0.9 <0.01 D98 (%) 96.6 ± 1.2 98.4 ± 1.2 99.1 ± 1.5 1.8 ± 1.3 <0.01 2.4 ± 1.1 <0.01 D2 (%) 103.8 ± 0.4 106.9 ± 1.1 109.1 ± 1.4 3.0 ± 1.1 <0.01 5.3 ± 1.5 <0.01 PTV 70_cartilage D50 (%) 101.5 ± 0.3 105.5 ± 0.7 106.9 ± 0.7 3.9 ± 0.7 <0.01 5.3 ± 0.8 <0.01 D98 (%) 99.0 ± 1.2 103.0 ± 1.0 102.8 ± 1.7 4.0 ± 1.2 <0.01 3.9 ± 0.8 <0.01 D2 (%) 103.2 ± 0.3 107.5 ± 0.6 109.3 ± 1.4 4.3 ± 0.7 <0.01 6.1 ± 1.5 <0.01 PTV 70_c_edge D50 (%) 102.0 ± 0.4 105.0 ± 1.0 106.8 ± 0.9 2.9 ± 0.9 <0.01 4.8 ± 1.0 <0.01 D98 (%) 100.0 ± 0.7 102.4 ± 1.2 103.0 ± 0.9 2.4 ± 1.0 <0.01 3.0 ± 0.6 <0.01 D2 (%) 103.8 ± 0.3 106.8 ± 1.0 109.3 ± 1.6 3.0 ± 1.1 <0.01 5.5 ± 1.7 <0.01 PTV 70_a_edge D50 (%) 102.1 ± 0.4 103.6 ± 1.0 105.6 ± 0.9 1.5 ± 1.0 <0.01 3.5 ± 0.8 <0.01 D98 (%) 99.7 ± 0.9 101.0 ± 0.5 102.4 ± 1.2 1.3 ± 0.8 <0.01 2.7 ± 0.6 <0.01 D2 (%) 104.0 ± 0.3 105.9 ± 0.9 109.0 ± 1.2 1.9 ± 0.9 <0.01 5.0 ± 1.2 <0.01 DX
Fig. 5. Averaged dose-volumetric histograms of nine patients calculated using the (a) Acuros XB (AXB) algorithm,
(b) analytic anisotropic algorithm (AAA), and (c) pencil beam convolution (PBC) algorithm. The graphs indicate PTV70, PTV70_cartilage, PTV70_c_edge, and PTV70_a_edge.
Fig. 6. Representative dose differences among AXB, AAA, and PBC: (a) AAA - AXB, (b) PBC - AXB. Upper and lower
dose limits show 5% of the prescription dose. Line profiles (c) are indicated by the red arrow in (a) and (b). The gray area in (c) indicates the range of PTV , PTV , and PTV .
IV. DISCUSSION
Some reports have shown that AXB could achieve compa-rable accuracy to that using Monte Carlo methods, which have been considered the gold standard for accurate dose calculation.(3,4) Kroon et al.(10) compared the PDD using
AXB for a 6 MV photon beam on a phantom containing the low-density area and showed that the AXB was acceptably consistent with measurement. In our study, AXB was found to be in better agreement with measurement compared with AAA or PBC in phantoms including low- or high-density areas for a 4 MV photon beam. The high-density material in the heterogeneous phantom was assigned to “Bone” and not “Cartilage.” However, AXB was in agreement with the measurement, to within 1.0% with the homogenous water
phantom (ρ = 1.0000 g/cm3), and within 2.5% in a
high-density area of the heterogeneous phantom (ρ = 1.6179 g/
cm3), and within 3.5% at the interface. From these results,
the dosimetric accuracy of AXB in the cartilaginous struc-tures’ density range calculated from our own CT calibration
curve (1.072 ≤ρ≤ 1.374 g/cm3 from our results) can be
estimated to be as high as that in high density. Thus, assess-ment of the dose distributions calculated using AXB even for a 4 MV photon beam is appropriate for clinical planning, except for the high-density/tissue interface.
Several investigations have been conducted on the clinical impact of AXB for various sites.(7,10,11) They
com-pared the dose distributions calculated by AXB with those by AAA in IMRT or volumetric-modulated arc therapy (VMAT) using 6 or 15 MV photon beams for lung cancer
or nasopharyngeal carcinoma. Kan et al.(7) reported that
the mean and minimum doses to the PTV70 calculated by
AXB were lower than those by AAA for nasopharyngeal carcinoma. Our results using a 4 MV photon beam were consistent with their results. The findings of the current
study indicated that the mean dose to the PTV70 was
escalated naturally by 2.1%–3.7% if we maintained the original dose prescriptions and dose-volume constraints in the switch from AAA or PBC to AXB. Although increas-ing the dose to the PTV may improve the tumor control, the dose increase to pharyngeal mucosa, muscle, and skin inside the PTV may cause unintentional toxicities. For the reasons mentioned above, care should be taken regarding the radiation-induced toxicity levels after switching the dose calculation algorithm.
Dosimetric evaluation of cartilaginous structures deserves careful attention for hypopharyngeal and laryngeal carcinomas. The dose differences between AAA or PBC and AXB were emphasized in cartilaginous structures of
the PTV70. Relative to AXB, AAA and PBC overestimated
the dose in cartilaginous structures (Fig. 5). When calculat-ing the dose distributions uscalculat-ing PBC or AAA, users should
T
able
4.
A
veraged dose-volumetric data for OARs.
Differ ence Differ ence Structur e Index AXB AAA PBC AAA - AXB p PBC - AXB p PR V_Stem D2cc (Gy) 46.5 ± 5.6 47.8 ± 5.7 48.1 ± 6.0 1.3 ± 0.9 <0.01 1.6 ± 0.5 <0 .0 1 PR V_Cord D2cc (Gy) 42.6 ± 0.9 44.5 ± 1.2 45.2 ± 1.0 1.8 ± 0.9 <0.01 2.6 ± 0.5 <0 .0 1 Larynx Mean dose (Gy) 48.3 ± 2.6 49.0 ± 2.8 50.4 ± 2.8 0.7 ± 0.2 <0.01 2.1 ± 0.2 <0 .0 1 Lt. Parotid V30Gy (%) 30.5 ± 9.8 31.1 ± 9.8 32.6 ± 10.6 0.5 ± 0.6 <0.01 2.1 ± 1.1 <0 .0 1 Mean dose (Gy) 28.4 ± 4.5 29.4 ± 4.5 28.9 ± 4.8 1.0 ± 0.6 <0.01 0.6 ± 0.4 <0 .0 1 Rt. Parotid V30Gy (%) 38.3 ± 20.6 38.7 ± 20.4 40.4 ± 20.2 0.4 ± 0.9 0.07 2.1 ± 1.0 <0 .0 1 Mean dose (Gy) 32.8 ± 11.8 33.8 ± 11.7 33.5 ± 12.2 1.0 ± 0.5 <0.01 0.7 ± 0.6 <0 .0 1 D2cc
= the dose received in a volume of at least 2 cc;
V30Gy
pay attention to the decrease in the doses to cartilaginous structures, particularly for T4 of hypopharyngeal tumors and T3 and T4 of laryngeal tumors. Tumors of these stages macroscopi-cally invade thyroid or cricoid cartilage or hyoid bone, and microscopic invasion is considered clinically to spread throughout the entire cartilage. Thus, it is preferable in those patients with advanced stage to ensure the radiation doses to the cartilaginous structures without increasing their risk of developing cartilage necrosis.
Regarding the dosimetric effects on tissues surrounding the cartilaginous structures, the
differences between AXB and AAA or PBC were slightly higher than that in the entire PTV70.
However, our phantom study showed that some dose calculation errors were observed even
when using AXB at a high-density/tissue interface; thus, accurate evaluation of PTV70_c_edge
was difficult in the present study.
The entire cartilaginous structure is not mapped to the material of “Cartilage” in AXB. Cartilaginous structures were assigned automatically not only to “Cartilage”, but also “Bone”, “Muscle Skeletal”, and their mixed materials by AXB. The mixed material might make it difficult to clarify the dose calculation accuracy in AXB. However, in the clinical situation, we do not assign the cartilaginous structure to pure “Cartilage” material manually. Even when the tumor invades cartilaginous structures macroscopically and the cartilaginous structures are replaced with tumor, the CT value may still differ from that of “Cartilage.” Moreover, if a tumor invades a cartilaginous structure microscopically, the cartilaginous tissue may not be destroyed and the CT value may be maintained similar to that of “Cartilage.” Because of the complex material components in cartilaginous structures, this research is appropriate for the clinical situation. Furthermore, the variations in cartilaginous structures showed that the segmentation accuracy of cartilaginous structures was sufficient to evaluate dose distributions in the present study.
Regarding the dose effect of the tissue surrounding the air cavity, even though AAA over-estimated the dose by more than 5.5% in the rebuildup area in the phantom experiment, the dose difference in the air/tissue surface calculated using AAA and AXB was comparable to that in the entire PTV in the clinical IMRT plan. Two possible explanations exist. First, multifield
irradiation might reduce the overestimation of AAA. Kan et al.(7) reported that the difference
between the doses to air calculated using AAA and AXB decreased as the number of fields increased. They stated that part of the dose reduction from each single field was compensated by the increase in the out-of-field doses from other fields coming from different directions. Second, there were few beams that reached a tumor via air. The anterior part of the laryngeal
cavity rarely included the PTV70 for early T stage hypopharyngeal carcinoma, because we used
gantry angles from only the lateral and dorsal directions to avoid oral reproducibility and metal artifact uncertainties.
In the current study, we created an IMRT plan using AXB and then recalculated the dose distributions using AAA and PBC. When applying a new calculation algorithm, the dose distri-bution calculated using the new algorithm should be compared with that recalculated using the previous algorithm. Thereafter, a reconsideration of the conventional dose-volume constraints will be required in inverse planning, such as in IMRT or VMAT planning, to avoid overdos-age to the targets. The appropriateness of switching the dose calculation algorithm should be validated carefully from a clinical viewpoint.
V. CONCLUSIONS
In this study, we demonstrated that AXB showed good agreement in measurements with phan-toms containing low- and high-density areas for a 4 MV photon beam. Relative to AXB as the standard, AAA and PBC overestimated the dose in IMRT for oropharyngeal, hypopharyngeal, and laryngeal carcinomas. The differences should not be ignored, particularly with cartilaginous
structures in the PTV70; thus, radiation oncologists should pay close attention to those cases
ACKNOWLEDGMENTS
This research was supported in part by a Grant-in-Aid for Scientific Research from the Ministry of Education, Culture, Sports, Science, and Technology of Japan (Grant 25253078).
REFERENCES
1. Papanikolau N, Battista JJ, Bouer AL, et al. Tissue inhomogeneity corrections for megavoltage photon beams. AAPM Report No. 85. Report of Task Group No 65 of the Radiation Therapy Committee of the American Association of Physicists in Medicine. Madison, WI: Medical Physics; 2004.
2. Vassiliev ON, Wareing TA, McGhee J, Failla G, Salehpour MR, Mourtada F. Validation of a new grid-based Boltzmann equation solver for dose calculation in radiotherapy with photon beams. Phys Med Biol. 2010;55(3):581–98.
3. Han T, Mikell JK, Salehpour M, Mourtada F. Dosimetric comparison of Acuros XB deterministic radiation transport method with Monte Carlo and model-based convolution methods in heterogeneous media. Med Phys. 2011;38(5):2651–64.
4. Bush K, Gagne IM, Zavgorodni S, Ansbacher W, Beckham W. Dosimetric validation of Acuros XB with Monte Carlo methods for photon dose calculations. Med Phys. 2011;38(4):2208–21.
5. Petoukhova AL, Terhaard CH, Welleweerd H. Does 4 MV perform better compared to 6 MV in the presence of air cavities in the head and neck region? Radiother Oncol. 2006;79(2):203-7.
6. Nutting CM, Morden JP, Harrington KJ, et al. Parotid-sparing intensity modulated versus conventional radio-therapy in head and neck cancer (PARSPORT): a phase 3 multicentre randomised controlled trial. Lancet Oncol. 2011;12(2):127–36.
7. Kan MW, Leung LH, Yu PK. Dosimetric impact of using the Acuros XB algorithm for intensity modulated radiation therapy and RapidArc planning in nasopharyngeal carcinomas. Int J Radiat Oncol Biol Phys. 2013;85(1):e73–e80. 8. Becker M. Neoplastic invasion of laryngeal cartilage: radiologic diagnosis and therapeutic implications. Eur J
Radiol. 2000;33(3):216–29.
9. Araki F. Monte Carlo-based correction factors for ion chamber dosimetry in heterogeneous phantoms for mega-voltage photon beams. Phys Med Biol. 2012;57(22):7615–27.
10. Kroon PS, Hol S, Essers M. Dosimetric accuracy and clinical quality of Acuros XB and AAA dose calcula-tion algorithm for stereotactic and convencalcula-tional lung volumetric modulated arc therapy plans. Radiat Oncol. 2013;8(1):149.
11. Fogliata A, Nicolini G, Clivio A, Vanetti E, Cozzi L. Critical appraisal of Acuros XB and Anisotropic Analytic Algorithm dose calculation in advanced non-small-cell lung cancer treatments. Int J Radiat Oncol Biol Phys. 2012;83(5):1587–95.