Voltage Reduction Energy
Conservation Findings
Phase 3
Time
Volts Watts
Power & Voltage Regulation Cycle
225
600
230
750
235
900
240
1050
245
1200
250
1350
255
1500
260
1650
265
1800
270
1950
275
2100
Voltage Volts True Power WattsDocument history
Revision Date
Details
Author Approved
0.8
28-1-2010
LVR voltage reduction for
energy conservation
Glenn
Dahlenburg
Michelle
Taylor
Background ...3
Summary...4
Key Findings...5
Site Summary ...7
Site 1: Smithfield Police Station...7
Site 2: Queensland Health Residence/Office Yarrabah ...11
Site 3: DERM Workshop/office ...14
Peak demand, demand and energy reduction ...17
Efficiencies and LVR losses...18
Power Quality - Regulation...20
Installation ...22
Energy Conservation and Power Quality ...23
Appendix 1. CVRf Calculation ...27
Appendix 2. Site Survey Questions ...27
Figure 1 - Regulation Cycle Example...6
Figure 2 - Smithfield Load Profile...9
Figure 3 - Smithfield High Voltage vs Low Voltage Load Profile...9
Figure 4 - Smithfield Power Factor ...10
Figure 5 - Yarrabah 24 Hour Load Profile...12
Figure 6 - Yarrabah High Voltage vs Low Voltage Load Profile...12
Figure 7 - Yarrabah Power Factor ...13
Figure 8 - Yungaburra 24 Hour Load Profile ...15
Figure 9 - Yungaburra High Voltage vs Low Voltage Load Profile ...15
Figure 10 -Yungaburra Power Factor ...16
Figure 11- LVR Loss vs Load Current ...18
Figure 12 - LVR Efficiency vs Load Current ...19
Figure 13 - Zero Net Load Increase Due to LVR ...20
Figure 14 - Three Phase Voltage, Regulated and Unregulated...20
Figure 15 - Motor Start voltage and current averaged 1 minute RMS ...21
Figure 16 - Wave capture motor start ...22
Figure 17 - RMS Voltage and Current Bypass ...22
Background
The Energy Conservation through Voltage Reduction Phase 3 Trial is the final stage in determining the value of voltage regulators used for energy conservation within the Ergon Energy network. This involved the trial of voltage regulators on three customer sites over a period of six months.
Previous trials and studies have demonstrated that energy conservation through voltage regulation is optimal where:
1. customer voltage is significantly higher than nominal supply voltage; i.e. greater
than 245V
2. load has a high proportion of motors that are not controlled by variable speed or
variable frequency drives
3. majority of the load is not thermostatically controlled resistive load; eg. water
heating
4. majority of the load is not electronic; eg. computers, TV’s etc.
5. majority of the load is not high efficiency lighting; e.g. LED, T5 fluorescent
The site selection for these final trials was based on potential savings, with the primary site selection criteria being high voltage and load-type diversity. There were three sites selected for the joint trial with the Department of Public Works, covering a range of loads and supplies. The three sites were the Smithfield Police Station, Queensland Health
Office/Residence in Yarrabah and the Department Environment and Resource Management office in Yungaburra.
All sites were monitored using Gridsense PM45 power quality data loggers, and initial data analysis was further used to confirm appropriate sites for the trial. Five Microplanet 20kVA Low Voltage Regulators (LVRs) were configured to switch between a high regulated voltage and a low regulated voltage, thus enabling the calculation of the CVRf (Conservation Voltage Reduction Factor) for each site. Upon the completion of the trial, the LVRs were configured to regulate to an appropriate low voltage (228V to 232V) for on going energy conservation. At the completion of the trial a short customer survey was conducted for each site to provide feedback about user experiences from the LVR installations.
The support of the Department of Public Works (DPW) for the project is gratefully acknowledged.
Summary
This LVR trial was successful, with all three LVR sites exhibiting energy savings;
Smithfield Police Station 5.29%
Yarrabah Health Office and Residence 6.87%
Yungaburra DERM Workshop and Office 13.35%
showing that voltage regulation for energy savings is indeed possible. Further to this
improvements in power factor were noted at sites where there was significant variation from unity.
A customer survey of the sites revealed no negative impacts on appliances as a result of the installation of LVRs. The only negative impact reported was due to the shutdown for installation and the removal of monitoring equipment. Several sites reported reductions in energy bills and whilst the total reduction may not be all attributable to the installation of LVRs, this still left a positive impression with the customer about the installation of LVRs for energy reduction.
These findings confirm voltage reduction provides opportunity for energy savings, although it is not a simple process to predict the extent of the energy savings due to the number of influencing factors. As such the commercial decision for the installation of voltage reduction devices for energy reduction is not a straight forward process. While the calculation of potential energy savings is not straight forward, quantifying individual sites does enable network wide statistical projections based on site data.
Rule of thumb for installing LVRs for energy conservation.
• Average voltage >240V and preferably > 245V
• Average Daily Site Load > 72kWh
• Peak Load < 20kW (LVR maximum kW capacity)
• low levels of energy efficiency initiatives deployed
• site load diversity
For LVR installations inside a customer premise (i.e. on the customer side of the meter) there are significant complexities to take into account as the current generation of LVR is designed for pole mounting and not for this type of customer installation. A new version of the LVR designed specifically for in-premise installation will reduce overall costs, thus reducing the payback periods and increasing the number of possible sites for energy conservation through voltage reduction.
If installing the LVR for power quality, the voltage set point should be the lowest possible voltage suitable for the site whilst maintaining the regulatory voltage standard, as there is no discernable benefit for regulating to a higher voltage. A higher voltage regulation set point may increase the site load, customer energy costs and peak load whilst the lowest set point may reduce load and negate LVR losses.
The most noticeable power quality issue with LVRs for energy conservation is direct on-line (DOL) motor starts which may cause the LVR to go into bypass if the peak current rating of 180A is exceeded. These motor start effects will be reduced with the introduction of generation II LVRs with an increase in the peak current rating to 330A and sub-cycle regulation. However it may be more prudent to make customers aware that they are exceeding supply agreement standards and Ergon Energy’s Electricity Connection and Metering Manual requirements and work with the customer to resolve such issues.
Key Findings
The LVRs on all three sites provided energy savings, demand reductions and some power factor correction, demonstrating that with careful site selection, energy savings are possible through the use of voltage regulation.
Energy (kWh) and demand (kW) reductions in the range of 5% to 13% were observed. Results from the trials highlighted several important points about voltage regulation for energy savings:
1. If LVRs are installed for power quality and the regulation voltage is set high,
peak demand issues may be amplified and customer energy costs increased.
2. If the average supply voltage is not high enough, savings due to voltage
regulation may be inconsequential, it is even possible to increase the energy consumption of a site.
Rule of thumb: for reasonable energy savings average voltage >240V and preferably > 245V
3. The larger the voltage reduction the larger the savings, hence regulation voltage
should be set to 1% above the lowest possible voltage suitable for the site, the 1% overhead is the regulation accuracy of the LVR.
Rule of thumb: minimum regulation set point = minimum statutory voltage + 1%. E.g. 240 -6% +1% = 228V.
4. If an LVR is installed on the customer side of the meter, the regulation voltage
may be lowered below the legislative minimum for supply. The legislative minimum is for the point of supply, not the point of use. If the customer wishes to lower the voltage below 226V it is possible to increase the savings even further. It must be noted that any appliance receiving a significantly reduced voltage should be checked that the voltage is within is name plate rating.
5. If the average site load has to be high enough so as the LVR does not form a
significant portion of the overall site load and the peak load must be less than the LVR rated maximum.
Rule of thumb: average site load for 24hour period > 72kWh and not exceeding 20kW peak
6. Load diversity has an impact on the levels of savings, the more motor loads,
non-energy efficient lighting and the older the loads, the more opportunity for savings. Loads that provide the best potential for energy savings are:
a. Motor loads that are not VFD or VSD controlled eg. pumps, compressors
b. Lighting, non-electronic ballast fluorescent or incandescent
c. Resistive, not thermostatically controlled, e.g time based heating
elements
7. The reduction in voltage corresponds to an improvement in power factor, thus
reducing VArs and improving power quality.
8. CVRf values can vary up to 30% for a premise due to site appliance mix and
usage patterns, thus while CVRf is an effective means of calculating potential energy savings, a degree of caution must be used when quoting CVRf values, especially if using the CVRf values to quote energy savings to customers. Actual energy savings will depend on the difference between the regulated voltage and line voltage (which normally varies), CVR and appliance usage.
9. CVRf values hence energy savings will erode over time as appliance efficiencies
improve, however the Smithfield Police Station had already undertaken many energy efficiency measures and still showed reasonable savings of 5.29%. 10. Financial gains from the installation of LVRs are heavily dependant on supply
voltage, load diversity, load levels, LVR installation and unit costs. As supply voltage may vary as changes to the network take place, this must also be considered with respect to deployment of LVRs for energy conservation.
11. Large motors with high motor start currents can cause the LVR to drop out of regulation and go into bypass, resulting in the customer receiving un-regulated supply voltage for short periods. While this may add to flicker issues within the premise, there will be no major effect on energy conservation, as the LVR goes back into regulation 30 seconds after bypass. This motor start bypass issue will be alleviated to a degree by the generation II LVR currently under development. 12. Demand reductions at any instant in time cannot be guaranteed as demand
reductions are reliant on the instantaneous power use of individual appliances. With load diversity the variations in savings from different appliances will be spread across the site, resulting in demand savings approximating energy savings. Rule of thumb: With load diversity the demand reductions approximate energy reductions.
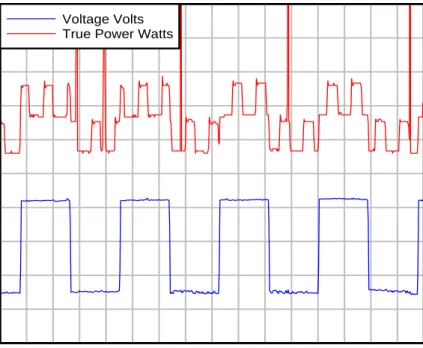
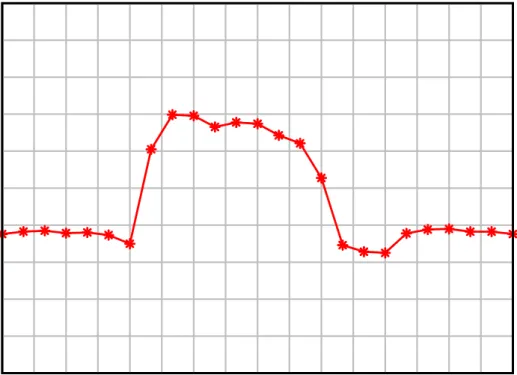
An example of energy savings due to voltage regulation can be seen from Figure 1 -
Regulation Cycle Example. The graph represents the switching of the LVR from high voltage to low voltage in blue; for every corresponding high voltage period there is a noticeable step up in energy consumption in red.
Figure 1 - Regulation Cycle Example
Time Vo lt s W a tts
Power & Voltage Regulation Cycle
225 600 230 750 235 900 240 1050 245 1200 250 1350 255 1500 260 1650 265 1800 270 1950 275 2100 Voltage Volts True Power Watts
Project Scope
The sites for the phase 3 trials were chosen in association with DPW (Department of Public Works) and included the Smithfield Police Station, Yarrabah Queensland Health residence medical centre and Yungaburra DERM (Department of Environment and Resource Management) workshop and office.
The project trialled two single phase sites and one three phase sites for a period of 6 months. During that time, Microplanet LVRs were installed between the main metering points and the site electrical distribution for all sites. In the three phase Smithfield installation, a bypass switch was also installed to ensure that any work required during the trial time would not significantly inconvenience the personnel on site.
Microplanet provided LVRs which were configured to switch between regulating at 248V and 232V for 75 minute periods to determine the maximum potential energy saving and CVRf for the site. Powermonic analysers where installed to log data for each site, including voltage, kW (real power), kVAr (reactive power), kVA (apparent power), power factor (pf) and flicker for power quality.
The Project ran between August 2009 and February 2010. As a result of the positive findings on site, all LVRs have been left installed, with the voltage level permanently regulated to 228V for the Smithfield and Yarrabah sites and 230V for the Yungaburra site. The Yungaburra site has a higher voltage as there is a substantial distance between the LVR installation and the work shop and office. This increased voltage is to account for any potential voltage losses that may occur due to this distance and ensure suitable voltage at the point of use.
Site Summary
The data obtained over the duration of the project was analysed by statistical CVRf analysis software “CVRF Values” as supplied by Microplanet. Due to the complexity in statistically analysing CVRf values a detailed explanation of the statistical analysis will not be presented in this report. Documentation regarding the statistical analysis process and software is available. For the purposes of this report the CVRf values presented are the statistical mean sum values as calculated by the CVRf Values software.
Site 1: Smithfield Police Station
The site was recently redeveloped with a number of energy saving options installed including the extensive use of T5 fluorescent lighting, extensive use of flat panel monitors and
controlled use of hot water systems and zip boilers. The majority of the site load consisted of 2 three phase air-conditioning units, 4 single phase split system air-conditioners, electronic loads (PCs) and T5 fluorescent lighting. Considering the energy conservation methods already introduced the site still showed reasonable savings.
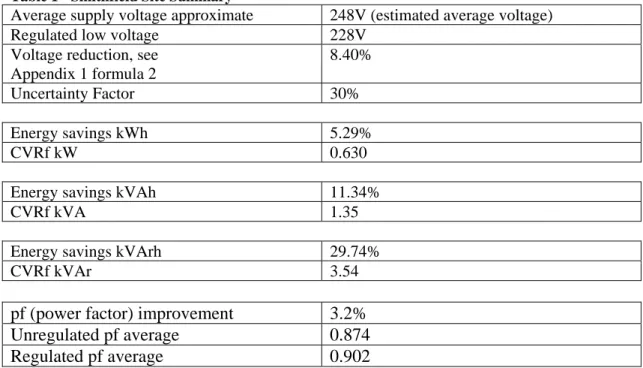
Table 1 - Smithfield Site Summary
Average supply voltage approximate 248V (estimated average voltage)
Regulated low voltage 228V
Voltage reduction, see Appendix 1 formula 2
8.40%
Uncertainty Factor 30%
Energy savings kWh 5.29%
CVRf kW 0.630
Energy savings kVAh 11.34%
CVRf kVA 1.35
Energy savings kVArh 29.74%
CVRf kVAr 3.54
pf (power factor) improvement
3.2%
Unregulated pf average
0.874
Regulated pf average
0.902
Demand savings approximate energy savings see
Installation of the LVRs were completed in August 2009, with the LVRs commissioned and operating without major issue. Three single phase LVR units were installed within the
switchboard and plant room at the site. The only installation issue was space due to the size of the generation 1 LVRs. The site had a bypass switch installed to allow work to be done on the site without having the power continuously off-line whilst work was being done. To reduce the wiring and conduits, the LVR neutral connections were combined and run as one wire to the main neutral bus and the same was done for the earth connections. If installing the LVRs in this configuration, care must be taken to ensure that the main earth and neutral wires are capable of handling potential fault currents.
A short survey of employees at the site revealed no noticeable changes in the operation of any appliance. Lighting, air-conditioning and other electronic loads performed without any noticeable change. There was a reported 7% decrease in the electricity cost over the same period from the previous year, this may be due to other energy saving initiatives as well as the LVR. The only negative response was with regard to the down-time for installation, which is unavoidable when installing this type of device.
Overall there was positive feedback on the installation of the LVR.
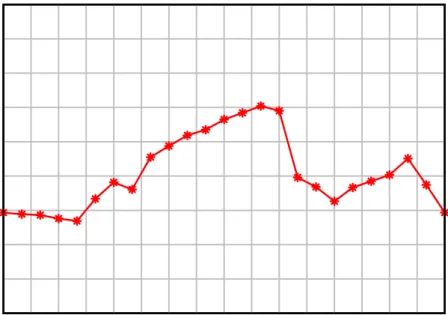
Figure 2 - Smithfield Load Profile shows a typical commercial load profile, with the main load occurring between 8:00am and 4:00pm. The main difference with a typical commercial premise is the second peak at 10:00pm (expected to be due to hot water on an off peak tariff) and the high overnight load, due to the 24-hour nature of the police station.
Figure 2 - Smithfield Load Profile Time (hrs) Ave rag e Pow e r (w atts)
Average 24 Hr Load Profile Smithfield police Station
0 3 6 9 12 15 18 21 24 0 4000 8000 12000 16000 20000 24000 28000 32000 36000
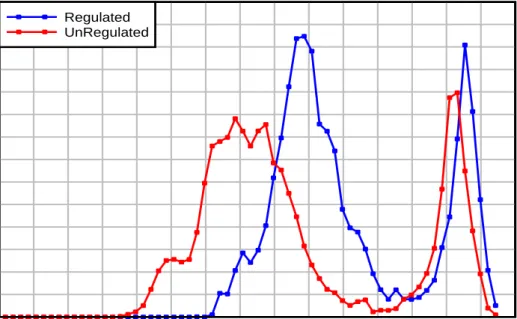
Figure 3 - Smithfield High Voltage vs Low Voltage Load Profile demonstrates the load profile of the police station broken into two load profiles. One load profile for the high voltage cycles (blue) and one load profile for the low voltage cycles (pink). It can be noted that the low voltage load profile maintains a reasonable consistent track below that of the high voltage load profile demonstrating that under low voltage regulation the overall energy consumption is reduced.
Figure 3 - Smithfield High Voltage vs Low Voltage Load Profile
High Voltage vs Low Voltage kW
0.000 2.000 4.000 6.000 8.000 10.000 12.000 14.000 16.000 18.000 12:0 0:0 0 A M 1:0 0:0 0 AM 2:0 0:0 0 AM 3:0 0:00 AM 4:00 :00 A M 5:00 :00 A M 6:00 :00 AM 7:00 :00 AM 8:0 0:0 0 AM 9:0 0:00 AM 10: 00:00 AM 11:00 :00 A M 12: 00:00 PM 1:00 :00 P M 2:00 :00 P M 3:00 :00 PM 4:0 0:0 0 PM 5:0 0:0 0 PM 6:0 0:00 PM 7:00 :00 P M 8:00 :00 P M 9:00 :00 PM 10:0 0:0 0 P M 11: 00:0 0 P M Time kW High Voltage 243V Low Voltage 231V
The statistical analysis of the power factor over the evaluation period can be represented in graphical form as per Figure 4 - Smithfield Power Factor the graph frequency distribution of power factor values for the test period at the site. Blue represents low voltage regulation and the red represents high voltage regulation. An ideal site will have the highest representation of power factor counts close to unity. As can be seen from Figure 4 - Smithfield Power Factor, the regulated voltage curve has a higher proportion of counts closer to unity than the unregulated curve. This shows that at lower voltage, the power factor is, in general,
improved. It can also be seen from the peaks that the further away from unity the power factor is, the larger the power factor improvement voltage regulation provides.
Figure 4 - Smithfield Power Factor
Power Factor C o u n t (fre q )
Power Factor Histogram Smithfield Police Station
0.7 0.74 0.78 0.82 0.86 0.9 0.94 0.98 0 300 600 900 1200 1500 1800 2100 Regulated UnRegulated
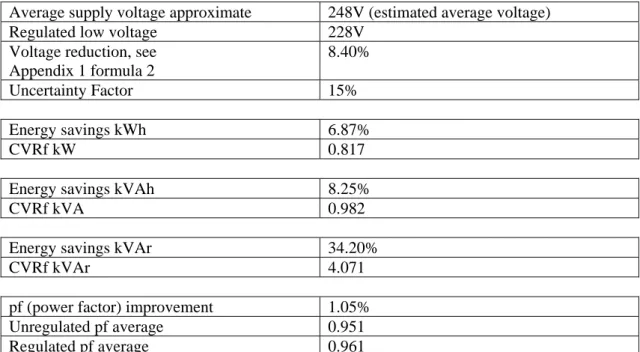
Site 2: Queensland Health Residence/Office Yarrabah
A single phase domestic/office building has one LVR installed. The domestic portion of this building has a two adults living in the residence and the office portion was not used daily, thus the load profile of this site was low. The site contained a mixture of small office and domestic loads including PC’s, faxes, printers, television, air-conditioning, mixed lighting, etc.
Table 2 - Yarrabah Site Summary
Average supply voltage approximate 248V (estimated average voltage)
Regulated low voltage 228V
Voltage reduction, see Appendix 1 formula 2
8.40%
Uncertainty Factor 15%
Energy savings kWh 6.87%
CVRf kW 0.817
Energy savings kVAh 8.25%
CVRf kVA 0.982
Energy savings kVAr 34.20%
CVRf kVAr 4.071
pf (power factor) improvement 1.05%
Unregulated pf average 0.951
Regulated pf average 0.961
The Yarrabah site, consisting of a small office and residence had the smallest overall load of all sites. The small load meant the LVR losses contributed more significantly to the total site load, reducing overall savings. The monitoring equipment was also operating at the lower limits of accuracy which may introduce errors in the results, especially overnight during the lowest load times.
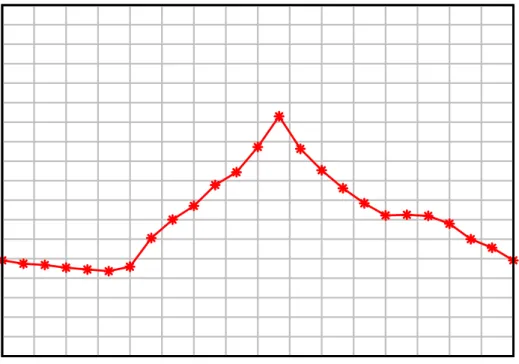
The load profile, Figure 5 - Yarrabah 24 Hour Load Profile, suggests this is not a
conventional domestic load, as there is no significant peak in the morning and evening. The major peak occurs in the middle of the day due to the small office that also operates from the building, although not operating daily the aggregated office load is still a large portion of the overall site load.
Figure 5 - Yarrabah 24 Hour Load Profile Time (hrs) Aver ag e Power ( w a tts)
Average 24 Hr Load Profile Yarrabah 0 3 6 9 12 15 18 21 24 0 400 800 1200 1600 2000 2400 2800 3200 3600
When splitting the high voltage and low voltage load profiles as shown in Figure 6 - Yarrabah High Voltage vs Low Voltage Load Profile the site savings are clearly present, as the low voltage load profile curve sits clearly below the high voltage load profile; the peak at midday is also substantially reduced. This may indicate that at peak times savings can be greater than the average.
Figure 6 - Yarrabah High Voltage vs Low Voltage Load Profile
High Voltage vs Low Voltage kW
0.000 2.000 4.000 6.000 8.000 10.000 12.000 12: 00:0 0 AM 1:00 :00 AM 2:00 :00 AM 3:00: 00 A M 4:00: 00 AM 5:00: 00 AM 6:00 :00 A M 7:00 :00 AM 8:00: 00 AM 9:00 :00 AM 10:0 0:00 A M 11: 00:00 A M 12:0 0:00 P M 1:00: 00 PM 2:00 :00 P M 3:00 :00 PM 4:00: 00 PM 5:00 :00 PM 6:00 :00 PM 7:00: 00 P M 8:00 :00 PM 9:00: 00 PM 10:0 0:00 P M 11:0 0:00 P M Time kW High Voltage Low Voltage
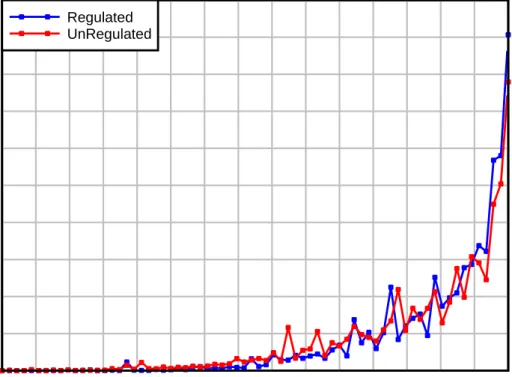
Figure 7 - Yarrabah Power Factor Power Factor Co un t (fre q)
Power Factor Histogram - Yarrabah
0.7 0.74 0.78 0.82 0.86 0.9 0.94 0.98 0 1000 2000 3000 4000 5000 6000 7000 8000 9000 10000 Regulated UnRegulated
The power factor at the Yarrabah site was good without voltage regulation, Figure 7 - Yarrabah Power Factor shows the high and low voltage curves basically overlaid with a substantial portion of the counts at or near unity.
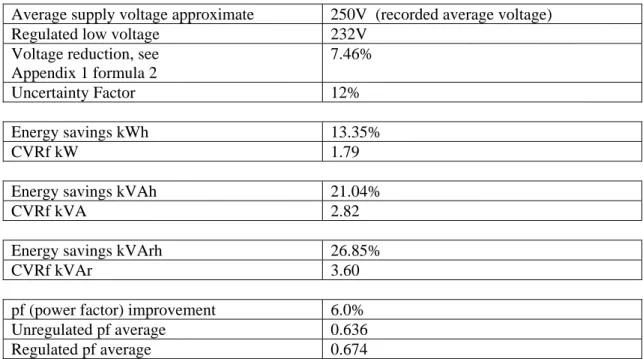
Site 3: DERM Workshop/office
This office/workshop single phase site demonstrated the largest energy savings. The site consists of typical small workshop with loads including air compressors, welders, etc., along with a small office including several PCs, air-conditioners and some heating loads. All lighting was standard fluorescent with magnetic ballasts, which are known to show savings with voltage reduction.
Table 3 - Yungaburra Site Summary
Average supply voltage approximate 250V (recorded average voltage)
Regulated low voltage 232V
Voltage reduction, see Appendix 1 formula 2
7.46%
Uncertainty Factor 12%
Energy savings kWh 13.35%
CVRf kW 1.79
Energy savings kVAh 21.04%
CVRf kVA 2.82
Energy savings kVArh 26.85%
CVRf kVAr 3.60
pf (power factor) improvement 6.0%
Unregulated pf average 0.636
Regulated pf average 0.674
The Yungaburra site, is a DERM site comprised of a workshop and small office located on a SWER line. The site was expected to show good savings, as the site voltage measured was high and the loads consisted of small motors and older magnetic ballast fluorescent lighting (running 24 hours per day as a vermin deterrent).
Losses due to the LVR were also monitored at this site with PM45 data loggers measuring the load before and after the LVR. The LVR consumed 20kWh vs 2471kWh (including LVR losses) for the site over the logging period. Over the trial period the LVR losses accounted for 0.8% of the site load, thus reducing the total savings by voltage regulation to 12.55% In appropriately selected sites the LVR losses are minor compared to the overall energy savings. The load profile is shown in Figure 8 - Yungaburra 24 Hour Load Profile as a typical
commercial profile. High loads occur between the hours of 6:00am and 3:00pm whilst the overnight load remains quite high as a result of 24 hour lighting for vermin control.
Figure 8 - Yungaburra 24 Hour Load Profile Time (hrs) Aver ag e Po we r (watts)
Average 24 Hr Load Profile - Yungaburra
0 3 6 9 12 15 18 21 24 1000 1250 1500 1750 2000 2250 2500 2750 3000 3250 3500
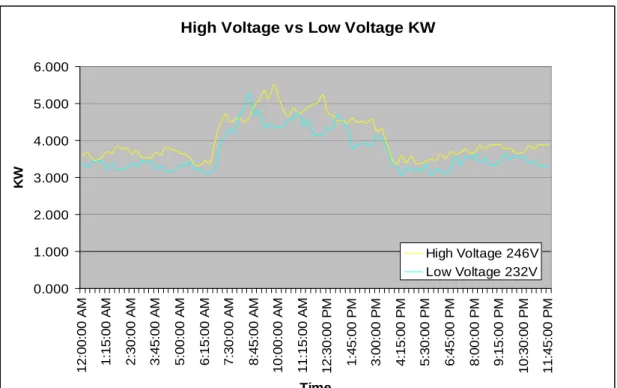
Figure 9 - Yungaburra High Voltage vs Low Voltage Load Profile shows that the low voltage
power is consistently below that of the high voltage, thus representing the savings due to regulating the voltage to 232V.
High Voltage vs Low Voltage KW 0.000 1.000 2.000 3.000 4.000 5.000 6.000 12 :00: 00 A M 1 :15: 00 A M 2 :30: 00 A M 3 :45: 00 A M 5 :00: 00 A M 6 :15: 00 A M 7 :30: 00 A M 8 :45: 00 A M 10 :00: 00 A M 11 :15: 00 A M 1 2 :30: 00 P M 1: 45: 00 P M 3: 00: 00 P M 4: 15: 00 P M 5: 30: 00 P M 6: 45: 00 P M 8: 00: 00 P M 9: 15: 00 P M 1 0 :30: 00 P M 1 1 :45: 00 P M Time KW High Voltage 246V Low Voltage 232V
A marked overall improvement in the power factor can be seen from Figure 10 -Yungaburra Power Factor, with the peaks for the blue low voltage curves closer to unity than the red high voltage curves.
Figure 10 -Yungaburra Power Factor
Power Factor
Co
un
t (fre
q)
Power Factor Histogram - Yungaburra
0.3 0.4 0.5 0.6 0.7 0.8 0.9 1 0 300 600 900 1200 1500 1800 2100 Regulated UnRegulated
Peak demand, demand and energy reduction
The calculations for energy reduction are an average over a long period to account for usage patterns, demand peaks and climate variations. Due to the calculation method there will be variability between energy savings and demand savings. At any particular instance demand savings may be higher or lower than energy savings. However with load diversity demand savings are expected to approximate energy savings within the confidence level of the calculations.
High CVRf devices such as magnetic ballast fluorescent lighting will have the same reduction effect on peak load as well as energy, e.g. fluorescent lighting energy savings of 15% will equate to demand savings of 15%.
Devices such as electronically controlled devices, PCs, Plasma TVs, variable speed/variable frequency drives have a low CVRf and may save 5% of energy with voltage reduction hence save on average 5% of demand.
Additional gains in demand reduction can come from some low CVRf appliances like
resistive thermostatically controlled devices. One such example is resistive hot water systems which have a very low CVRf, hence little or no energy savings. They use a consistent amount of energy to heat water independent of voltage. While these appliances have little impact on energy savings with voltage reduction, they do have an impact on demand as their
instantaneous power use reduces with a reduction in voltage. Eg. Resistive hot water system
P=V2/R
Vhigh 245V Vlow 235V
Energy to heat water = 2KWh
Resistive element is a constant 100ohms
Peak power high voltage = 2452/100 = 600W
Peak power low voltage = 2352/100 = 552W
Time to heat water = energy / power Time to heat water at high voltage = 3.3hrs Time to heat water at low voltage = 3.6 hrs
In the case above reduction in voltage is 4.16% and the reduction in demand is 8.33% with no reduction in energy.
Rule of thumb, demand reductions approximate energy reductions provided there is load diversity. There are no circumstances where voltage reduction will increase demand.
Efficiencies and LVR losses
The LVR energy losses from operation are represented in Figure 11- LVR Loss vs Load Current, and the LVR efficiency is represented in Figure 12 - LVR Efficiency vs Load Current. These figures are from the LVR energy reduction phase 2 report.
The LVR loss must be accounted for in the overall energy savings associated with installation of LVR’s for energy conservation ie measure load at input to the LVR. For loads of above 20A (4.8kW), the load due to the LVR accounts for approximately 1% of the total load. Recordings at Site 3 confirmed this, with a measured average loss due to the LVR of approximately 0.8% of the site load.
Figure 11- LVR Loss vs Load Current
Losses vs Load Current
0 20 40 60 80 100 120 140 160 180 200 0 10 20 30 40 50 60 70 80 90
Load Current (Amps)
L o sses ( W at ts ) 245 V IN 230 V OUT 252.5 V IN 230 V OUT
Figure 12 - LVR Efficiency vs Load Current
Using Figure 11- LVR Loss vs Load Current and assuming a worst case linear loss curve from 0 to 20A results in the equation
30 * 25 . 1 + = LoadCurrent ts LossLVRWat
At loads of above 20A the LVR’s losses are nearly linear and are at the lowest, therefore energy savings must be above 1% in order to counteract the LVR installation load increase, if the load is above 20A.
Figure 13 - Zero Net Load Increase Due to LVR below represents the supply voltage required for various CVRfs so that the installation of the LVR has no net increase on the site load, i.e. is power neutral. The graphs use the loss formula above for calculation of the LVR losses and assume regulating to the minimum allowable regulatory limit 227V.
From Figure 13 - Zero Net Load Increase Due to LVR we can determine that the minimum average supply voltage to guarantee no net loss for a site with a low CVRf is approximately 235V for loads above 20A 4.8kW. For loads below 4.8kW there has to be a combination of either, a supply voltage higher than 235V or a CVRf higher than 0.3. Considering the difficulty in calculating an accurate CVRf, voltage and load should be the primary selection criteria followed by site load types.
Figure 13 - Zero Net Load Increase Due to LVR
Zero Net kW Increase Curves Due To LVR Installation
Supply Voltage vs Load kW for varying CVRf values, Regulated Voltage 227V
220 230 240 250 260 270 280 290 300 310 320 330 340 0.00 1.00 2.00 3.00 4.00 5.00 kW Load Vo lt s CVRf = 0.3 CVRf = 0.5 CVRf = 1.0 CVRf = 1.5
Power Quality - Regulation
Power quality and regulation of the Microplanet LVR is covered in detail in the “Guidelines for Use and Application of the Low Voltage Regulator (LVR) for SWER Voltage
Improvement” authored by Peter Bacic. This report will only address power quality issues recorded during the trial.
The Microplanet LVR can regulate to within 1% of the set point and effectively achieves this under all standard operating conditions. This accuracy provides the customer with accurate voltage stability and in the case of three phase customers, the voltage balance is improved over standard supply voltage balance as can be seen from the image below. This can result in
significant benefits for motor life
.
Figure 14 - Three Phase Voltage, Regulated and Unregulated
The unregulated voltage RMS levels can be seen on the left where the three phases are varied as opposed to when the voltage for each phase is regulated as shown on the right.
The main power quality issues arise when the LVR goes into bypass mode without interrupting site supply. Bypass mode is a mode of operation that protects the LVR from damage and can be instigated under the following conditions:
1. Over current; peak current exceeding 180A
2. Over voltage; a supply voltage in excess of 263.6V
3. Under voltage; a supply voltage below 189V
The LVR will attain regulation 30 seconds after the fault of condition has cleared; i.e. if there is a motor start with a peak current of 180A, the LVR will go into immediate bypass, then once the motor inrush current has settled, the LVR will attain regulation 30 seconds later. The main issue with the LVR entering bypass mode is the output will go from regulated voltage, e.g. 228V, to supply voltage which may be as high as 254.4V. This sudden step in voltage may result in noticeable flicker. In the case of three phase installations, it may cause phase imbalance if one regulator goes into bypass while the other two LVRs continue regulating.
One of the main causes of LVR bypass is motor starts, as the DOL motor currents can often exceed 180A.
A classic example of a motor start can be clearly seen from a voltage capture from Site 3, the DERM workshop (Figure 15 - Motor Start voltage and current averaged 1 minute RMS). Figure 15 - Motor Start voltage and current averaged 1 minute RMS
Red = supply voltage, approximately 248V
Green = regulated output voltage approximately 232V
In
Figure 15 - Motor Start voltage and current averaged 1 minute RMSbetween the two vertical
bars a substantial jump can be seen in the green RMS current and green RMS voltage. Closer inspection reveals that the motor start drags the supply voltage from 336Vpp to 300Vpp, and a current that jumps from 25A to well over 155A, (the current transformers used in measuring saturated at 155A), the peak current is estimated at around 200A based on extrapolation from the current graph in figure Figure 16 - Wave capture motor start.
Figure 16 - Wave capture motor start
The RMS graphs, Figure 17 - RMS Voltage and Current Bypass, show the LVR goes into immediate bypass and passes the supply voltage directly to the output. After a period of some seconds the LVR started to regulate and began ramping to the set point voltage. This can be clearly seen as the red (supply) and green (LVR output) line diverge toward to the end of the RMS event capture.
Figure 17 - RMS Voltage and Current Bypass
This sudden voltage change may cause flicker issues on single phase installations and on three phase installation, as there are three LVR’s, it is possible to have 1 LVR out of regulation and 2 LVR’s in regulation thus creating the possibility for voltage imbalance.
Installation
The generation 1 LVR is designed for pole mount applications with the instructions and mounting guidelines for pole mounting contained in “Guidelines for Use and Application of the Low Voltage Regulator (LVR) for SWER Voltage Improvement” authored by Peter Bacic.
When mounting the LVR at customer premises the trial revealed several key issues to be aware of:
• The LVR itself is quite large therefore mounting in a three phase installation requires
• The LVR has exposed terminals which require double insulation.
• The best installation position is after circuit protection devices, however provided
there is sufficient upstream protection and all electrical safety and guidelines are adhered to the LVR may be installed in any electrical location within a premise. While the installation of the current generation of LVRs inside a customer premise pose some challenges it is possible to install the LVRs with suitable shrouding. Figure 18 - LVR
installation with mounting block and terminal covers shows the installation of the LVR with appropriate terminal covers. What is not shown is the terminals have secondary insulating cover underneath the outside shroud providing double insulation.
Figure 18 - LVR installation with mounting block and terminal covers
Energy Conservation and Power Quality
Where LVRs are installed for power quality purposes consideration should be given to voltage regulation set points. Where it is deemed necessary to install LVRs to improve power quality on overloaded feeders, if care is not taken with respect to the voltage regulation set point, the LVRs may increase site and network demand and customer energy costs.
Where the natural result of line loading is reduction of voltage at the consumers terminals, the LVR will keep the voltage stable at a level that may be higher than the line voltage under load. This possible increase in voltage at peak times would cause an increase in energy use. In a non resilient feeder that has naturally occurring large voltage swings a low LVR set point voltage will have little chance of energy savings at peak times however a high set point may increase the peak demand.
An example of voltage regulation set point
A highly loaded feeder is chosen for large scale installation of LVRs to improve power quality. The average customer voltage on this feeder may be 250V, however under peak load conditions the voltage may sag to 232V.
The installation of LVRs will rectify the sag issue as seen by the customer by holding the voltage at the point of supply to 245V (the current standard voltage set point).
Assuming a feeder with 30 sites, ie 30 LVRs
Additional losses due to the LVR’s under load (peak load times) : 30 x 120W 3.6kW.
Added to this is the load due to a higher regulation voltage at peak time:
Best case kVA CVRf measured 1.35 – Site 1 assuming a sag voltage under full load of 232V, regulation voltage 245V, an increase of 5.45%.
Given a CVRf for kVA of 1.35, the increase at peak load would be: 7.35% + loss due to the LVR.
Worst case CVRf 2.82 - Site 3 13.35% + loss due to the LVR.
If at peak load, without regulation, the feeder was 200kW, this would result in an increase of between 18.3kW and 30.23kW due to the choice of a 245V regulation voltage level.
The above is a simplistic example and more detailed modelling is required to confirm the exact savings or losses due to the many factors at play.
A typical feeder will have higher and more stable voltage closer to the isolator or line regulator, and further away from the isolator/regulator, voltage is likely to be less stable and lower, depending upon loads. Under these conditions, setting low regulated voltages on LVRs populated over the length of the feeder should result in higher energy savings for customers at the start of the feeder with slowly decreasing savings toward the end of the SWER. The amount of savings would be heavily dependant on the feeder conditions and loads.
Conversely setting a high regulation voltage 245V may introduce small savings at the start of a feeder where the typical voltage may be above that, but will likely introduce large losses toward the end of a feeder where the voltage may be boosted from 232V up to 245V. This high voltage 245V+ may have the impact of increasing loading on feeder fringes.
If there is substantial voltage swing on a feeder the installation of LVRs will improve power quality, but may not produce relief from peak demand issues, conversely a high set point voltage may make peak demand issues worse. If the voltage under peak demand does not sag substantially, then it is possible to see peak demand savings by setting the LVR regulation voltage low.
This trial did not evaluate customer behaviour with relationship to peak demand and
improved power quality issues or if there is any relation between improved power quality and increase customer energy use.
Commercial installation decision
If LVRs are installed by the utility in order to reduce network demand the commercial decision is somewhat more complicated. The commercial costs of the LVR installation need to be weighed against network augmentation costs and the benefits of both solutions. Compared to network augmentation costs LVRs may be the lower cost option and can provide power quality improvements and energy and customer cost reductions. Utility
interests in demand reduction and supply quality improvement generally relate to stressed networks, feeders or transformers. In these cases it may be necessary to install LVRs across a feeder, or at least on the major loads on a feeder, in order to provide a cumulative reduction in energy at the substation.
Where the LVRs are customer owned, that is purchased by the end customer for the sole purpose of reducing energy, voltage regulation or voltage balancing. The commercial decision for installation will be based upon acceptable payback times, thus related to installation costs, unit costs and estimated savings. The energy savings due to voltage regulation will be an estimate due to the variance associated with CVRf accuracy, the fluctuations of supply voltage and appliance efficiency.
The primary consideration for energy reduction with voltage regulation is high voltage, site load and CVRf. In order to obtain substantial savings the voltage needs to be in excess of 240V on average and preferably greater than 245V. The average site load for any 24 hour period should be greater than 72kWh with a peak load not exceeding 20kW.
To directly calculate CVRf it would be necessary to install an LVR in switching mode, as the calculation method requires switching the voltage from a low voltage to a high voltage. As such the CVRf can only be calculated after LVR installation and requires reasonable power monitoring and calculation.
An alternate method to generate the CVRf is to estimate the CVRf value based on a site energy audit. It is suggested to break the CVRf values into 3 segments, low, medium and high CVRf based on the number and types of site appliances:
1. Low CVRf < 0.7: a site that has extensive use of energy efficient appliances,
lighting, heating and cooling. A typical site will have heat pump/solar hot water heating, inverter air-conditioning and electronic ballast fluorescent lighting or high efficiency lighting. In these cases it is suggested using CVRf 0.5 for calculations. Low CVRf will have generally lower savings but low CVRf sites may still benefit from voltage regulation. A more detailed assessment may need to be performed in order to justify LVR installation.
2. Medium CVRf 0.71 – 1.30: a site that has some energy efficient appliances. A
typical site may include inverter air-conditioners, 5 star fridges, electronic ballast fluorescent lighting as well as existing old motors. In these cases it is suggested using CVRf 1.0 for calculations. Medium CVRf sites will benefit from voltage regulation, although some consideration needs to be given to the level of savings.
3. High CVRf >1.3: a site that has little or no energy efficient appliances or lighting
and a high portion of motor loads. A typical site would include incandescent or fluorescent lights with magnetic ballasts, HID lighting, small motors (eg.
workshop), appliances that are typically manufactured prior to the year 2000. It is suggested using CVRf of 1.6 for calculations. High CVRf sites will benefit greatly from voltage regulation and the installation of voltage regulators should be given priority for these sites.
The estimation of CVRf is based on the knowledge and experience of the person performing the energy audit and can be used to estimate energy savings without the physical installation of an LVR.
Rule of thumb for installing LVR’s for energy conservation. Voltage >240V and preferably > 245V on average Average Daily Site Load > 72kWh
Peak Load < 20kW CVRf > medium i.e. >1.0
Estimated savings example:
Voltage 245V
Average Daily Load 168kWh
Medium energy efficiency initiatives in place Estimated CVRf = 1.0
Regulating to 228V, Voltage reduction = 7%, Energy reduction = 7%
Savings equate to 11.76kW/hour per 24 hour period Using current energy cost $0.1884 kWh
Annual savings $808.70
Monetary savings will increase as energy prices increase above the $0.1884/kWh as used for the above calculations.
ts
Energy
savings
energy
Yearly
t
Unit
t
on
Installati
years
back
Pay
cos
_
*
_
_
cos
_
cos
_
_
_
=
+
A simplified pay back time formula is represented above, as can be seen and decrease in unit or installation cost or increase in energy costs can have significant impact on the payback times.
Appendix 1. CVRf Calculation
Voltage reductions will impact energy consumption of appliances in different ways. In order to quantify the relationship between voltage change and energy consumption reduction, the Conservation Voltage Reduction Factor (CVRf) is introduced:
Voltage
Difference
reduction
Energy
Difference
CVRf
_
%
_
_
%
=
(1)Refer “Energy Efficiency, Customer research & Development, Sacramento Municipal Utility District, December 5, 2007”
where the percent difference between two values v1 and v2 is defined as:
(
)
100 2 ) 2 1 ( 2 1 % × + − = v v v v Difference (2)A CVRf value corresponds to the energy consumption reduction of an appliance for a given reduction in voltage: a CVRf of 1 means that for every 1% of voltage reduction, a 1% reduction in energy consumption can be expected. Approximate CVRf values can be assigned to many appliances. It should be noted that CVRfs may vary widely from appliance to appliance.
For each site this value varies continuously as each of the input factors vary. For a site where significant data is taken in high and low voltage modes, the CVRf calculation can be plotted for all instances and the result is a combination of the Centroid and the Peak with the variance a representation of the accuracy or the difference between these two values. CVRf
calculation is not an exact process due to many factors that affect the load in a building. To calculate the CVRf values for this trial, the LVRs were configured to switch between high and low voltage on a 75 minute cycle. This 75 minute cycle ensures that over time, every portion of the day would have a high voltage and a low voltage period. The 75 minute cycle will repeat every 5 days and the daily 75 minute profile will repeat every 35 days.
Large variance in the CVRf is common, as the CVRf is dependant on load and usage patterns. In the case of Smithfield Police Station, the uncertainty in CVRf appears high so some
caution must be taken into account when quoting this CVRf value. The variance is due to site loads and site usage patterns. The CVRf uncertainty may not necessarily improve with a larger number of data samples.
In order to represent the CVRf with some confidence statistical analysis, software CVRFacts provided by Microplanet was used to analyse and calculate CVRfs for kW, kVA, kVAr and associated statistical analysis of the data. The CVRfacts software results were verified by Ergon Energy devised spread sheets. The Ergon Energy spread sheet calculated CVRf was a close approximation to the CVRfacts CVRf Sum values.
The CVRfacts software produces multiple statistical values for the CVRf, these values represent the CVRf utilising a different statistical analysis methods. For the purposes of this report the CVRf Sum (statistical sum) value was taken as the true CVRf value. There is some debate as to the true CVRf value the best statistical method to calculate the CVRf, however at this point in time the statistical sum method is considered to be the most reliable calculation. More detail on the statistical analysis methodology and software is available upon request, with detailed examination of the various statistical analysis methods and details on analysing a CVRf calculation.
Appendix 2. Site Survey Questions
Questions concerning LVR installationThe LVRs control the voltage supplied to the site, but the voltage always remains within the regulatory limits.
1. Since the installation of the LVR, have you noticed any noticeable changes in the performance of any of the following appliances;
An example of noticeable change: lower replacement of light bulbs, or lighting appearing dimmer, etc.
a. Lighting
b. Air conditioning
c. Electronic Devices, computers, faxes printers
d. Refrigeration
e. Other equipment, washing, drying, cooking, air compressor, drills etc.
2. If you have received a bill in the previous 2 months, do you feel the bill has increased or decreased compared to a bill for the same period from last year. We are not after an exact change, just your feeling toward difference, if any, in the bill.
3. Do you feel the installation of the LVR has been to the benefit, detriment, or made no
impact to your site?