Y. Wang and T. Li (Eds.): Foundations of Intelligent Systems, AISC 122, pp. 249–257. springerlink.com © Springer-Verlag Berlin Heidelberg 2011
Machines for Activity-Based Transportation Models
Banghua Yang1,2, Davy Janssens1, Da Ruan1,3, Mario Cools1,
Tom Bellemans1, and Geert Wets1
1 IMOB, Hasselt University, 3590, Hasselt, Belgium
2 Department of Automation, College of Mechatronics Engineering and Automation;
Key Laboratory of Power Station Automation Technology; Shanghai University, Shanghai 200072, China
3 Belgium and Belgian Nuclear Research Centre (SCK-CEN), Belgium
{Banghua.yang,Davy.janssens,Mario.cools,tom.bellemans, geert.wets}@uhasselt.be, [email protected]
Abstract. In this paper, a data imputation method with a Support Vector Ma-chine (SVM) is proposed to solve the issue of missing data in activity-based di-aries. Here two SVM models are established to predict the missing elements of ‘number of cars’ and ‘driver license’. The inputs of the former SVM model in-clude five variables (Household composition, household income, Age oldest household member, Children age class and Number of household members). The inputs of the latter SVM model include three variables (personal age, work status and gender). The SVM models to predict the ‘number of cars’ and ‘driver license’ can achieve accuracies of 69% and 83% respectively. The initial expe-rimental results show that missing elements of observed activity diaries can be accurately inferred by relating different pieces of information. Therefore, the proposed SVM data imputation method serves as an effective data imputation method in the case of missing information.
Keywords: Activity-based transportation models, Support Vector Machine (SVM), Data imputation, Missing data.
1 Introduction
Activity-based approaches in transportation models aim at predicting which activities are conducted where, when, for how long, with whom, the transport mode involved and so on. The activity-based approach is a sound option to model people’s travel be-havior, which has set the standard for travel demand modeling during the last decade [1]. The basic premise of this approach is that travel demand is derived from the ac-tivities that individuals and households need or wish to perform. A dynamic activity-based travel demand framework, FEATHERS (Forecasting Evolutionary Activity Travel of Households and their Environmental RepercussionS) has been developed for Flanders (the Dutch speaking region of Belgium) based on the above aim [2-4]. The FEATHERS to be applied for the whole Belgium is currently being developed at IMOB. To build the FEATHERS model that can predict all of those above facets, one
requires data on all these facets. Clearly, the data collection is a huge challenge [5]. One of the main data sources is activity-based diaries. The collection of diary data frequently brings a huge burden on respondents. Consequently, activities diaries tend to contain incomplete information due to various reasons, which is a serious problem because activity-based models require complete diary information [6].
Activity diaries used in the existing FEATHERS mainly contain individual surveys and household surveys. The collected surveys are composed of 8551 samples of households and 15888 samples of personals in Belgium. Each sample includes many variables. Among all samples, about 10% samples of households and 5% samples of personals exist missing information. If all samples that contain any missing values are deleted and the analysis is then carried out on the samples that remain, some serious drawbacks will be brought. One of drawbacks is the reduction of samples, which will affect the predicting reliability and quality of the FEATHERS model. The other is that the elimination of useful information in the sample will result in serious biases if the samples are not missing completely. The interest of this paper has centered on performing data imputation, the process by which missing values in a data set are es-timated by appropriately computed values, thus constructing a complete data set.
More recently, with the development of computer science and technology, some artificial intelligence and machine learning techniques have arisen in the area of miss-ing data treatment, such as neural networks, fuzzy logic systems, and rough sets, which stimulate the missing data research to a new stage. In this paper, the support vector machine (SVM) is proposed to predict the missing values of two variables. The SVM is a new generation learning system based on recent advances in statistical learning theory [7, 8]. SVMs have been applied in many areas such as text categoriza-tion, hand-written character recognicategoriza-tion, image classificacategoriza-tion, and bio-sequences analysis [9, 10]. Here two SVM models are established to predict the missing ele-ments of number of car and driver license respectively. The first SVM model to pre-dict the ‘number of car’ achieves an accuracy of 69%. Meanwhile, the second SVM model to predict ‘driver license’ can obtain an accuracy of 83%. The results are veri-fied by a four-fold cross-validation.
2 Data Description
Since the objective of the activity diary is to give a representative description of the travel behavior of the population in Belgium, the target population in the project was defined as “all the people residing in Belgium, regardless of their place of birth, na-tionality of any other characteristics”. Activity diaries used in the FEATHERS mainly contain individual surveys and household surveys. The data were collected in 2010, in which the individual surveys were carried out among Belgian citizens aged 6 years and above. The total number of collected sample equals 8551 households comprising 15888 individuals. In the activity diary, a household record has many variables, such as 1) the name, sex, nationality, educational certificate, and professional status of each household member; 2) the type of vehicle, number of the specified vehicle, and pur-chase year of the specified vehicle that the household possess; 3) the place of resi-dence, net income of the household, etc. The individual survey includes person ID,
the mode of travel, number of trips, the start time, the arrival time, activity type, activ-ity duration, activactiv-ity location ID, and the driver license.
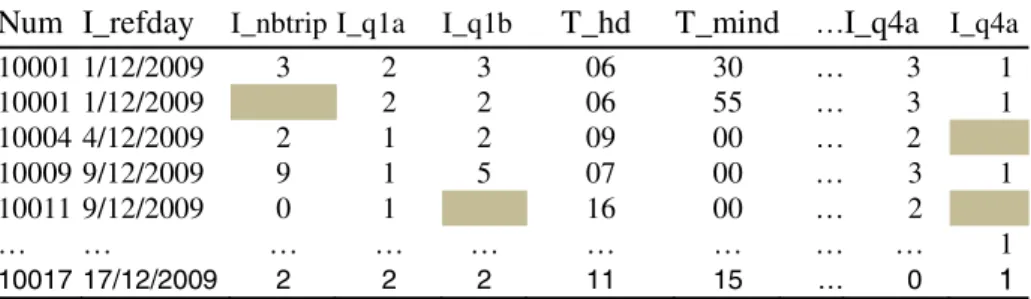
All collected surveys are summarized to excel tables. Table 1 shows a small part of samples from household surveys and Table 2 shows ones from individual surveys, in which the shading cells represent the missing data. It should be pointed out that the title of each column in tables is only a simple nomination or the question number. All data should be preprocessed to meet requirements of the FEATHERS. The FEATHERS need five files (Households, Persons, Activities, Journeys and Lags). Each file includes many variables respectively. Here the interest centers on the Households and Persons. There are eight variables (HouseholdID, Household locatio-nID, Household composition, Socio-economic class, Age oldest household member, Children age class, Number of cars and Number of household members) in the Households file. Meanwhile, the Persons file includes six variables (PersonID, HouseholdID, Personage, Work status, gender and Driver’s license). Among all sam-ples, about 10% samples of households and 5% samples of personals exist missing in-formation. How to estimate the missing information and so improve the number and quality of samples is the main concern of this paper. The following section will de-scribe a SVM method to process the missing information.
Table 1. Households data
H_id H_nper
H_oldjourH_bir H_sex H_pos
H_status
H_q2
H_q1
100015 2 1/12/2009 1983 M 2 9 1 8 100048 2 4/12/2009 1965 F 7 0 3 100081 1 7/12/2009 1941 M 1 5 1 3 100103 1 9/12/2009 1954 M 1 9 3 100125 1 11/12/2009 1937 F 1 5 0 99 100235 2 1942 M 1 5 2 7 … … … … … … … … … 100466 1 17/12/2009 1971 F 1 4 0 2
Table 2. Individuals data
Num I_refday
I_nbtrip I_q1a I_q1bT_hd T_mind
…I_q4a
I_q4a10001 1/12/2009 3 2 3 06 30 … 3 1 10001 1/12/2009 2 2 06 55 … 3 1 10004 4/12/2009 2 1 2 09 00 … 2 10009 9/12/2009 9 1 5 07 00 … 3 1 10011 9/12/2009 0 1 16 00 … 2 … … … … … 1 10017 17/12/2009 2 2 2 11 15 … 0 1
3 Data Imputation Method with SVM
3.1 The Basic Theory of SVM
A SVM is one of supervised learning methods that analyze data and recognize pat-terns, used for classification and regression analysis. It takes a set of input data and predicts which of two possible classes each given input belongs. The SVM performs classification by constructing a hyperplane that optimally separates the data into two categories. New examples are then mapped into that same space and predicted to be-long to a category based on which side of the hyperplane they fall on. A good separa-tion is achieved by the hyperplane that has the largest distance to the nearest training data points of any class (so-called margin), since in general the larger the margin the lower the generalization error of the classifier. So the key technique to SVMs is how to obtain a hyperplane that has the largest margin.
For a given training data set D,
{( ,
i i)} |
i P,
i{ 1,1},
1... ;
D
=
x y
x
∈
R
y
∈ −
i
=
n
(1)
where they
i is either 1 or −1, indicating the class to which the pointx
i belongs.Each
x
i is a p-dimensional real vector. The classification of SVM is to find themax-imum-margin hyperplane that divides the points having
y
i=1
from those havingy
i= -1
. The hyperplane with the maximum-margin can be described as follows:1
w x b
• − =
andw x b
• − = −
1
(2) where•
denotes the dot product andw
the normal vector, wb determines the offset of the hyperplane. If all data points are prevented from falling into the margin, a constraint can be added as follows:(
) 1,
i i
y w x
• − ≥
b
fori
=
1... ;
n
(3) The problem about the maximum-margin hyperplane can be described as:Minmize
w
, subject toy w x
i(
• − ≥
ib
) 1,
fori
=
1... ;
n
(4) At last , the problem can then be expressed by means of non-negative Lagrange multipliersα
i as [8] 2 , 11
min max{
[ (
) 1]}
2
n i i i w b iw
y w x
b
α−
=α
• − −
(5)
If there does not exist any hyperplane that can split the "-1" and "1" examples, a soft margin method can be introduced to choose a hyperplane that splits the examples as cleanly as possible. The method introduces a slack variable,
ξ
i, which measures the degree of misclassification of the datax
i,(
) 1
,
i i i
At the same time, the optimization problem becomes: 2 , , , 1 1 1 1 min max{ [ ( ) 1 ] } 2 n n n i i i i i i i w b i i i w C y w x b ξ α β +
= ξ − = α • − − +ξ −
= β ξ ,α β
i,
i≥
0
(7) In general, an original problem may be stated in a finite dimensional space. Themax-imum-margin hyperplane needs to be obtained by transforming the original space to a high-dimensional space, which is proposed to make the separation easier in that space. To keep the computational load reasonable, the SVM scheme is designed to ensure that dot products may be computed easily by the kernel function in the original space. This problem can now be solved by standard quadratic programming tech-niques and programs. The detailed description about SVM can be found in [9]. 3.2 Prediction for ‘Number of Cars’
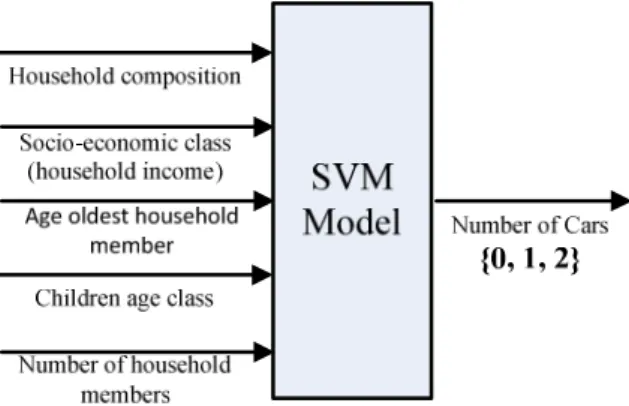
As described in Section 2, there are eight variables that are needed in the Households file to meet the requirement of the FEATHER. However, about 8% samples in this file miss information of ‘number of cars’. Since different variables are interrelated, such as ‘number of cars’ should be dependent on the income of a household, the miss-ing variable information in one sample is expected to be inferred by other variables in the same sample. Here the missing ‘number of cars’ are predicted by other five va-riables. The SVM model to predict ‘number of cars’ is shown in Figure 1. The inputs of the SVM model include Household composition, household income, Age oldest household member, Children age class and Number of household members. The output of the SVM is the ‘number of cars’, which has three values (0, 1, 2). These three values represent that a household has no car, one car, two cars or more, respectively.
Fig. 1. The SVM model to predict ‘number of cars’
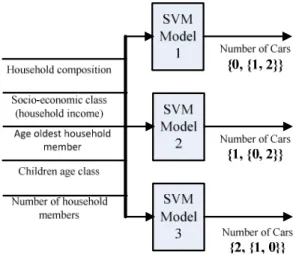
Obviously, the prediction is a three-category classification. However, a SVM is often used to distinguish two categories. The approach used in this paper for doing so is to reduce the single multiclass problem into multiple binary classification problems. First, a strategy called “one against many” is adopted, in which each category is split
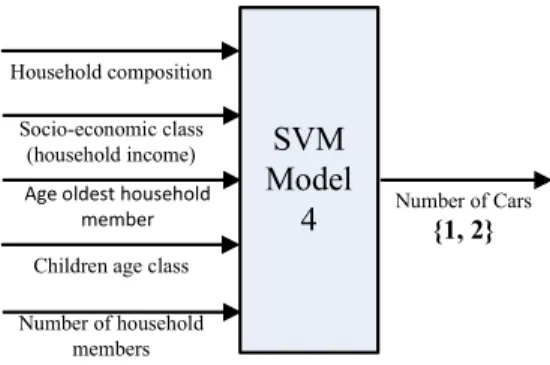
out and all of the other categories are merged. According to this strategy, three SVM models (SVM Model 1, SVM Model 2, and SVM Model 3) are established, which is shown in Fig.2. The SVM model 1 is used to distinguish label 0 and the rest, where label 1 and label 2 are merged. The SVM model 2 is used to distinguish label 1 and the rest, where label 0 and label 2 are merged. The SVM model 3 is used to distin-guish label 2 and the rest, where label 0 and label 1 are merged. The classification ac-curacy is obtained by means of a four-fold cross-validation as shown in Fig.3. From Figure 3 the SVM model 1 obtains the highest classification accuracy. And so the SVM model 1 is selected to distinguish label 0 and the rest. If a new sample is as-signed as label 0, the classification is over. Otherwise, the sample needs to be distin-guished continuously between 1 and 2, which is shown in Fig.4. After the classifica-tion of the SVM model 1 and the SVM model 4, the final label will be decided. The SVM model to predict the ‘number of cars’ can achieve an accuracy of 69% by means of a four-fold cross-validation.
Fig. 2. SVM models based on “one against many” strategy
C la ss ifi ca tio n Accu ra cy
SVM
Model
4
Household composition Socio-economic class (household income)Age oldest household member
Children age class Number of household
members
Number of Cars
{1, 2}
Fig. 4. The SVM model between label 1 and label 2
3.3 Prediction for ‘Driver License’
As described in Section 2, the Persons file used in the FEATHERS include six va-riables (PersonID, HouseholdID, Personage, Work status, gender and Driver’s li-cense). However, about 2% samples in this file miss information of ‘driver license’. Considering the relativity between Personage, Work status, gender and driver license, here the missing ‘driver license’ data are predicted by the other three variables (Per-sonage, Work status, and gender). The SVM model to predict ‘driver license’ is shown in Figure 5. The inputs of the SVM model include Personage, Work status and gender. The output of the SVM is the ‘driver license’, which has two values (0 and 1). These two values represent that a person has no driving license or has a driving li-cense. The SVM model to predict the presence of the driving license can obtain an accuracy of 83 % by means of a four-fold cross-validation.
Fig. 5. The SVM model to predict ‘driving license’
4 Results and Discussions
In this paper, two SVM models are established to predict the ‘number of cars’ and ‘driver license’ respectively. During the prediction for ‘number of cars’, two neces-sary steps are taken. In the first step, a strategy called “one against many” is adopted and the best result is obtained by distinguishing between label 0 and the rest. The la-bel 0 represents a household has no car and the rest (lala-bel 1 and lala-bel 2) represents a household has one car, two cars or more. The obtained result shows that a household without any car can be best differentiated from the one with cars, which is concordant
with our intuitive impression. In our real life, a household without any car has many differences with the one with cars according to our feeling. We also established mod-els for any two categories, that is between label 0 and label 1, label 0 and label 2, la-bels 1 and label 2. The classification results of these two categories are 78%, 90% and 79% respectively, which show that a household without any car can be distinguished from the one with two cars better than other two instances. All these results show that the established models are consistent with the real life. If a new sample is assigned ‘the rest’ in the first step, it will then be assigned to either label 1 or label 2 in the second step.
In the prediction of ‘number of cars’ and ‘driver license’, the accuracies of 69% and 83% are obtained respectively by means of a four-fold cross-validation. The missing information in these two variables is imputed by related known information in other variables. The prediction results keep identical with analyzed facts, which show that the established SVM models are feasible to complete information in the FEATHERS model. Of course, how to select some optimized and related variables and how to optimize some parameters of the SVM models will be studied further.
5 Conclusions
The establishment of the FEATHERS model needs large amount of complete data. How to improve the quality and quantity of sample data under existing activity-based diaries will be one of problems to be solved in the FEATHERS. Aiming at this prob-lem, a data imputation method based on SVM is proposed. Two SVM models are es-tablished to predict the missing information of variables called ‘number of cars’ and ‘driving license’ using related other variables. The prediction accuracies of 69% and 83% are obtained respectively by means of a four-fold cross-validation. The initial re-sults show the feasibility of the proposed method. The whole samples can be in-creased 1%-8% after an accurate prediction. The established SVM models can be used to new samples, which provide a good approach to perfect the missing data. The further research is about how to improve the prediction accuracy by a better imputa-tion method.
Acknowledgments. The project is a post-doctoral research grant supported by BELSPO, the Belgium Science Policy and with co-financing from the European commission.
References
1. Moons, E., Wets, G.: Tackling Non-response in Household Travel Surveys: A Case Study. In: Proceeding of the 56th Session of the International Statistics Institute, Lisbon, CD-ROM (2007)
2. Janssens, D., Wets, G., Timmemans, H.J.P.: Modeling Short-term Dynamics in Activity-Travel Patterns: the Feathers Model. In: Proceedings of the 11th World Conference on Transportation Research. WCTRS, Berkeley, California, USA, CD-ROM (2007)
3. Bellemans, T., Kochan, B., Janssens, D., Wets, G.: Implementation Framework and De-velopment Trajectory of FEATHERS Activity-based Simulation Platform. Transportation Research Record: Journal of the Transportation Research Board, No. 2175, Transportation Research Board of the National Academies, Washington, D.C., 111–119 (2010)
4. Cools, M., Moons, E., Bellemans, T., Janssens, D., Wets, G.: Surveying Activity-travel Behavior in Flanders: Assessing the Impact of the Survey Design. In: Proceedings of the BIVEC-GIBET Transport Research Day, Part II, Brussels, pp. 727–741 (2009)
5. Nakamya, J., Moons, E., Koelet, S., Wets, G.: Impact of Data Iintegration on Some Iim-portant Travel Behavior Indicators. Transportation Research Record: Journal of the Trans-portation Research Board, TransTrans-portation Research Board of the National Academies, Washington, D.C, 89–94 (2007)
6. Arentze, T., Hofman, F., Nelly Kalfs, N., Immermans, H.: System for Logical Verification and Inference of Activity (SYLVIA) Diaries. Transportation Research Record 1660, 156– 163 (1999)
7. Vapnik, V.N.: The Nature of Statistical Learning Theory. Springer (1995)
8. Cortes, C., Vapnik, V.: Support-vector Networks. Machine Learning 20, 273–297 (1995) 9. Hearst, M.A., Schölkopf, B., Dumais, S., Osuna, E.: Trends and Controversies - Support
Vector Machines. IEEE Intelligent Systems 13, 18–28 (1998)
10. Sanchez, V.D.: Advanced Support Vector Machines and Kernel Methods. Neuro Compu-ting 55, 5–20 (2003)