Wilfrid Laurier University
Scholars Commons @ Laurier
Theses and Dissertations (Comprehensive)
2014
Quantifying Rooftop Solar Power for the City of
Waterloo, Ontario
Shawn W. MacDonald
[email protected]Follow this and additional works at:
http://scholars.wlu.ca/etd
Part of the
Sustainability Commons
This Thesis is brought to you for free and open access by Scholars Commons @ Laurier. It has been accepted for inclusion in Theses and Dissertations (Comprehensive) by an authorized administrator of Scholars Commons @ Laurier. For more information, please [email protected].
Recommended Citation
MacDonald, Shawn W., "Quantifying Rooftop Solar Power for the City of Waterloo, Ontario" (2014).Theses and Dissertations (Comprehensive).Paper 1650.
Quantifying Rooftop Solar Power for the City of Waterloo, Ontario
By
Shawn W. MacDonald
A thesis
presented to Wilfrid Laurier University in fulfillment of the
thesis requirement for the degree of Master of Environmental Studies
In Geography
Waterloo, Ontario, Canada, 2014 © Shawn W. MacDonald 2014
ii
I hereby declare that I am the sole author of this thesis. This is a true copy of the Thesis, including any required final revisions, as accepted by my examiners. I understand that my thesis may be made electronically available to the public.
iii ABSTRACT
Climate change, pollution, and energy security are driving a worldwide transition away from traditional fossil fuel generated electricity. As the world moves away from fossil fuels and towards renewable energy, electricity generated from photovoltaic solar panels is one of the most promising and capable technologies available today. Arguably the most suitable location to generate this electricity is at the source of consumption. Placing solar panels on unused rooftop space can subsidize the electricity demand that that building requires. This research quantifies the amount of electricity that can be generated within the City of Waterloo, Ontario. Using Natural Resources Canada data, examples from the literature and existing rooftop solar data, a range of possible values were calculated to illustrate the generating potential rooftop solar panels could have for the City of Waterloo. The range in values illustrated the overall potential of electricity generation from rooftop solar power under best to worst case scenarios. An overall value was then calculated based on total available area for five different land use types to illustrate the potential each sector could have for the City. Additionally, a range of values was also applied to the largest and cumulative average rooftop size for each land use type to further examine potential based on each land use type. This research is intended to serve as a possible template for similar studies in different geographic areas of Ontario as well as to influence future policy development surrounding renewable energy generation.
iv
ACKNOWLEDGEMENTS
I would like to thank Dr. M.L Byrne and Dr. Sharpe, my advisers.
To my wife Leslie, you’ve been my support and motivator. Thank you for being there to listen, discuss my ideas and keep me focused.
v
TABLE OF CONTENTS ABSTRACT - iii
LIST OF TABLES - vii LIST OF FIGURES – viii Definition of Terms - ix Chapter 1 Introduction - 1 1.0 Research Objectives - 3 Chapter 2 Background - 5 2.0 Feed-in Tariffs – 7 2.1 Study Area – 9
Chapter 3 Literature Review – 11
3.0 Introduction - 11
3.1 General Research – 12
3.2 Specific Areas of Study - 14
Chapter 4 Methodology – 20
4.0 Introduction – 20
4.1 Data – 20
4.2 Work Flow – 22
4.3 Preprocessing and Examination of Datasets – 23 4.4 Spatial Join – 25
4.5 Building Removal - 27
4.6 Additional Attribute Information – 28 4.7 Error Checking – 31
4.8 Natural Resources Canada Data – 33
4.9 Available Rooftop Space – Half Roof (Pitched Rooftops Only) – 36 4.10 Suitable Rooftop Space – Reduction – 37
4.11 Relationship to electricity usage and utility demand – 40 4.12 Existing FIT/MicroFITs – 42
Chapter 5 Results and Discussion – 46 5.0 Introduction – 46
5.1 Results – 46
5.2 Discussion – 49
vi
6.0 Opportunities for Future Work – 58
Appendix A – 62 Appendix B – 64 References - 65
vii
LIST OF TABLES
2.1 FIT/MicroFIT Price Schedule (Ontario Power Authority) – 9 4.1 List of Data Sources – 20
4.2 Work flow – 22
4.3 PV potential (kWh/kW) – 35
4.4 kWh/year potential overall – 41
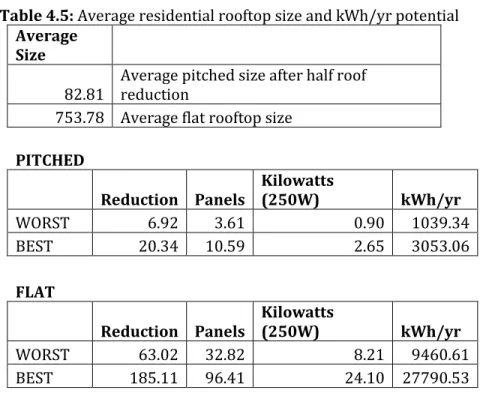
4.5 Average residential rooftop kWh potential – 42 5.1 Factors influencing rooftop solar power results – 53
viii
LIST OF FIGURES
2.1 Study Area – The City of Waterloo - 10
4.1 New Apartment Complex – 25
4.2 Spatial Join Result – 26 4.3 Typical Residential Area – 28
4.4 Pitched and Flat Rooftops in the City of Waterloo – 30
4.5 Uptown Waterloo – 33
4.6 Natural Resources Canada Methodology – 34
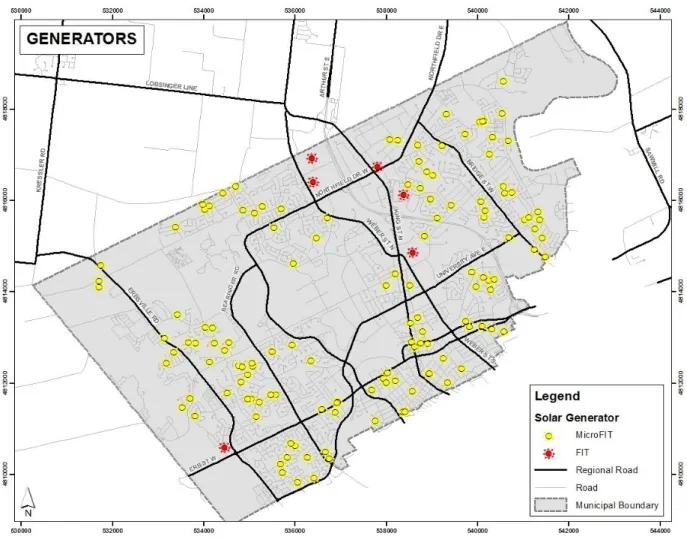
4.7 Waterloo FIT and MicroFIT locations – 44 5.1 Potential Generation: Land Use Type – 48
5.2 Potential Generation: Average Residential Rooftop – 49 5.3 Typical Residential Home with Rooftop Solar – 54
ix
Definition of Terms
The following terms have been defined to provide context and understanding of their use throughout this research paper:
Azimuth – The position of a celestial object along an observer's horizon
Building – Permanent, dwelling or structure that may or may not be occupied
Development – Presently occurring or newly constructed dwelling or structure
Electricity – Type of energy caused by the presence and flow of electric charge
Energy – The capacity for work
Feed-In Tariff (FIT) – An economic policy created to promote active investment in and production of renewable energy sources. Feed-in tariffs typically make use of long-term agreements and pricing tied to costs of production for renewable energy producers.
GeographicInformationSystems – Computer software used to store, view, and analyze geographical information
Institution – An established organization dedicated to education, public service, or culture
Insolation – The act of solar radiation striking the Earth
Kilowatt hour (kWh) – A unit of energy equal to 1000 Watt hours or 3.6 megajoules
Local Distribution Company (LDC) – Distribution company that maintains electrical grid closest to residential and commercial consumers
Megajoule (MJ) – Equal to the amount of 1 million joules or the kinetic energy of a one ton vehicle moving at 160km/h
MicroFIT – policy mechanism designed to accelerate investment into small renewable energy
projects. A MicroFIT project in Ontario is considered any renewable energy project <=10kW in size.
Rooftop – The outer surface of a building’s roof
Rural – Of, or relating to farming or agriculture
Solar Array (Solar Panel) – Collection of solar cells (or photovoltaic modules)
Solar Cell – Semiconductor device that collects sunlight and converts it to electrical energy
SolarEnergy – Energy from the sun that is converted into thermal or electrical energy
1 Chapter 1 Introduction
The installed capacity of solar photovoltaic panels has grown from 1.5 gigawatts (GW) in 2000 to over 70GW in 2013 worldwide with an increase of 74% in 2011 alone (IEA, 2013). Government incentive programs, declining material and installation costs along with a change in political will toward renewable energy have been major influences to this growth. With the introduction of attractive government incentive programs, many home and business owners are now installing photovoltaic panels on building rooftops in urban centers. This has been the case within the City of Waterloo. For homes and small businesses the return on investment and installation costs are primary drivers in the decision to install rooftop solar power. To achieve a reliable aggregate estimation of cost or return on investment however, the quantity of electricity needs to be accurately calculated. In Canada, there is need for a demonstrated methodology for quantifying rooftop solar power. This thesis sets out to develop such a methodology for the City of Waterloo.
The City of Waterloo, located approximately 100km west of Toronto, is a city experiencing rapid growth in population and building development. Waterloo is a diverse city with a variety of mixed land use ranging from high-rise apartments and office towers to sub-urban housing and rural farm land at the city limits. A large portion of the City landscape is dominated by two university campuses along with a large and diverse technology industry. Numerous student residences, high-rise condos, and campus buildings have transformed the urban landscape over the past decade. The growth and expansion of Blackberry (formerly Research in Motion) and other technology
2
companies have also led to the construction of several new office and industrial buildings. As businesses grow and the population of the City increases, so does the demand for electricity. As electricity prices continue to rise, and both the costs and incentives for installing solar power become more attractive, the residents of Waterloo are presented with a unique opportunity. Rooftop solar panel installations take advantage of government incentives while making use of unused rooftop space. This is a practical solution not only to reducing energy costs, but also to producing electricity in a more sustainable way. This application begs the question as to how much electricity can potentially be generated if all suitable buildings within the city had solar panels installed. In this research, this question is explored using GIS, aerial imagery, building footprints and land use information for the City to estimate how much electricity can be generated if all buildings had rooftop solar power generators installed. As various influential factors to this
estimation were examined more closely, a process of refining this data was developed. This process ultimately led to values illustrating the best and worst case scenarios. Under the best case scenario, the maximum suitable rooftop was calculated given the developed methodology. Under the worst case scenario, the resulting value illustrated what was achievable when the most conservative parameters were used to estimate suitable rooftop space. Each scenario was use to calculate the overall potential of electricity generation for the city. Values were broken down by land use to illustrate which land use type had the most potential. The average residential rooftop size was also used to compare potential generation rates to average household consumption. Detailed discussion on the resulting values, calculation methods and the potential of rooftop solar power in the City of Waterloo are then thoroughly covered in the Discussion and Results section of this research.
3 1.0 Research Objectives
The general objective of this research is to produce a range of values representing the possible electricity output that can be achieved in the City of Waterloo if all suitable buildings in the City were outfitted with rooftop photovoltaic solar panels. Due to the variability of seasons,
weather and solar output and the general complexity of this problem, a range in values from best to least favorable conditions are provided based on several factors. These include:
1) Suitable rooftop size to accommodate solar panels 2) Suitable rooftop angle
3) Solar panel angle
4) Solar panel direction in relationship to the sun 5) Seasonal variability in incoming solar radiation
6) Shadow from trees, neighboring buildings and other features 7) Rooftop obstacles and physical barriers to construction 8) Size of solar panel array
Considering the above factors, the aim of this research was to answer the following two questions in regards to rooftop solar power for the City of Waterloo:
1) If all suitable rooftop space within the municipality were outfitted with photovoltaic panels, how much electricity could be generated for the City on an average annual basis?
2) What land use types, roof types and locations within the City are most promising for this technology?
To begin, base line values on solar generation potential need to be calculated using the Natural Resources Canada photovoltaic potential mapping tool. This tool will identify locations
4
considered to be most favorable for rooftop solar power. Five different solar inclination angles are illustrated using this tool and average solar radiation values for each month are shown in kWh/kW of installed capacity. This method considers the entire rooftop area (e.g. suitable space) and is not limited by such factors as rooftop size, physical barriers to construction, shadow or seasonal variation.
The second step in this process will be to refine the aforementioned values to present a more realistic view of what may be achievable in the field. To do this, formulas from the literature on similar topics will be used to develop a methodology of refining the data. The latest academic research on several of the limiting factors mentioned above will be referenced to provide direction and reinforce decisions made in the methodology. The purpose of this refinement will achieve a more realistic view of how much potential electricity can be generated from available rooftop space in the City of Waterloo. For example, concessions based on shadow, suitable array size, and
barriers to physical construction will produce a more conservative and realistic estimate.
Lastly, the results identified in this research will be compared to the characteristics and locations of existing rooftop solar projects within the City. The purpose here will be to understand the relationship between existing and potential sites and to examine any additional characteristics that may determine where or what type of solar installation can be built.
The general principle of this research will provide a range of possible generation potentials for all buildings within the City of Waterloo. Land use and various building sizes within each land use category will be broken down further to highlight potential generation capacity within different sectors across the City. The range of values resulting from the consideration of several limiting factors will ultimately be used to answer how much electricity can be generated from rooftop solar power if all suitable buildings had these generators installed.
5 Chapter 2 Background
Solar panel development and research has progressed considerably over the past several decades. Major advancements to the manufacturing and performance of solar panels in the 1970’s have lead to wide spread use of this technology today. Programs in the U.S., China, Japan and Europe continue to advance this technology further with their research, innovation and
implementation of solar power. Today, these countries boast the highest implementation rates of photovoltaic (PV) systems in the world (University of Central Florida, 2014). More specifically, Germany since 2005 has been the world leader in installed solar power with over 36GW which contributes to roughly 6% of the countries demand for electricity. China is currently a distant second place with 18GW of capacity although with the growth rate at which China is developing solar power, they will likely catch up to and even surpass Germany in the near future (IEA, 2014).
The high density of electricity consumption found in urban environments along with attractive government incentives installing rooftop solar power are shifting the focus of solar power development towards cities and the location of electricity consumption (Gharakhani Siraki, A. and P. Pillay (2012). Incentive programs in many markets around the world continue encourage the construction of smaller scale solar projects. Individual homes and business owners can now purchase and install solar panel technology on their own buildings and expect a reasonable rate of return on their investment.
6
There are many advantages of installing solar panels on individual rooftops over traditional point source power generation stations such as coal, hydro-electric or nuclear. Rooftop solar essentially places a small scale source of electricity generation at the source of electricity
consumption. There are a number of advantages to this setup. The need to construct large scale power stations commonly outside the urban center is greatly reduced or eliminated. In many locations, power generation systems place all or most of the focus on the few dozen sources of electricity production. Hydro-electric stations are limited to sources of fast moving water, nuclear stations need to be next to water sources to cool spent uranium and fossil fuel stations are typically located far from residents because of the emissions they produce. Rooftop solar disperses power generation across the existing grid infrastructure. This dispersion not only reduces or eliminates the need to construct or upgrade existing infrastructure to these large power plants, the many smaller generation stations in a sense reinforce the electrical network by not putting the onus on a handful of power sources (Sovacool, B. K., 2008).
In addition to improvements to the electrical grid reliability and reduced infrastructure costs, there are a number of advantages for the individual home or business owners as well. The province of Ontario offers both companies and individuals a guaranteed incentive for producing electricity and selling it back to the Ontario electrical grid. To cover the relatively high upfront costs of installing rooftop solar panels, the government has offered very attractive rates to entice individuals to invest in this technology (Wiginton, L. K., H. T. Nguyen, et al., 2010). The Feed-In Tariff (FIT) programs offered by the Ontario government since 2009, discussed in the next section, have spurred local job growth, reduced costs to producing and installing solar power, as well have provided attractive income potential to individuals who choose to invest in this technology
(Branker, K. and J. M. Pearce, 2010). Additionally, the FIT programs also have the potential to ease some of the strain on the aging Ontario electrical distribution system by delaying the construction
7
of new lines and generation stations to meet growing demands. By installing smaller wind, solar or hydro-electric projects as they are needed, generation can be added to the system as needed versus building a single large generating station (Sovacool, B. K., 2008).
Finally, with electricity rates predicted to rise dramatically over the next several years, the emphasis on generating electricity through rooftop solar power for environmental purposes may become a moot point. Residents may turn to rooftop solar power installations with or without a government subsidy to either help subsidize their income through the FIT program or simply to reduce their overall net electricity consumption by generating their own electricity on site. Electricity prices are slated to rise 7.9% annually from 2010-2015 (46% total over this period) (Dewees, 2012). Electricity costs and net consumption could be mitigated with the installation of rooftop solar panels on a home or business building.
2.0 Feed-In Tariffs (FIT)
By 2010, over 50 countries offered a renewable energy incentive called a Feed-In Tariff program (FIT) (Renewable Energy Policy Network, 2012). There are many variations of a FIT program with various rates and conditions. The general purpose of these programs is to spur innovation and development of renewable energy projects, reduce costs of installing renewable energy and ultimately move away from traditional fossil fuel energy generation.
Ontario introduced a FIT program under the provincial Green Energy Act of 2009,
effectively establishing incentives for a whole range of renewable energy generation systems. This program is essentially broken into two streams. One stream is the FIT contracts and pricing schedule and approval process is designed for larger scale projects commonly developed by large corporations. The second stream is the microFIT program which operates much in the same way, but is designed for smaller projects often taken on by individuals and small companies. A microFIT
8
project is considered any project that is 10kW in size or less while a FIT project is anything that is greater than 10kW.
One of the primary objectives of the Ontario government was to replace aging coal-fired generation with wind, solar, biogas or biomass. These FIT programs offer individuals and companies a guaranteed fixed price per kilowatt rate for the amount of electricity their project generates and supplies to the Ontario electric grid. Not only do companies and individuals benefit from the rates paid for generating electricity, these projects are helping to fill the need for
electricity demand throughout the province while producing electricity with zero greenhouse gas emissions.
The general model for a FIT program is to start with very attractive rates to attract potential developers. As more solar or wind projects are added to the grid, production and development processes become streamlined, materials become mass produced and ultimately costs to install these projects come down. As the price to install these projects declines, the FIT contract rates for these projects also decline accordingly. Over time, the renewable energy projects that were once not able to compete with the traditionally cheaper and subsidized fossil fuel projects are now on a more level playing field. Ontario has recently reduced the FIT and microFIT contract rates for the province due in part to the falling costs of purchase and installation of solar power.
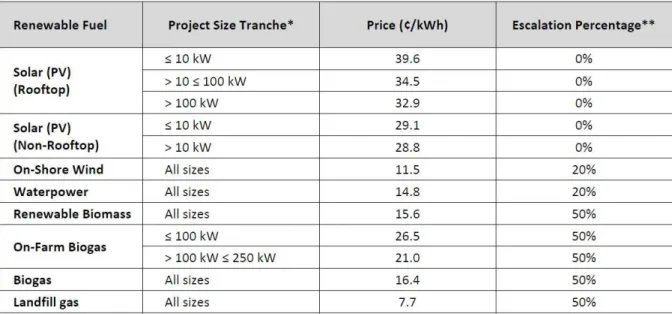
As of July 12th 2012, any new wind, solar, biogas or biomass projects are now subject to a different price paid per kilowatt generated by one of these projects. Table 2.1 below outlines the changes in price for rooftop and ground mounted solar power.
9
Table 2.1: FIT/MicroFIT Price Schedule (Ontario Power Authority):
* The FIT program is available to Small FIT projects; that is, projects generally ≤ 500 kW.
**Escalation Percentage based on the Consumer Price Index will be applied to eligible Renewable Fuels as calculated in the FIT Contract. The Base Date is January 1 of the year in which the Project achieves commercial operation, unless the Project achieves commercial operation in October, November, or December, in which case the Base Date is January 1 of the following year.
http://fit.powerauthority.on.ca/sites/default/files/news/2013-FIT-Price-Schedule-Tables.pdf
The Ontario Energy Board’s Regulated Pricing Plans dictates that the average home or business owner pays between 7.8¢ and 9.1¢ per kWh of electricity consumed depending on the total amount of electricity they have consumed within a month (IESO: Regulated Price Plan, 2013). Comparing these prices to the incentives of the FIT and microFIT rates outlined in the above table clearly shows the benefit to installing a solar, wind or bioenergy project large or small.
2.1 Study area
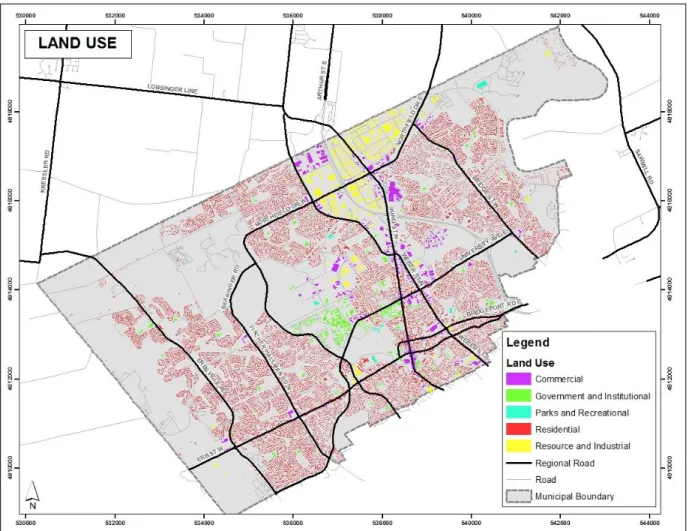
The City of Waterloo was chosen for this research. Waterloo is 64.10 square kilometers in size, has a population of 98,780 (Statistics Canada, 2013) and is located approximately 100km west of the City of Toronto.
10 Figure 2.1: Study Area - The City of Waterloo
The City of Waterloo is home to two major Ontario Universities (University of Waterloo and Wilfrid Laurier University) as well as Conestoga College. The computer science programs and graduating students from these schools have spurred several large technology companies.
Blackberry, Open Text, and Google along with a host of other technology companies have flocked to Kitchener-Waterloo. In doing so, these companies have transformed the City of Waterloo and its surroundings into a major technology hub of North America. This transformation is evident to me every day since Waterloo is where I live, work and attend school. Waterloo’s potential to generate electricity from rooftop solar is fascinating to me because it will impact me directly.
11 Chapter 3 Literature Review
3.0 Introduction
Photovoltaic panels have started to reach a point in the market where they are feasible to install not only on large scale commercial operations but at the individual level as well. By the early 21st century, programs promoting rooftop solar power in Japan and Germany have been a major influence in driving down the price of installing solar panels and adding to this push for rooftop solar in urban areas (Payne et al. 2001). The reductions in costs and increases in both efficiencies and general acceptance for this technology have led to several research objectives to study the feasibility of this technology further. Japans’ “Sunshine Project” (starting in 1974) and more recently “New Sunshine Project” (1993) set major targets for achieving utility connected rooftop mounted PV systems. Capacity targets of 4.6GW by 2010 (now achieved) were made possible because of the research, development and investments that these programs brought forth (Tatsuta, 1996). Similarly, Germany as part of a 2009 European Union directive has set out to meet 20% of its energy needs through renewable energy by 2020. Solar power installations have increased more than 20 times over the past 15 years. Over this same period, German research publications solely on the study of solar power have accounted for over 80% of all renewable energy
publications (Sanz-Casado, 2014). Globally, recent research has now also moved beyond questions of whether solar power is the right choice for generating electricity to rather the logistics, obstacles and cost feasibility analysis of this technology both on the large and small scale. Many specific aspects of solar power have been studied by various authors around the world. These areas include very specific topics from optimal tilt angle, solar panel efficiency, and barriers to optimal operation
12
to general studies on site suitability, cost analysis and feasibility of large scale implementation. Understandably, the locations for much of this research is typically found in sunny countries such as Spain, Italy, Turkey, and the Middle East where installing solar power (thermal and photovoltaic) seem logical, given the high number of peak sun hours for these locations. Relatively few studies make any attempt to quantify power generation potential for a specific region and of those studies the study area is often either very large (entire countries) or very small (neighborhood within a city). This lack of research for not only mid-latitude locations and city sized study areas highlight the need for the current study. The following will examine the locations and specific areas of research for solar power and more specifically, rooftop solar power and will highlight how the current study can build on this information and add to a growing body of knowledge on this subject.
3.1 General Research
Research on rooftop solar power ranges from the general feasibility of installing rooftop solar panels, to the complex and influential factors of installing rooftop solar power. This range from general to specific has grown considerably over the past decade as solar power technology has become more ubiquitous in society. General themes such as evaluating, quantifying or selecting suitable locations for rooftop solar power have been studied by Bergamasco and Asinari 2011; Izquierdo et al. 2011; Izquierdo et al. 2008; La Gennusa et al. 2011; Vardimon 2011 and Wiginton et al. 2010. These authors do an excellent job of addressing these bigger questions in their research and their findings are worth closer examination.
Vardimon, (2011) found enormous potential for generating electricity in Israel by placing solar panels on all suitable rooftops across the country. Although residential dwellings were found to have, on average, a smaller rooftop size in comparison to other building types, these buildings were the most numerous and therefore held the greatest potential for generating electricity.
13
Additionally, larger buildings such as warehouses were found to have significant potential for generating electricity despite the relatively small number of these larger buildings found across the country. Overall, Vardimon’s (2011) research concluded that even after taking into consideration the variability of solar energy captured across many different regions and many different building types across the country, 10-15% of Israel’s electricity demand could be met by rooftop solar power installations. Perhaps most significantly, estimates made using only large building rooftops with lower efficiency photovoltaic panels suggest that up to 7% of Israel’s electricity demand can be met from these buildings alone.
Izquierdo et al. (2008) and later Izquierdo et al. (2011) examined the technical potential of rooftop photovoltaic panels for generating electricity across the entire country of Spain. Izquierdo et al. (2008) developed a novel method for estimating suitable rooftop area for a region the size of an entire country. The most challenging aspect of this research was the ability to find good and reliable data for building types and sizes across all regions of the country. By using a scalable methodology, Izquierdo et al. (2008) were able to focus on smaller regions of Spain and then use various statistical and vector based datasets to apply results to the entire country. With a confidence level of 95%, the average suitable rooftop for solar panel placement was found to be 14.0±4.5m2. As a continuation of this research Izquierdo et al. (2011) examined solar rooftop potential for not only generating electricity but supplying the surrounding municipality with hot water. They concluded that with roughly 17% of the available rooftop area, 70% of municipal hot water could be generated through the placement of thermal hot water systems on the rooftops of all suitable buildings across the country. Further, by fitting the remaining 83% rooftop area with photovoltaic panels 4% of the overall electricity demand for the entire country was able to be met.
La Gennusa et al. (2011) focused on just the adoption of solar power (both thermal and photovoltaic) within the urban area. This study calculated how much of an urban rooftop surface
14
could be used for solar power technology. Focusing on the city of Palermo, Italy, buildings were divided up into photovoltaic collector and solar thermal categories based on building and territorial characteristics that were identified throughout the city. Not only were dense urban territories within the city found to be the most promising for solar power, these locations also proved to be the most economically feasible based on current renewable energy incentives offered in the region.
Wiginton et al (2010) quantified potential power generation for an area in eastern Ontario. This study used image recognition software to extract and extrapolate building footprints from imagery for both urban and non-urban locations in and around three complex urban areas (Peterborough, Ottawa and Kingston, Ontario). This research found that if appropriate building rooftops were fitted with commercial photovoltaic panels, their study area could potentially meet 5% of Ontario’s peak electricity demand. Further, Wiginton et al (2010) suggest that up to 30% of Ontario’s electricity demand could be met using rooftop solar technology. Wiginton et al. (2010) is one of only a handful of studies that have examined Ontario, Canada in the context of solar power. Not only are there few studies for this geographic area, but Wiginton et al. (2010) is the only study with the similar goal of quantifying rooftop solar power for an urban area within Ontario.
3.2 Specific Areas of Study
The many variables that comprise quantifying rooftop solar power generation make it a very complex issue to research. Specific topics such as shadow from tree and building cover, calculating suitable rooftop space, and analysis of optimal solar panel tilt angles have been well researched. Research by Jafarkazemi and Saadabadi, 2013; Gharakhani Siraki and Pillay, 2012; Nguyen and Pearce, 2012; Rowlands et al., 2011; Hofierka and Zlocha, 2012; Bergamasco and Asinari, 2011; and Tooke et al., 2011 often use tools such as 3D modeling, LiDAR, remote sensing, and Geographic Information Systems (GIS) either separately or collectively to answer such research
15
questions on these topics. Some more notable research on these specific topics and their findings are explained further below.
Jafarkazemi and Saadabadi (2013), Gharakhani Siraki and Pillay (2012) and Rowlands et al. (2011) examined optimal tilt angle at which to position solar panels (ground or roof mounted). Studying optimum tilt angle for the city of Abu Dhabi, UAE and using empirical methods,
Jafarkazemi and Saadabadi (2013) concluded that positioning solar panels at a 22° yearly angle would harness the greatest amount of solar radiation. Additionally, they found that by adjusting the panel angle twice per year to account for changes in the sun’s position in the sky would produce even better results. Finally, their research found that overall there was a close correlation between the latitudinal angle of their study area (24.4° N) and the optimum yearly tilt angle for a solar project.
Similarly to Jafarkazemi and Saadabadi (2013), Gharakhani Siraki and Pillay (2012) examined optimum tilt angle but specifically within the context of an urban environment. They found that although optimum tilt angle is closely tied to latitude of the project study area, this correlation is less so for locations at higher latitudes. Studying optimum tilt angle within an urban environment proved to skew this correlation even further. Solar panels in an urban area contend with shadow from trees or buildings, rooftop obstacles, smog, reflectance from the ground and neighboring objects such as buildings and are subject to weather patterns dissimilar to rural locations outside the city. To accommodate for these unique factors, Gharakhani Siraki and Pillay (2012) found optimum tilt angle overall for urban area should be at a slightly flatter angle to accommodate for surrounding obstacles such as buildings. Initially a 37.7° optimal tilt angle was chosen using their equations, however, when factoring in surrounding buildings this angle was lowered to 33.1°.
16
Rowlands et al. (2011) examined optimum tilt angle for solar projects in two of the largest cities in Ontario (Ottawa and Toronto). This study aimed to determine at what tilt angle maximum revenue could be achieved. Using electricity market prices from 2003 to 2008 and meteorological data for each study area, the tilt angle and azimuth was calculated for Ottawa and Toronto. In both cases, the optimum tilt angle was found to be less than the latitude for each area. Depending on price regime used, optimum tilt angle for Ottawa was between 36° and 38° (latitude 45°) and Toronto 32° and 35° (latitude 44°). The optimal azimuth position also deviated slightly for each location depending on which price regime was used, but it generally remained within a few degrees of due south.
Remote sensing software, LiDAR and different GIS software have been used in studying various aspects of urban rooftop solar power. To quantify potential power of an urban area, studying shade loss from nearby trees or simply to identify suitable rooftop space, many authors (Bergamasco, and Asinari, 2011; Hofierka and Zlocha, 2012; Tooke et al., 2011; and Nguyen and Pearce, 2012) have used unique algorithms and software applications to study one or more aspects of rooftop solar power.
Bergamasco, and Asinari, (2011) developed an algorithm that accounts for shadow, rooftop barriers to construction, azimuth angle, and rooftop typology (through the analysis of brightness). Using GIS and remotely sensed imagery, this algorithm was applied to the city of Turin, Italy and compared against a previous study performed by the same authors. In this application they found their older results to be much more conservative with their latest study showing up to 41% higher rooftop photovoltaic potential with a confidence interval of 90% based on site inspections.
17
Also employing software and unique algorithms to address the technical aspects of rooftop solar power, Hofierka, and Zlocha, (2012) developed a 3-D solar radiation model for an urban area to present a clearer picture of rooftop solar power within an urban environment. Specifically examining possible temporal and spatial fluxes of solar radiation related to neighboring buildings and trees, this research used the v.sun module (developed by Hofierka and Zlocha) and the GIS software GRASS to study 3-D buildings using an existing solar radiation methodology from the r.sun
model that was already present in the GRASS software itself. By applying these algorithms to a small subset of buildings, their study found that strong spatial and temporal variations in radiation flows are present across an urban area. The implications of this research could therefore lead to better locations for solar panels through an urban area and even more efficient heating design for buildings.
Solar arrays located in large open spaces such as a farm field do not have to contend with shadow from nearby objects such as trees. Many neighborhoods within an urban center can be limited by trees, buildings and other objects casting a shadow at some point during the day. Tooke et al. (2011) used LiDAR remote sensing technology to examine the seasonal effects that shadow from trees can have on the effectiveness of rooftop solar power. After studying a subset of
buildings and vegetation in the City of North Vancouver, they determined that vegetation played a significant role in amount of radiation received at the rooftop level of a building. For residential buildings they found roughly a 38% reduction in incoming solar radiation to rooftop solar arrays and a strong correlation between tree structure and the amount of radiation intercepted. By avoiding areas influenced by vegetation cover, rooftop space and solar panel arrays can be used more efficiently to generate the maximum amount of electricity for the space available.
Aerial imagery and remote sensing has played a significant role in various studies on rooftop solar power. Nguyen and Pearce (2012) used LiDAR, GIS and uniquely developed
18
algorithms to study 100 buildings in the downtown area of Kingston, Ontario, Canada. Using the
r.sun solar irradiation model in the GIS software GRASS, their aim was to identify which buildings were most suitable for PV installation based on factors such as shadow and annual daily solar insolation. Through this process an algorithm was developed that attempted to take into account shadowing, global irradiation components at the municipal level while remaining flexible and easy to upgrade if necessary. The resulting raster display from running this process within the software clearly identified building surfaces ranging from best to worst suitability based on their defined criteria.
Academic literature on rooftop solar power or solar power in general has progressed over the past decade from studies by Alsema and Nieuwlaar, 2000; Payne et al., 2001; Rylatt et al., 2001; Gadsden et al., 2003; and Gong and Kulkarni, 2005, which asked general questions on solar power technology itself, to more sophisticated and focused research on single aspects of this technology. Questions over whether solar power and rooftop solar power is the right choice as an economically and technologically feasible alternative have given way to research centered on answering where and how this technology can be utilized most efficiently. The research on this subject has employed several novel techniques and technologies with the aim of answering one or two specific aspects about solar power that may contribute to the overall success of a project. However, there are still several areas worth further exploration. (1) Research on this topic covers both very large and very small study areas for various topics with study areas the size of a city left relatively overlooked. (2) Very few studies have combined the findings of this research to answer the questions of how much solar power can be generated in a particular location. More research is needed on quantifying overall generation potential rather than simply examining one isolated factor (e.g. only shadow from trees) that perhaps influences the overall amount of potential electricity generation. (3) Research tends to focus on warmer locations such as Italy or Spain for rooftop solar power leaving
19
relatively few areas within Ontario or even Canada examined. (4) Finally, quantifying rooftop solar power can be highly influenced by a number of factors. Many research topics tend to isolate one factor and provide a specific result based on the conditions they have set forth under their
methodology. Providing a range of possible values based on different conditions or factors seems to be more appropriate for this topic to better understand the possibilities that exist when
attempting to provide an accurate estimation of potential. This research will attempt to fill the needs mentioned above and determine a range of potential power that can be generated from rooftop solar power at the municipal level for the City of Waterloo, Ontario.
In the next section, the methods used for data collection, processing and calculation of range values mentioned above are discussed. The needs for further research, as mentioned above, (points 1-4) are also further addressed.
20 Chapter 4 Methodology
4.0 Introduction
This chapter describes the research process undertaken for this study. It first outlines the overall sequence of steps or workflow involved in the analysis. It then discusses in detail the techniques of data collection, processing and error checking along with the calculation of optimal tilt angle and the formulation of appropriate estimates of rooftop area reduction. The final
potential electricity generation range from rooftop solar power is also compared to the locations of existing rooftop solar projects for discussion.
4.1 Data
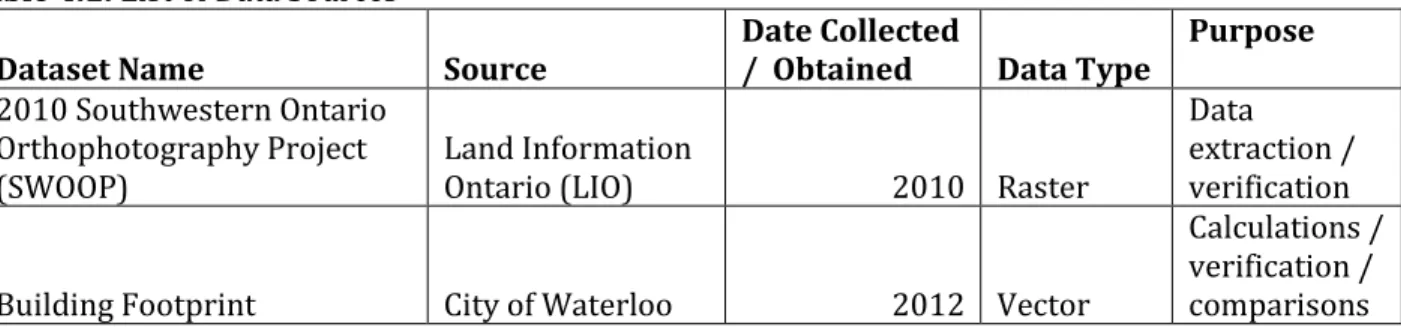
Many of the datasets used in this research were created from municipal, provincial and federal data sources but were obtained through the Wilfrid Laurier University Map Library data warehouse. Table 4.1 outlines the dataset, source, date collected or provided.
Table 4.1: List of Data Sources
Dataset Name Source Date Collected / Obtained Data Type Purpose
2010 Southwestern Ontario Orthophotography Project (SWOOP)
Land Information
Ontario (LIO) 2010 Raster
Data
extraction / verification
Building Footprint City of Waterloo 2012 Vector
Calculations / verification / comparisons
21
Land Use DMTI Spatial 2011 Vector
Calculations / verification / comparisons
Roads DMTI Spatial 2011 Vector Reference
Municipal Boundary DMTI Spatial 2011 Vector Reference
Parcel Fabric
Region of
Waterloo 2009 Vector
Reference / verification
Rivers City of Waterloo 2012 Vector Reference
Water Bodies City of Waterloo 2012 Vector Reference
Forest City of Waterloo 2012 Vector Reference
Zoning City of Waterloo 2012 Vector
Reference / verification Photovoltaic Estimates Natural Resources Canada 2006 Tabular Calculations / comparisons Existing Solar FIT/microFIT
Data
Waterloo North
Hydro 2013 Vector
Calculations / comparisons Energy Use Trends and
Statistics Waterloo North Hydro 2012 Table Calculations / verification / comparisons
The land use and building footprint data were both equally the most important pieces of information to perform this study. The accuracy of these data directly influenced the outcome of the study. Current building footprint polygons and land use data were needed to correctly calculate the available rooftop area. Misclassification of the resulting data would occur if the age of these two datasets differed by more than a few years. This would lead to some building footprint polygons being misclassified as an incorrect land use type and ultimately skew the analysis of the results late on. Both the land use and building footprint polygon layers had some data inaccuracy. As realized during the quality control portion of the methodology, some issues with the data needed to be addressed. These issues included incorrect land use categorization in some areas and missing or incorrectly drawn building footprint polygons. These issues and how they were corrected are discussed further in section 4.7 Error Checking.
The values obtained through the Natural Resources Solar Mapping tool, although somewhat older by comparison, served as an appropriate base line to compare all subsequent findings. Air
22
photo imagery collected under the Southwestern Ontario Orthophotography Project (SWOOP) allowed for validation of other datasets and helped to clean up any inaccuracies that appeared in the Land Use and Building Footprint layers. Existing FIT and MicroFIT locations were perhaps the most useful as they were 100% accurate, and the most current information available. This was important for comparing the potential results to actual existing locations. These existing values could then be used to validate results by examining the spatial relationships between both existing and potential data.
4.2 Work Flow
Using previous research as a guide, a research process was developed to quantify potential power generation and achieve a range of values. Table 4.2 outlines the steps that were taken to process the data and analyze the results:
Table 4.2: Work flow 1. Data Processing
2. Spatial Join (Building Footprint and Land Use) 3. Removal of Smallest Structures
4. Addition of missing or inaccurate building polygons and attributes
5. Error Checking and QA/QC
6. Base Values – Natural Resources Canada Tool 7. Half Roof Calculation (Pitched Rooftops Only) 8. Reduction Formula for Pitched and Flat Rooftops
9. Suitable Rooftop Area Calculations – Best and Worst Case Scenarios 10.Relationship to electricity usage and utility demand
23 4.3 Preprocessing and Examination of Datasets
In step 1 of Table 4.2, several datasets were compiled and examined from various private, municipal and regional sources before any data processing or analysis took place. Air photo imagery was taken of the City in 2010 at a resolution of 30cm. Each of the 98 air photo tiles were examined for completeness and to get a sense of how current the imagery was compared to known construction projects throughout the City. Several known construction areas throughout the City were examined in addition to a visual assessment of every air photo tile. Building footprint polygons created in 2012 were also obtained through the City of Waterloo and used to determine the various developments or changes to the land use (e.g. several condos have replaced smaller two storey homes in recent years, as shown by Figure 4.2). The land use layer, created in 2011 and obtained from DMTI Spatial enabled the analysis of building footprint data by several groups. Results could then be quantified based on land use type which allowed for better analysis on which land use had the greatest potential for the development of rooftop solar power. There were 7 different types of land use found throughout the City. These categories included:
Commercial
Government and Institutional
Open Area
Parks and Recreational
Residential
Resource and Industrial
Water body
“Open Area” and “Water body” were removed from the dataset because no buildings or structures were located on these particular land use types. All three datasets (air photo, building
24
footprint and land use) were used in conjunction to illustrate the accuracy and currency of the data as a whole which ultimately influenced the final building footprint layer used for quantifying rooftop solar power potential. As mentioned above, there were some data inaccuracies that accompanied the land use and building footprint polygon layers which required some quality control measures to increase their value. Air photo interpretation, field checks and local knowledge played a significant role in resolving some of these inaccuracies.
These layers, plus additional base data from DMTI Spatial, the Region of Waterloo and the City of Waterloo, were compiled in a base map before any processing took place. The purpose of this was to examine the quality of data and to identify any problem areas that would require further investigation. Layers such as zoning, roads, water, and forest were explored for their attribute information and spatial coverage. Although these layers were not useful to the main purposes of this research they provided some basic understanding and context of the City. Finally, since the aerial imagery, land use, and building footprint layers were all created at different times, it was especially important to examine any spatial differences or changes to attribute information between each of these layers that could potentially cause confusion or pose problems during analysis later on. These differences between datasets, although noticeable between layers, did not pose a significant impact on the overall results as will be discussed in the Results section in greater detail.
25
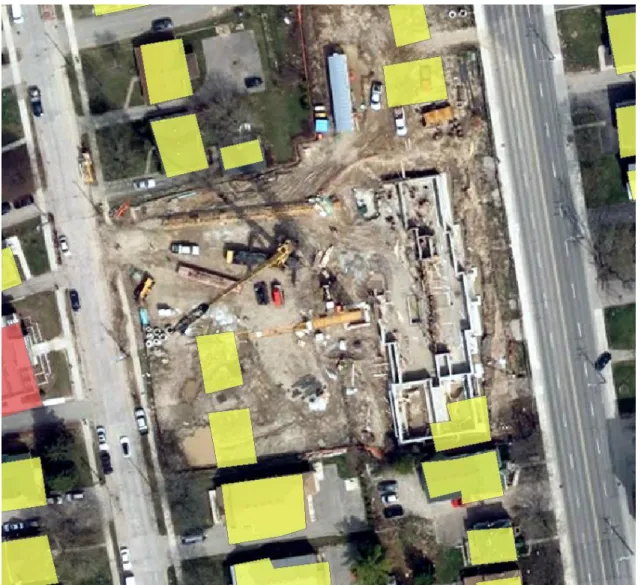
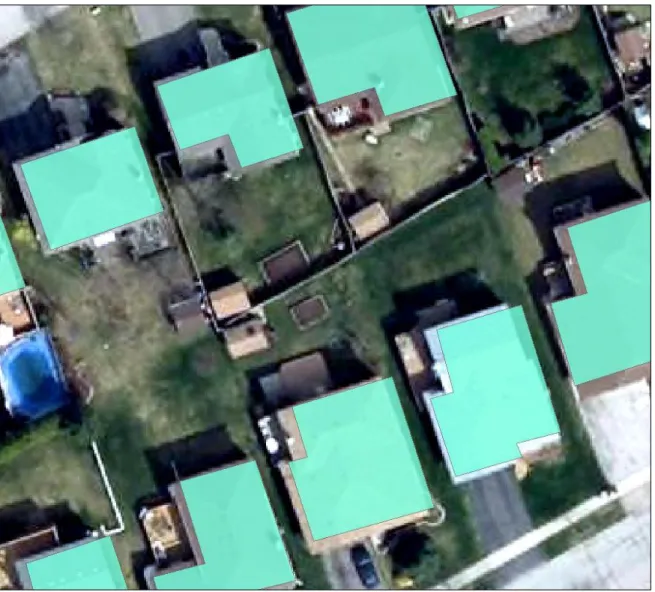
Figure 4.1: Aerial imagery showing newly developed apartment complex while polygons show houses once present at that location.
4.4 Spatial Join
Once the initial data were organized and examined for usefulness, step 2 was to combine the attribute information from the land use layer with the spatial information from the building footprint layer. To achieve this, a spatial join was performed between the two datasets. The purpose of performing this join was to combine the spatially significant building footprint polygon information with the land use polygon layer, to provide these buildings with a spatial context that could then be analyzed and quantified by each land use category later on. In Figure 4.2, the result of
26
combining this data is shown. The land use layer possessed 1,934 records and was a province wide dataset while the building footprint layer held over 33,796 records and was made up of only buildings found within the City of Waterloo. Once this join was performed, several polygons in the building footprint layer did not have complete attribute information. To correct this problem, proper land use types of a few thousand polygons were identified and classified manually.
Additionally, several building footprint polygons were far too small in size to be suitable for rooftop solar panels. These unsuitably small polygons were identified and removed as explained in greater detail in the next section.
Figure 4.2: Result of spatial join showing added Land Use information within the Building Footprint shapefile.
27
4.5 Building Removal
The result of combining the building footprint and land use layers revealed that numerous small polygons sheds, garages and storage units were captured in the dataset. These structures were too small to hold more than one or two solar panels and thus removed from the dataset in step 3 of the work flow. To remove these buildings, a set size restriction was applied to filter out all polygons of a certain size or smaller. After examining several buildings the size of a shed or small garage, a value of 20 square meters was determined to be a suitable cut off for removing these smaller structures. An average sized solar panel is roughly 2 square meters and produces around 250 watts per panel (Canadian Solar, 2014). According to the existing rooftop solar data, the average sized installation in the City is roughly 6.6kW. If 10 of these 250Watt solar panels were installed in a 20 square meter space, the size of that installation would be roughly 5kW. With the average existing rooftop solar project being 10.18kW in size, and the size of a project being directly related to the amount of electricity and government incentive, larger projects are favoured under the current FIT/MicroFIT system. Another consideration would include the potential labour and material costs of installing a small number of panels on a separate roof system. Using this logic, any structure that was less than 20 square meters would not be suitable for rooftop solar panels. Figure 4.3 shows the product of this building removal for a typical residential neighbourhood. Polygons for small sheds have been removed leaving only larger buildings (blue colour) for the study. The smallest structures used for this research would be that of a large garage or shed. In addition to the size restrictions placed on the dataset, some larger and complex rooftop types were later removed due to their shape and size. Structures such as sports domes, tents and other semi-permanent structures such as school portables were also removed.
28
Figure 4.3: Typical residential area where small structures such as sheds or garages have been removed from dataset
4.6 Additional Attribute Information
In step 4, additional information was added to the attribute tables of the data. Using air photo imagery, building rooftop types (either sloped or pitched) were add as attributes to the data. This enabled building types to be classified not only by land use type but now also by rooftop type as well. Having these categories was essential because potential power and available rooftop space of flat rooftops differs from that of buildings with pitched rooftops. After examining the air photo imagery, there appeared to be a connection between rooftop types and the type of land use they
29
belonged to. For instance, the majority of suburban residential homes almost always had pitched rooftops while commercial, industrial and institutional buildings, typically had flat rooftops. Beginning with the residential land use type (the largest category), air photo imagery was used to identify buildings with pitched rooftops. Major roadways were used as a guide to
compartmentalize larger areas of the city. Quite often a residential neighbourhood or business district bound by major roadways consisted almost entirely of one rooftop type or another. Air photo imagery clearly showed certain buildings with either flat or pitched rooftops. In some cases, buildings that were difficult to classify as either pitched or flat, were done based on the
characteristics of a similar looking building within the same location. That is, if 98 buildings in an area were clearly pitched rooftops and the two unknown buildings looked similar to the other 98, then those two would be considered pitched rooftops as well. For many residential neighborhoods this was easily done since subdivisions tended to be homogeneous in nature and could be quickly identified using the high resolution air photo images. In other cases where building types tended to be more mixed land use, closer examination was required. This was especially apparent in the uptown Waterloo area and the neighborhoods surrounding both universities. To properly classify these building rooftops as either pitched or flat, areas were broken up into smaller more
manageable zones. Larger buildings, simply due to their size, almost always had a flat rooftop type. Some small exceptions to this were churches with their large steeples and complex building
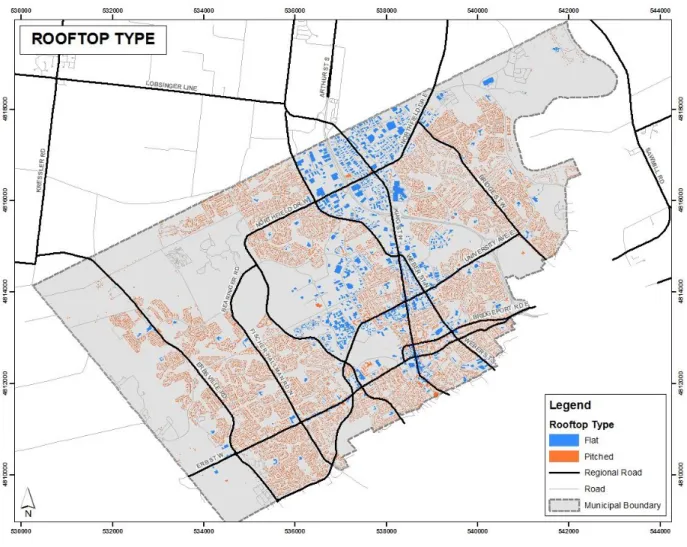
characteristics. In addition to residential neighborhoods having easily identifiable characteristics, industrial and commercial zones located in the north and central west part of the City were also visibly homogenous. Figure 4.4 illustrates the overall composition of flat and pitched rooftop buildings for the entire city.
30
Figure 4.4: Pitched and Flat rooftops in the City of Waterloo
Although many locations across the City were easily identified due to their like properties, there was the potential for buildings to be misclassified in some locations. An example of this would be a large residential neighborhood composed predominantly of small pitched roof
buildings. These neighbourhoods often included small pockets of flat rooftop commercial buildings (e.g. corner stores or strip plazas). Each air photo individually was examined to locate these
outliers; however it was possible that some were missed in this check. The process of properly classifying each building as either having a flat or pitched rooftop was extremely time consuming but at the same time crucial to the accuracy of the dataset overall.
31
4.7 Error Checking
Several errors in the data became apparent when adding attribute information to the dataset. Some building footprint polygons and their land use categories were misclassified for several areas across the City. These areas seemed to be primarily located in newly developed sections of the City (e.g. old industrial land that have been rezoned for residential condominiums). The residential land use category was impacted by this the most. To ensure data accuracy, the entire dataset was carefully inspected in step 5 of this work flow process. Examination of the entire dataset was very time consuming but necessary to ensure proper data integrity. To make this task more manageable, the dataset was examined against each of the ninety-eight 1km by 1km air photo tiles. All buildings were inspected by colour coding each category as Flat or Pitched rooftop type and then by land use type while using each air photo tile as a reference. In many cases, the errors in the data were easily identifiable. Resource and Industrial classed buildings often appeared in a residential neighborhood, for example. In several areas, a huge subdivision was classified as residential land use while a small pocket of that subdivision was misclassified as a different land use type along the boundary of this larger area. This is likely the result of residential development expanding into areas once classified as farmland or brownfield development.
Other attribute data errors were noticed while examining each air photo tile and building footprint polygon layer. Some specialized buildings and other structures were identified using the air photo imagery. These structures were considered not suitable for rooftop solar panels because they were either (1) too small and not worth the financial investment to install only one or two panels; (2) the roof was too complex with many small pitched surface areas that would make it conducive to installing a contiguous array of panels; or (3) the roof was too steep for solar panels to be installed (e.g. churches). In other rare cases such as sports domes or recreational centers, the
32
unique architecture of these buildings with their soft or curved rooftops meant that installing panels on these structures would not be possible due to lack of adequate structural support.
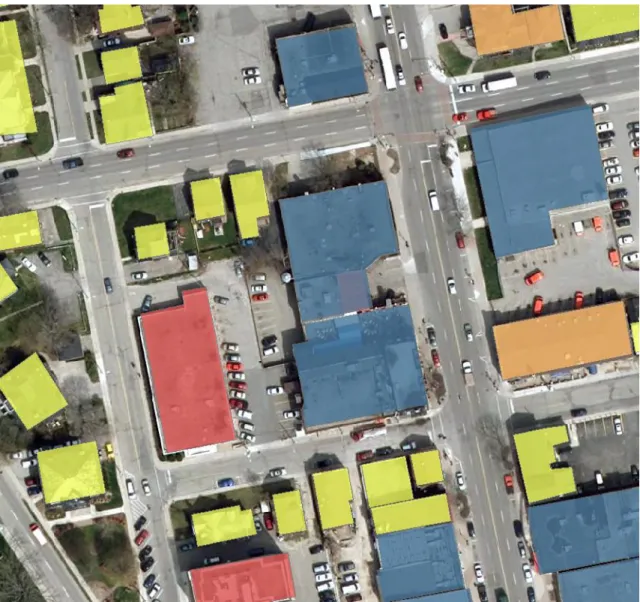
The proper classification of some rooftop types (Flat or Pitched) led to some noticeable errors in the data during this error checking process. In one or two cases, missing buildings that were not originally drawn in the building footprint layer from the City were added to the data. Additionally, any changes to land use classification of existing building footprint polygons was based on several sources of information. In many cases, the incorrect data were obvious through visual examination of the air photo. Incorrect buildings were easily identified based on examining adjacent buildings and their size, shape or classification. Field checks and Google Street View were used to determine some buildings with missing or incorrect attribute information. Knowing where new commercial and residential projects have been taking place throughout the City also helped identify some of these problem areas. Some specific locations within the downtown core (Figure 4.5) and along University Avenue and King Street where several residential and commercial developments have been constructed in recent years were noted. In rare cases where the land use type of a building was not apparent, it was assumed that the land use type of a building within that same area was the correct land use type. This was the case in the Davenport and Northfield area where there are large sections of Resource and Industrial classed buildings. By zooming into each air photo tile at a scale of roughly 1:2000 metres, a clear level of detail could be achieved while still making the data manageable for error checking and other analysis.
33
Figure 4.5: Uptown Waterloo where several buildings needed to be added manually along with their attribute information (rooftop type and land use)
4.8 Natural Resources Canada Data
In step 6, the Photovoltaic Potential and Solar Resource Map presented by Natural
Resources Canada was used to provide a general sense of how much solar energy was possible for the City of Waterloo. This tool produces both maps and value tables showing the number of kilowatt hours (kWh) that can be produced per kW of solar power installed for any location across Canada. The dataset for this tool is based on Environment Canada monthly mean daily global insolation records taken from 144 meteorological stations across the country between 1974 and
34
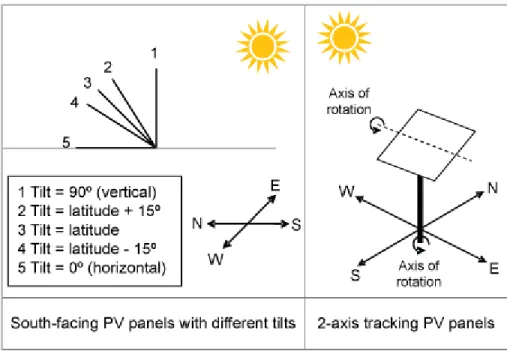
1993. Values falling between meteorological recording stations have been determined using a spline interpolation method. Over 3500 municipalities can be searched through this tool and the values can be presented to show this information for each month of the year as well as the annual average for each category. Five possible solar panel angles are shown for each month. These angles are shown in Figure 4.6 below:
Figure 4.6: Methodology Diagram (Natural Resources Canada: http://pv.nrcan.gc.ca/index.php) One additional value that is presented in this dataset is 2-axis tracking. This value is
included on solar panels that are designed to track the sun as it moves across the sky from morning till night and also through the seasons as it rises higher and lower in the southern sky. This type of solar panel that has the ability to track the sun is more suited for ground mounted systems and is more commonly found in rural solar generation installations. These values were not considered in the overall results due to the unlikelihood of them being used in an urban area.
This interactive map was developed by the Canadian Forest Service (Great Lakes Forestry Centre) in collaboration with CanmetENERGY Photovoltaic systems group. The solar insolation
35
dataset was provided by the Data Analysis and Archive Division, Meteorological Service of Canada, Environment Canada. The data shown by this tool are presented on 300 arc seconds (0.8 degrees) 10km grid for any given location across Canada. To account for overall system losses due to climatic factors, inverter operation and operational losses, a performance ratio of 0.75 was used on all values produced under each of the aforementioned 5 solar panel angles. This ratio indicates that values presented in this table have already been reduced by 0.25% to account for the factors
mentioned above.
Using this tool, the values for the City of Waterloo are presented below in two tables. In Table 4.3 the amount of kWh per kW of solar power capacity installed (PV Potential) is given for every month. Four columns are also presented which show what values are possible based on the angle the solar panel is tilted. The PV potential did not include the Horizontal (tilt=0°) angle: Waterloo, Ontario
Geographic location -> -80.51E,43.47N Table 4.3: PV potential (kWh/kW) South-facing vertical (tilt=90°) South-facing, tilt=latitude South-facing, tilt=latitude+15° South-facing, tilt=latitude-15° January 61 61 64 54 February 74 79 82 73 March 83 105 103 102 April 71 114 105 118 May 62 120 105 130 June 57 121 104 134 July 60 125 108 137 August 66 118 106 125 September 70 102 97 102 October 74 90 90 85 November 51 54 57 50 December 50 49 52 44 Annual 780 1139 1073 1153
Looking at the annual values of each calculated angle, the best angle to place solar panels appears to be at an angle of slightly less than ”Latitude” minus 15° or 30°. Since values of this chart appear higher for angled panels, it would suggest that the ability to capture the solar energy is
36
greater for panels angled at or near latitude versus ones that were completely flat or angled
vertically. When considering flat versus pitched rooftops, it can be argued that the angle at which a solar panel is position likely has greater meaning to flat rooftops only. In the case of pitched rooftop installations, the existing rooftop angle is more likely to be the primary driver behind the angle at which the panels are placed. Cost of installing additional material for the purpose of changing this angle to achieve a slightly better reception of solar radiation is also likely a primary factor. According to Jafarkazemi and Saadabadi (2013), Gharakhani and Pillay (2012) and Rowlands et al. (2011) a correlation exists between optimal tilt angle of solar panels and the latitude of where the project is located. Generally speaking, solar panels perform best at an angle similar to or slightly less than the latitude for which the project is located. Since the highest values in the Natural Resources Canada Solar Resource Tool were at an angle of 30°, annual value
1153kWh/kW was used in the calculations found in step 10. These values presented by Natural Resources Canada should also be considered best case scenario since they fail to account for several factors such as rooftop orientation, shadow from trees or rooftop barriers to construction.
These values will be applied to the total area for all buildings in the city. To account for several unknown variables, these values will be refined to present a more realistic view of what might be achievable under real world conditions. The resulting values from this refinement will then be applied to additional formula to provide context in relation to average consumption rates and electrical demand for the Waterloo area overall. The next section will attempt to refine pitched rooftops space only to present a more realistic view of a typical rooftop system.
4.9 Available Rooftop Space – Half Roof (Pitched Rooftops Only)
Solar panels on pitched rooftops are typically located on just the south or southwest side of the building. This is due to the sun’s path which tracks along the southern horizon at an angle dependent on position of latitude and the time of season (lower in winter/higher summer).
37
Positioning solar panels to face southward would take advantage of the best possible sun exposure available.
Because solar panels are often placed on only one half of a pitched rooftop, the result obtained through the Natural Resources Canada Solar Map Resource Tool alone requires slight modification. Although the values obtained through the Solar Resource Tool have a general built in performance ratio of 0.75, further concessions are needed to calculate a more precise portion of the rooftop that will likely receive sunlight. In step 7 only pitched rooftop values were divided in half to account for the more realistic practice described above. All values obtained for flat rooftops were simply left unchanged. Flat rooftops were assumed not to require a reduction of surface at this point since they do not contend with a south, north, east, or west sloping rooftop that would limit optimal solar panel placement. Solar panels placed on a flat rooftop were then assumed to utilize the entire available roof. This calculation is intended to be a generalization of the typical pitched rooftop buildings that may be found within the City of Waterloo. This half rooftop calculation also assumes all pitched rooftop buildings within the City have suitable southern or western roof exposure that is unobstructed by trees, buildings and other objects. To account for these issues, further concessions will be made to these calculations in the next section to obtain an even more accurate representation of a typical building.
4.10 Suitable Rooftop Space - Reduction
For rooftop solar panels to collect and convert solar energy into electricity with optimal efficiency, (1) no shadow from buildings or trees would block the rooftop throughout the day, (2) obstacles and other barriers to construction would not limit available space for installing the panels and (3) all pitched rooftops would slope south where they could get the best sun exposure. This, of course, is not the case for many buildings in the City of Waterloo. To account for these factors, a reduction in the overall suitable rooftop area was applied in step 8 of the work flow. Extensive