DigitalCommons@University of Nebraska - Lincoln
DigitalCommons@University of Nebraska - Lincoln
Public Access Theses and Dissertations from
the College of Education and Human Sciences Education and Human Sciences, College of (CEHS) Fall 11-2013
Testing the Validity of GRE Scores on Predicting Graduate
Testing the Validity of GRE Scores on Predicting Graduate
Performance for Engineering Students
Performance for Engineering Students
Wei WangUniversity of Nebraska-Lincoln, [email protected]
Follow this and additional works at: https://digitalcommons.unl.edu/cehsdiss Part of the Educational Psychology Commons
Wang, Wei, "Testing the Validity of GRE Scores on Predicting Graduate Performance for Engineering Students" (2013). Public Access Theses and Dissertations from the College of Education and Human Sciences. 192.
https://digitalcommons.unl.edu/cehsdiss/192
This Article is brought to you for free and open access by the Education and Human Sciences, College of (CEHS) at DigitalCommons@University of Nebraska - Lincoln. It has been accepted for inclusion in Public Access Theses and Dissertations from the College of Education and Human Sciences by an authorized administrator of
TESTING THE VALIDITY OF GRE SCORES ON PREDICTING GRADUATE PERFORMANCE FOR ENGINEERING STUDENTS
by
Wei Wang
A THESIS
Presented to the Faculty of
The Graduate College at the University of Nebraska In Partial Fulfillment of Requirements
For the Degree of Master of Arts
Major: Educational Psychology
Under the Supervision of Professor Kurt Geisinger
Lincoln, Nebraska
PERFORMANCE FOR ENGINEERING STUDENTS Wei Wang, M.A.
University of Nebraska, 2013 Advisor: Kurt F. Geisinger
The Graduate Record Examination (GRE), a set of standardized tests designed to determine the scholastic potential of graduate students, is widely used in graduate admissions in the United States. How GRE can predict graduate students’ performance has crucial importance both for universities and for students. Numerous of research studies have examined the validity of GRE scores in predicting graduate success,
however, some limitations and gaps still existed in previous studies. This study targeted a specific discipline of engineering, and investigated the validity of GRE scores in
predicting graduate performance, as measured by graduate GPA (GGPA) for engineering students. The differences in the validity of GRE scores between American and
international students and between master’s and doctoral students were tested. The incremental predictive abilities of GRE over undergraduate GPA (UGPA) and TOEFL scores were also examined. Data of this study were obtained from 1083 students from the engineering programs in a large comprehensive midwestern university. Results of this study indicated that GRE was a useful predictor in predicting 1st-year, 2nd-year, and total GGPA of engineering students. The GRE-Verbal V) and GRE-Quantitative (GRE-Q) scores had a different pattern in predicting graduate grades for master’s and doctoral students. The GRE-V and GRE-Q scores explained more variance in graduate
significant differences were found except when GRE-Q predicted GGPA total scores. UGPA was found to be a strong predictor, and TOEFL scores were also significantly correlated with the criterion variables. GRE scores were found to have significant
incremental validity over UGPA and TOEFL scores in predicting graduate grades. These findings have implications for graduate admission decisions for engineering programs, and can suggest directions of future research, which were also discussed in this study.
Key Words: Graduate Record Examinations, Predictive Evidence of Validity, Graduate Performance, Language Proficiency
ACKNOWLEDGEMENTS
It would not have been possible to complete this thesis without the help and support of the people around me. It is a pleasure to convey my gratitude to them all in my humble acknowledgement.
My first and sincere appreciation goes to my advisor, Dr. Kurt Geisinger for his
continuous help and support in all stages of this thesis. This thesis would not have been possible without his encouragement and supervision. I would also like to thank him for his patience in guiding me academic writing, and for his attitude to research and his conscientiousness in supervision and teaching.
I gratefully acknowledge Dr. Anthony Albano for his advice, supervision, and review of the thesis. His thorough review of my thesis and his comments let me have a chance to change and supplement my work to be better.
In addition, I would like to give my great appreciation to the Institutional Research and Planning (IRP) for proving me the datasets that I requested for this thesis. Specifically, I would like to thank Mary Werner, the associate direct in IRP, for her dedicated work in digging out the datasets from the vast database time after time.
I would like to acknowledge the Department of Educational Psychology in UNL where I learn much knowledge and skills which made the thesis possible. I also want to thank the faculties and staffs in the department for their assistance. Moreover, I would also like to thank my dear friends, to name just a few here like Yuchun Zhou, Chaorong Wu, Shanshan Deng, and Yaodong Yang, for their help and suggestions either technically or personally.
At last but not the least, I want to thank my dearest family, my father, my mother, and my brother for always believing in me and for their unconditional love and continuous
supports. I would also like to express my deep gratitude to Y.M. Tang. With the
encouragement and support from all the dear people, I have been learning to grow up and be brave in my life.
Contents
CHAPTER I ... 1
INTRODUCTION AND LITERATURE REVIEW ... 1
Literature Review ... 3
Theoretical Rationale of the Predictive Evidence of Validity of GRE ... 3
Defining the Criterion: Graduate Performance ... 4
How to Test the Predictive Validity ... 6
Specificity of Academic Disciplines in GRE Validity ... 7
Issue of Language Proficiency: American and International Students... 12
Undergraduate Academic Performance in Graduate Admission ... 16
Difference in Validity by Degree Level ... 19
Role of Range Restriction in GRE Validation Research ... 19
Purpose Statement and Research Questions... 22
Significance of the Study ... 24
CHAPTER II ... 26 RESEARCH METHODS ... 26 Sample ... 26 Procedures ... 26 Measures... 28 Data Analysis ... 30 CHAPTER III ... 33 RESULTS ... 33 Descriptive Statistics ... 33
Difference of Descriptive Statistics of Variables by Alien Status and by Degree Level ... 36
Differences in the Validity of GRE Scores by Alien Status and Degree Level ... 40
Incremental Validity of GRE over UGPA and TOEFL ... 43
CHAPTER IV ... 47
DISCUSSION AND CONCLUSIONS ... 47
Findings of the Study ... 48
Limitations of this Study ... 59
Implications and Recommendations ... 61
Conclusions ... 62
REFERENCES ... 64
CHAPTER I
INTRODUCTION AND LITERATURE REVIEW
Effective selection of graduate students is of critical importance for graduate programs. Poor decisions can result in large costs, such as inefficient use of resources in education, an overall weakening of the profession and academic quality for universities, and even time-consuming and financial burdens for students. In order to identify those applicants who best-fit the programs and who will excel in and enrich the field of study, admission committees consider multiple pieces of information about the applicants through the admission process. Standardized test scores and undergraduate grade-point averages (UGPA) are the objective information about applicants, which serve as primary screening devices. Some subjective information, including personal statements, writing samples, letters of recommendation and interviews, are also considered for admission. Many programs and universities post the requirements, such as average or explicit cutoff or minimum scores of admission tests in order to guide applicants in deciding whether the programs are appropriate to make applications.
The Graduate Record Examination (GRE), published by the Educational Testing Service (ETS), is a set of standardized tests designed to determine the scholastic potential of graduate students and is commonly used in admission decisions by many universities and institutions. According to Norcross, Hanych, and Terranova’s (1996) review of the admission information of graduate psychology programs, applicants’ GRE scores and UGPA are the two most heavily weighted numerical or objective pieces of information in graduate admission process. Based on the information from 458 institutions, 559 separate departments, and 2,023 individual graduate programs in psychology, the Norcross,
Hanych and Terranovea review reported that 93% of doctoral departments and 81% of the master’s departments required GRE general test scores. In addition, the Educational
Testing Service (Graduate Records Examination Board, 2003) encourages all schools and departments to use GRE as a meaningful source of information to screen applicants or select fellowship awardees.
Having an opportunity to gain the access to graduate education is also very
important for students because graduate degrees play an essential role in seeking for good employment opportunities and greater lifetime earnings. A first question is, can GRE scores accurately provide a good source of information for graduate admission
committees to decide whether a student should be admitted or not? A related question is, can GRE scores really predict the success of graduate students? Whether to use GRE scores to screen graduate students for admission into graduate programs is a
long-standing controversy. Proponents have argued that the GRE can predict graduate success well. Critics argue that the GRE may underpredict academic performance of marginalized groups, such as racial or ethnic minorities, women, and older graduate students, thus limiting their access and choice to graduate education (Stricker & Rock, 1995). Because of the wide use of GRE scores in admission decisions and the critical importance of the predictive evidence of validity of the GRE, numerous studies of the GRE validation have been conducted since GRE was created and administered by ETS in 1949. These studies have helped people to have more understanding of the predictive ability of the GRE. However, as stated in Kuncel, Hezlett and Ones’ (2001) meta-analysis, there existed inconsistent results across studies and strong opinions of both sides on the usefulness of the GRE in predicting graduate performance. These inconsistent results resulted in some
contradictory ideas about how GRE scores can predict graduate performance. The limitations and gaps of previous studies are the impetus for further research about the validity of GRE scores.
Literature Review
Theoretical Rationale of the Predictive Evidence of Validity of GRE
The GRE was designed to test basic cognitive abilities that reflect the long-term learning of materials related to graduate performance. The GRE General Test measures the verbal reasoning, quantitative reasoning, critical thinking and analytical writing skills required for success in graduate and business school (Educational Testing Services, 2013). Specifically, the Verbal Reasoning subtest (GRE-V) measures the ability to analyze and evaluate written material and synthesize information obtained from it, and analyze relationships among component parts of sentences and recognize relationships among words and concepts. The Quantitative Reasoning subtest (GRE-Q) tests problem-solving ability, focusing on basic concepts of arithmetic, algebra, geometry, and data analysis. The Analytical Writing subtest (GRE-A) measures critical thinking and analytical writing skills, specifically the ability to articulate and support complex ideas clearly and
effectively.
The belief that GRE scores can be used to predict graduate performance has been based on theoretical argument as well as empirical results. General cognitive ability has been said to be directly related with job knowledge, and job knowledge in turn is most strongly associated with school and job performance (Kuncel et al., 2001). Just as Kuncel, Crede and Thomas (2007) stated, the relationship between general cognitive ability and job performance is nearly fully mediated by job knowledge. According to a model of job
performance determinants from the field of industrial and organizational psychology (McColy, Campbell, & Cudeck, 1994), performance is conceptually a product of declarative knowledge (i.e., knowing what to do), procedural knowledge (i.e., knowing how to do), and motivation. The GRE measures verbal, quantitative and analytical abilities or skills. Test takers need to solve problems, synthesize information, and reason complex relationships between pieces of information. From these perspectives, Kuncel et al. (2001) argued that GRE scores would be correlated with the academic equivalent of job knowledge, and had an influence on graduate performance through declarative and/or procedural knowledge. Based on this analogy, new graduate students with higher GRE scores possess more “job” knowledge and skills, and these students should have a better
graduate school performance when compared with those with less knowledge.
Kuncel et al. (2001) conducted a comprehensive meta-analysis of the predictive evidence of validity of the GRE. This study integrated a variety of previous studies, including 1,753 independent samples and 82,659 graduate students, and considered the topic from different aspects including multiple disciplines, different criterion measures, and correction for statistical artifacts. It demonstrated that GRE scores was generalizably a valid predictor of graduate performance.
Defining the Criterion: Graduate Performance
How to measure the criterion measure of graduate performance is important to be taken into account. In measuring performance, criterion relevance, accuracy, deficiency, and reliability are important considerations. Enright and Gitomer (1989) suggested that graduate performance was multidimensional, and Kuncel et al. (2001) identified eight different criteria that have been used as indicators of students’ success in graduate
programs. These criteria were graduate GPA (GGPA), 1st-year GPA, comprehensive examination scores, faculty ratings, number of publications-conference papers, number of times publications were cited, degree attainment, and time to attain degree. The
predictive abilities of GRE scores were different on different indicators of success. According to the Kuncel et al. (2001) meta-analysis, the GRE was a better predictor of success for overall graduate GPA, first-year GPA, comprehensive exam scores, and faculty ratings than for research productivity, number of publication citations, time to degree attainment, and degree completion.
Among these indictors of student success, GPA perhaps best reflects the extent to which students master the material and acquire knowledge of the field of study, and thus GPA is suggested to be an indicator of both student ability and performance (Fenster, Markus, Wiedemann, Brackett, & Fernandez, 2001). As found in Morrison and Morrison’s (1995) meta-analysis, among the 30 published articles examining the predictive evidence of validity of the GRE, 22 studies used GGPA as their criterion measure of academic success whereas others used diverse criteria such as faculty evaluations and levels of postgraduate productivity. Although GGPA has been pointed out to have limited value in terms of the predictive evidence of validity in some
validation studies, GGPA (especially the 1st-year GGPA and cumulative GGPA) by far is the most widely used criterion of graduate school performance (Kuncel, Crede, &
Thomas, 2007; Kuncel et al., 2001). For most of the specific research studies about the predictive evidence of validity of the GRE, either 1st-year grades or cumulative grades were used as the criterion measure of graduate success, while the performance of the second year was less frequently studied (Educational Testing Services, 2008a; Goldberg
& Alliger, 1992; Perez, 2011; Sternberg & Williams, 1997). The second year of graduate study is a continuous period after the first year in graduate school, so how students
perform in the second year is also a reasonable criterion, as is overall grade-point average. How to Test the Predictive Validity
Most of the research studies of the validity of GRE scores have used the
correlations between GRE scores and a criterion and then present the percent of variance explained by the predictors to interpret the extent to which GRE predicts the graduate performance. However, Bridgeman, Burton and Cline (2009) argued that such ways to describe the validity are difficult to interpret, especially for non-technical audiences. It is possible that readers cannot understand what a variance means, for example, what 10% of variance means, and what an additional 10% of the variance explained by a second variable means, and so on. Correlations and variances are also likely to be misinterpreted. Despite the small percentages of variance accounted for by predictors, the predictors may actually be very important from a practical perspective. In order to display validity information easily for non-technical audiences, Bridgeman et al. (2009) employed expectancy tables to display the results. Students from different fields of study were divided into quartiles based on GRE scores and UGPA, and then the percentages of students earning the 1st-year GPA of 3.8 or higher (as a criterion of graduate success) were noted in both the top and the bottom quartiles. By comparing these percentages, one could compare the graduate success rates among students with high and low GRE scores and/or UGPA. Results from the expectancy tables demonstrated that the percent of students with high GRE scores falling in the top 25% of GPA was twice as high as the percent of students with low GRE scores. Also, by combining GRE and UGPA in one
graph, expectancy graphs could also provide information about the incremental validity of GRE over UGPA in predicting graduate success. This way, the expectancy tables gave a clear indictor of the potential value of test scores.
Despite the possibility that correlation coefficients and the percent of the variance explained may be difficult to interpret or be misinterpreted, this approach has been widely used and recognized in the professional literature. In addition, results from some studies showed that the extent to which the test predicts typical graduate outcomes has varied widely, with some studies indicating less than 10% of the variance in an array of criteria (e.g., 1st-year GPA, cumulative GPA) accounted for by GRE scores (Goldberg & Alliger, 1992; Morrison & Morrison, 1995; Sternberg & Williams, 1997). In spite of the little variance accounted for, researchers suggested that even slight improvement in validity could be useful, and GRE scores were indicated to be a valid predictor of
graduate success (Holt, Bleckmann, & Zitzmann, 2006; Kuncel et al., 2001). Also, many studies introduced in this review have found reasonably large variance accounted for by GRE. Thus, there is still enough evidence to demonstrate the importance of the use of correlation coefficients and the percent of the explained variance as the indicators of predictive validity.
Specificity of Academic Disciplines in GRE Validity
Although for all graduate students, there are many similarities in some of the fundamental tasks required, there are differences in the types of training and the demands of different academic areas. For example, the social science majors may require higher language proficiency of their students than mathematics, physics, or engineering majors. Also, the grading standards and evaluation criteria may differ from discipline to
discipline. Thus, it is good to consider the predictive evidence of validity of the GRE specifically for different disciplines.
Kuncel et al. (2001) categorized different disciplines into four different fields: social sciences, math-physical sciences, humanities, and life sciences. This meta-analysis found that the predictive values of the GRE were inconsistent across disciplines and across test segments (i.e., GRE-Q and GRE-V). For example, the GRE-V accounted for more variance in graduate GPA (GGPA) in the social sciences than in the math-physical sciences, and the GRE-Q was less predictive of GGPA in the social sciences, life sciences, math-physical sciences than in the humanities. In addition, Stack and Kelly (2012) stated that GRE scores might be more predictive of GGPA in disciplines with low mean GRE scores than in disciplines with high mean GRE scores. They gave the ceiling effect as a possible explanation. In effect, once a certain level of intellectual functioning as
measured by GRE scores is reached, the predictive power of the GRE may become weaker. House and Johnson (1993) also found that the relationships between predictor variables and degree completion varied by area of graduate study or academic
background. The result showed that GRE-V entered the regression model first as the best predictor of degree completion for students in professional psychology but entered the regression model last for general/experimental psychology.
There are very few studies except meta-analytical studies that examined various disciplines or made a comparison among different disciplines in one study. Most of the individual studies only examined the validity within one discipline, or they did not differentiate various disciplines even if they used a mixed sample. In a study by Powers (2004), the validity of GRE scores was based on the context of veterinary medicine. The
1st-year GPAs from a sample of 16 veterinary medical colleges were predicted by GRE scores and undergraduate GPA (UGPA). Because of the highly selective nature of veterinary medical school admission, statistical correlations were applied to correct for the effects of range restriction in the test scores and UGPA and for the unreliability of the criterion, which resulted in a significant increase in the validity estimates. After the statistical corrections, the validity coefficients were 0.53 for the combination of all three GRE General Test scores, 0.59 for UGPA, and 0.71 for the combination of GRE scores and UGPA together.
Because of the difficulty to compare and contrast the validity of GRE scores among various disciplines in a single study, and in order to have a better understanding of the validity of GRE, it is necessary and important to integrate studies that targeted the same or closely related disciplines. For example, there were a few studies that examined the predictive validity of GRE for psychology students. Sternberg and Williams (1997) examined the validity of GRE in predicting different kinds of performance in graduate psychology program in Yale University. The different criteria included the 1st-year and the 2nd-year GPA, professors’ ratings of students’ dissertations, and professors’ ratings of students’ analytical, creative, practical, research and teaching abilities. In sum, the results
showed that GRE scores were found to be modest predictors of the 1st-year GPA but not the 2nd-year GPA, but of limited or no use in predicting other aspects of performance. Only GRE-A scores were predictive of consequential evaluations of student performance, but only for men. In the discussion part of the study, the authors explained some
objections that might be raised against the design of the study and the interpretation of their results, such as the restriction of range, the unreliability of faculty ratings, and that
Yale graduate students could not represent a typical sample and so on. Another study by Schmidt, Homeyer, and Walker (2009) targeted counseling graduate students. This study used GRE scores and UGPA as the predictors to predict the Counselor Preparation Comprehensive Examination scores (CPCE). The results indicated that UGPA, GRE-V, and GRE-Q scores were valid for predicting CPCE scores, accounting for 21% of the variation. Among the three predictors, GRE-V was the best predictor because GRE-V scores predicted not only CPCE total scores, but also each of the eight CPCE subscale scores, and also the probability of passing the CPCE on the first attempt. But the author mentioned that one of the limitations of this study was that the generalization of the results to other programs was not determined. In the study by Fenster, Markus, Wiedemann, Brackett, and Fernandez (2001), GRE scores were used to predict both GGPA and time to completion (TTC) for forensic psychology students. The results showed that all predictors were appreciably related to GGPA, but the ability to predict TTC was smaller. In addition, the regression model with separate verbal and quantitative subscores (R2 = 0.34) was better than that with a combined GRE total score (R2 = 0.32) in predicting GGPA, but the difference in prediction was not substantial and the results did not provide statistical support for one approach over the other. From these studies
targeting only psychology students, it may be seen that the validities of GRE scores, even though for students in closely related majors, appear somewhat inconsistent.
Criminal justice is another discipline studied by researchers. McKee, Mallory, and Campbell (2001) studied how undergraduate GPA (UGPA) and GRE scores predicted graduate GPA for master students in criminal justice at a medium-sized southern
When controlling UGPA, the GRE-V explained the most variance (9.9%), followed by GRE-A (8.9%) and last by GRE-Q (6.9%). A total of 40% of variance in graduate GPA was accounted for by the combination of UGPA and GRE scores. This study suggested all three GRE subscales should be considered in the graduate admission process in criminal justice programs. Stack and Kelley (2002) also studied the validity of GRE scores for master students in criminal justice. They found that GRE-V alone could explain 21% of the variance in GGPA, and it was a better predictor of GGPA than GRE-Q. Reisig and DeJong (2005) examined the validity of GRE scores and undergraduate GPA for both master’s and doctoral students in criminal justice from Michigan State University. The study found that although the GRE scores had different predictive abilities on different measures of academic performance, the GRE was still a good reference by graduate committees during the screening and admission process.
Holt, Bleckmann, and Zitzmann’s study (2006) examined the validity of GRE for
students in engineering management program. Results indicated that GRE scores
modestly predicted students’ first-year and cumulative GPAs where GRE-V and GRE-Q
scores accounted for a significant larger portion of variance than undergraduate GPA, but GRE-A added nothing to the validity. Another study by Ayers and Quattlebaum (1992) examining Asian master’s students in engineering found that the GRE-Q was the best predictor of success in graduate study. Feeley, Williams and Wise (2005) tested the validity of GRE scores in predicting success only for communication students. It found that UGPA was a better predictor of GGPA than GRE for both master’s and doctoral students. For master’s students, V was positively correlated with GGPA and GRE-Q was positively related to earning a degree.
The studies reviewed above provided the information that the predictive evidence of validity of the GRE was valued across various disciplines. However, there is little understanding of the variation in the relationship across disciplines. These studies
indicated that the validities of the GRE were not consistent across different disciplines or among closely related majors. Just as argued by researchers, with respect to graduate education, the relationship of GRE scores and graduate performance may be dependent on the particular discipline being investigated (House & Johnson, 1993; Stack & Kelley, 2002; Thornell & McCoy, 1985).
Issue of Language Proficiency: American and International Students
The relationship between GRE scores and graduate performance may be moderated by some variables. The first potential moderator is language proficiency. In the United States, international students make up a nonignorable proportion of the graduate population. According to Young and Brooks (2008), there is occurring a vast change in the demographics of the United States, as the number of racial and ethnic minorities is quickly becoming a greater proportion of the population, projected to account for more than 50% of the total population by 2050. For most international students, English is not their primary or preferred language. The GRE tests are focused upon students’ cognitive abilities, which are expected to be similar for both native and non-native English speakers, but scores on these tests also reflect the language
proficiency. This point of view can be demonstrated by Stricker’s study (2004), which found high correlations of TOEFL total scores with GRE-V and GRE-A and its moderate correlation with GRE-Q. English language proficiency is a critical factor for the
for teaching and learning. For this reason, besides GRE scores, American colleges or universities usually request international students to reach a minimum level of language proficiency as a threshold of admission (Cho & Bridgeman, 2012; Wait & Gressel, 2009).
The Test of English as a Foreign Language (TOEFL) is a test that evaluates the English proficiency of people whose native language is not English. It is one of the most commonly used English proficiency tests that institutions of higher education consider in determining whether a prospective student has met the level of language proficiency. Many studies have showed that TOEFL scores played an important role on the academic success for international students. For example, Wait and Gressel (2009) found that there was a positive and statistically significant relationship between TOEFL scores and GPA for international engineering students. Increasing TOEFL scores was also related to an increasing probability of success indicated by the pass rate of comprehensive assessment examinations and graduation rate. However, Vinke and Jochems’ (1993) study indicated there was a cut-off point in the relationship between English proficiency and academic success. They suggested that there was a range of TOEFL scores within which an increase in the score was related to an increase in the chance of academic success, while below or above the limits of the range, an improvement in TOEFL scores had little or no effect on the academic performance. And the upper and lower limits of this range may vary by different academic disciplines or institution specific.
In Cho and Bridgeman’s study (2012), the validity of TOEFL iBT (Internet-based testing) scores was examined by predicting the 1st-year GPAs for non-native English speakers from10 universities in the United States. The additional information accounted for by TOEFL beyond other admissions related tests (i.e., GRE, GMAT, SAT, etc.) was
also examined. Correlation-based analysis found that TOEFL scores only explained 3% of the variance of GPA for both graduate and undergraduate students, and the incremental validity of TOEFL scores was shown to be fairly small. The expectancy graphs were also used to provide useful information of the validity of TOEFL scores. For example, the expectancy graphs showed that the probability of being in the top 25% GPA category doubled when their TOEFL scores were in the highest 25%, compared with those in the bottom 25% TOEFL group. Also, the students with relatively low TOEFL scores had a higher chance to earning low GPA than students with relatively high TOEFL scores.
As indicated above, though studies found some significant correlations between TOEFL scores and academic performance, the variance explained by TOEFL scores was small. Cho and Bridgeman (2012) summarized that the research findings on the power of TOEFL scores to predict academic success were mixed and inconsistent. Such diverse findings made it difficult to make a definitive conclusion about the validity of TOEFL in predicting academic success. Cho and Bridgeman gave some reasons why it was difficult for a language proficiency test to predict academic success. One reason is that there is no definite logic of the relationship between language proficiency and academic success. Language proficiency is a necessary but not a sufficient condition for academic success. Language is a critical factor in learning, but it is only one of many factors, such as motivation, learning strategies, and so on. One example of the explanation is, though most native speakers have no problem with their English language skills, not all native speakers are successful in academia. However, Cho and Bridgeman stated that even a small correlation or a trivial amount of variance explained could indicate a meaningful relationship between variables.
A qualitative study by Mupinga and Mupinga (2005) explored the perceptions of international students toward the GRE. Seven international students from different countries and different graduate programs were interviewed to establish their perceptions toward the GRE. Their perceptions toward the GRE included the content and context, structure, and purpose of the exam. A conclusion of the study was that it was very hard for a test to measure all aspects of intelligence no matter how well it was developed. The results found that the content and context of the GRE test, especially the GRE verbal section, were considered to be biased against international students, and they also believed that in general the test did not measure the cognitive ability to perform well in graduate school. Moreover, Milner, McNeil and King (1984) found that when GRE was eliminated from the admission process and only UGPA of 3.0 or higher was used as the admission criterion, there was a big increase in the minority enrollment rate; it doubled from 9.85% to 17.56%, and the elimination of GRE in the admission did not appear to decrease the quality of the students.
Perez (2011) stated that the effects of factors such as country of origin and English as a Second Language (ESL) had not been explored extensively in studies, but these factors were very important for the vast number of immigrants from non-English speaking countries who were entering the United States. Pennock-Roman (2002) studied the relations between GRE scores and another Spanish language standardized test among Puerto Rican students. She found that Puerto Rican students performed better on the Spanish test than on the GRE. Perez (2011) pointed out that the negative stereotypes of races or minorities might be a factor that affected students’ perceptions of achievement and consequently affected students’ performance in high stakes tests where White men
were perceived to achieve higher levels of performance. This explanation could be
demonstrated in Steel’s (1997) study where African Americans were found to score lower
in diagnostic tests of academic aptitude (such as admission tests) than in non-diagnostic tests. Moreover, when comparing the performance of Black and White students, the differences were narrowed significantly in non-diagnostic tests than in diagnostic conditions.
As stated above, nonnative speaking students take up a nonignorable amount of the population in graduate programs in the United States. It is good to examine the difference in the predictive abilities of the GRE in predicting graduate performance between American and international students. Further, the extent to which language proficiency predicts graduate performance, and the influence of language proficiency on the predictive validity of GRE, or, the incremental validity of the GRE over language proficiency are also deserved to examine.
Undergraduate Academic Performance in Graduate Admission
One indication of graduate students’ performance and success is GGPA. Similarly, undergraduate GPA (UGPA) is usually a good indicator of students’ academic
knowledge, abilities and performance during undergraduate studies, and it is normally considered together with GRE scores by admission committees in the graduate admission process. Applicants’ GRE scores and UGPAs are the two most heavily weighted
numerical or objective information in graduate admissions process (Norcross et al., 1996). In research studies, UGPA has also been combined with GRE scores to predict graduate GPA, and it was found to act as a very important role in predicting graduate performance. The comprehensive meta-analysis by Kuncel et al. (2001) examined the validity of GRE
scores and undergraduate GPA on predicting graduate school performance. By
integrating data from 1,753 independent samples and 82,659 graduate students, this meta-analysis found that the GRE and UGPA are generalizably valid predictors of most of the indicators of graduate performance.
Reisig and DeJong (2005) examined the predictive abilities of GRE scores and prior GPA on multiple measures of performance (i.e., final graduate GPA, low grades, and incompletes) for master’s and doctoral students of criminal justice from Michigan State University. This study found that GRE scores were not consistent in predicting different measures of academic performance. In contrast, undergraduate GPA was a consistently stronger predictor in predicting different measures of graduate student performance than GRE scores. The combination of GRE scores and undergraduate GPA was a fairly robust predictor of academic performance, and as expected this combination explained more variance in the dependent variable than either independent variable did by itself. This study suggested that both GRE scores and prior GPA should continue to be used in combination by graduate committees during the screening and admissions process. Powers (2004) found that when UGPA and GRE were used together to predict first year GGPA for students from veterinary medicine schools, they had a similar level of
prediction, with the validity coefficients of 0.59 and 0.53, respectively, and with a multiple correlation coefficient of 0.71. McKee, Mallory, and Campbell (2001) studied master’s students in criminal justice at a medium-sized southern university, and found
that undergraduate GPA alone explained about 24% of the variance in GGPA, and a total of 40% of variance in GGPA was accounted for by the combination of undergraduate GPA and GRE scores. Williams and Wise (2005) tested the validity of GRE scores and
undergraduate GPA for communication students. It found that UGPA was a better predictor of GGPA than GRE for both master and Ph.D students. In Case and Richardson’s (1990) study, based on the data from students in the Library and
Information Science program at UCLA, undergraduate GPA was found to be the strongest predictor of GGPA. This study also found that GRE-V scores were more strongly correlated with GGPA than GRE-Q scores (i.e., r = .354 and .285, respectively). The results also showed that students with lower GRE scores and poor UGPAs were more likely to drop out of school. In Milner, McNeil and King’s (1984) study, the
minority enrollment rates were examined after GRE scores were eliminated from
admission process but only using UGPA of 3.0 or higher as the admission criterion. This study found a significant increase in the minority enrollment rate when using this
admission method, and UGPA was found to account for 9% of the variance in graduate class GPA, compared with 5.7% accounted for by the GRE.
However, in very few cases, the power of UGPA in predicting graduate success was not obvious. In the study by Smaby, Maddux, Richmond, Lepkowski, and Packman (2005), GRE scores and UGPA were used to predict counseling knowledge, counseling skills, and personal development of graduate students of counseling programs. Results indicated that GRE scores and UGPA were of limited value when used to predict success in counseling.
Based on the review of research about the validity of GRE scores, it appears that UGPA has at least as high value as GRE scores in predicting graduate student success. It is important to consider both GRE scores and UGPA to study their separate and
Difference in Validity by Degree Level
Extensive research has examined the effectiveness of admissions tests for use in higher education, however, just as Kuncel, Wee, Serafin, and Hezlett (2010) summarized, the similarity of effectiveness for predicting performance at both the master’s and
doctoral levels had gone unexamined until recent years. There are differences in program complexity and structure by degree level, but would these differences have an impact on the validity of GRE? In order to answer this question and fill the research gap, the Kuncel et al. (2010) meta-analysis examined the difference in predictive evidence of the GRE by degree level. By integrating the results of about 100 studies involving about 10,000 students, this meta-analysis found that GRE scores had good validity for predicting the 1st-year GGPA, final GGPA, and faculty ratings for both master’s and doctoral students, with differences ranging from small to zero. Perez (2011) studied the validity of GRE in predicting graduate success for students from a variety of disciplines at a Hispanic serving institution of higher education, and found that both the GRE-Q and GRE-V were good predictors of success for master’s students, but the GRE-Q was not predictive of success for doctoral students.
Role of Range Restriction in GRE Validation Research
As noted above, validity evidence is usually expressed in terms of correlations. Correlational approaches face a problem if the data do not represent the full range of the population of interest, that is, information about how those who were not selected would have performed is missing. As a result, the correlation is often underestimated.
Theoretically, the evaluations of the validity of the GRE should be based on all the students who took the test or who apply to the graduate school. In fact, however, the
validity of the GRE is based on individuals who have been admitted by graduate schools. Students with lower GRE scores than the minimum requirement of the schools are normally not admitted, so the range of GRE scores for graduate school incumbents is smaller than the range of graduate school applicants. This problem can attenuate the observed correlation between GRE scores and graduate school performance. Thus, due to the restriction of range of GRE scores among the selected students, the population value of the validity represented by the correlation between GRE scores and graduate
performance criterion is almost always underestimated. This issue is range restriction. As Chernyshenko and Ones (1999) mentioned, two major reasons can result in the
inconsistent results of GRE validation research: the criterion problem and the range restriction problem. The former identifies the limitations of all criteria of graduate
performance. Moreover, besides the range restriction of GRE scores, graduate GPAs also have a range restriction. As Oldfield and Hutchinson (1997) pointed out, there are two kinds of range restrictions in graduate school research. One is from input variables resulting when students with low GRE scores and other admission variables are eliminated from the analysis, and another one is from output variables because most students receive an grade of A or B in courses which result in a narrow range of GPAs. The extreme problem of range restriction has been pointed out in some graduate
admission validity studies (Oldfield and Hutchinson, 1997; Sterberg, & William, 1997), however, just as Kuncel et al. (2001) summarized, previous studies typically have not estimated the extent to which range restriction attenuates GRE validity coefficient.
To correct for range restriction, defining the population of interest is critical, and the ratios of selected group standard deviations to applicant pool standard deviations are
necessary (Kuncel et al., 2007). In the study by Chernyshenko and Ones (1999), the selection ratio was examined for 253 psychology Ph.D programs to estimate the effect of existing range restriction on GRE scores in validation. This study found that 11% of applicants were accepted and enrolled in the psychology programs, which means that the other 89% of the applicants were not fully available for validation research. After the correction of range restriction, GRE was found to be a valid predictor of graduate school performance. Chernyshenko and Ones (1999) argued that the controversy about the validity of GRE was the result of the reliance on small sample research and the lack of awareness of range restriction effects in graduate selection. The low selection ratio of graduate programs resulted in a restriction of variance of GRE scores, and consequently resulted in a decrease in observed validity coefficients. They also suggested that this problem produced erroneous results for previous investigations of GRE validity in which GRE was not found to be a valid predictor of graduate school success just based on observed correlations.
Kuncel et al. (2001) found considerably stronger relations among GRE scores and several criterion measures of graduate performance when correcting for range restriction. This review found the validity coefficients of GRE-V/GRE-Q with GGPA of 0.39/0.34, with faculty ratings 0.37/0.38, and with degree attainment 0.22/0.31. Power’s (2004) study sampled from 16 veterinary medical schools which are also highly selective in admission. Thus, a restricted range of test scores and UGPA for enrolled students at each school was apparent. By applying statistical correlations to correct for the effects of range restriction in the predictors and for the unreliability of the criterion, it resulted in a
range restriction should be emphasized, and correction of range restriction should be considered if needed and applicable.
Purpose Statement and Research Questions
From the studies reviewed above, it was found that using GRE scores as one of the admission tests to predict graduate performance has both a strong theoretical rationale and empirical support. However, the results about the predictive evidence of validity of the GRE are inconsistent across studies, with the variance of graduate success explained by GRE ranging from less than 10% to as high as about 36% (Goldberg & Alliger, 1992; Fenster et al., 2001; Morrison & Morrison, 1995; Powers, 2004; Sternberg & Williams, 1997). A variety of conditions may have an impact on the validity, such as discipline specificity, the nature of the criteria, range restrictions, sampling errors, and some other uncontrolled factors. Thus, more research is needed to fill the gaps existing in previous studies. Moreover, as mentioned above, language minorities for whom English is not their first language are becoming an increasing number of the student population in graduate schools in the United States. In the present study, the difference in the validity of GRE scores between native English speakers and non-native English speakers was tested. The language issue was also taken into account to investigate the incremental validity of GRE scores over language proficiency.
Among all the various disciplines, engineering is an important graduate program in universities, and the importance of the engineering graduate degree is increasingly being recognized by the professional engineering community (Rogers & Goktas, 2010). As the National Academy of Engineering (2005) pointed out, the typical engineering bachelor degree cannot accommodate the academic development required for
professional engineers, and that the master’s degree should be considered the first
professional engineering degree. As a consequence of this awareness of the importance of the graduate engineering degree, the number of applicants to U.S. engineering graduate programs increased annually by an average of about 4% over the period of ten years from 1997 to 2007 (Bell, 2008). Facing the increasing number of applicants, admission
committees for engineering programs are also facing the questions of how to identify the best students who fit the program through their admission process. The joint importance of admission issues and engineering education encourages more research on this field. However, from the literature review, it was found that the validity studies of GRE scores have not widely extended to the discipline of engineering. Thus, the present study intended to fill this gap and to target the population of engineering students to study the predictive validity of GRE scores in predicting graduate performance. In addition, as mentioned in the literature, since it was lacking of research differentiating degree level, this study also tested the difference of the validity between master’s and doctoral students.
Specifically, the research questions were:
1) How do GRE scores predict engineering students’ 1st-year, 2nd-year and total GGPA in the graduate program?
2) What are the differences in the validities of GRE scores between American students and international students?
3) What are the differences in the validities of GRE scores between master and doctoral students?
4) How does UGPA predict engineering students’ 1st-year, 2nd-year and total GGPA in the graduate program? What is the incremental validity of GRE over UGPA?
5) Specifically for international students, how does the language proficiency (measured by TOEFL) predict engineering students’ 1st
-year, 2nd-year and total GGPA in the graduate program? What is the incremental validity of GRE over language proficiency?
Significance of the Study
This study has boththeoretical and practical values. Theoretically, it extends the research of the validity of GRE scores, and it contributes to an extensive knowledge of the effectiveness of GRE scores in predicting graduate success in graduate schools. Examining the predictions of 1st-year, 2nd-year, and total GGPA together in one study can reveal significant results about the predictive abilities of the GRE from both short-term and long-term perspectives. This extensively enriches the research on the predictive evidence of validity of the GRE, and also fills the gap of limited research on long-term prediction. Moreover, targeting engineering students fills a gap that limited previous research studied the validity of the GRE for this specific discipline. This study also provides several practical considerations. First, this study provides useful information for graduate admission decisions, important for both universities and applicants. Admission committees can make scientific decisions to recruit the right applicants to the graduate programs, and applicants can gain the appropriate opportunity to receive graduate
education. The admission decisions can have a critical impact on the quality of the output of education, and on students’ futures of life and careers. In addition, taking the issue of
language proficiency into account will aid in the consideration of the equity in
assessment. A test is considered to be biased if its predictive power is not equivalent for different subgroups (Johnson, Carter, Davison, & Oliver, 2001). As stated by Sandoval
and Durán (1998), fairness demands that extra care be taken with the growing population of language minorities. All tests normed on native speakers of English, to some extent, are measures of English competency and proficiency, and “when used with nonnative speakers, a test in English must be interpreted as measuring English proficiency in addition to the constructs it was designed to measure (p. 181)”. By comparing the validities between American and international students, and examining the effect of TOEFL scores in predicting graduate performance can give a more comprehensive interpretation of the utility of GRE scores. It provides valuable implications about the possible different evaluations for American students and international students in the admission.
CHAPTER II
RESEARCH METHODS
Sample
The sample of this study was from the various engineering programs of a large comprehensive midwestern university in the United States. It covered a variety of programs of engineering, including Electrical Engineering, Manufacturing Engineering, Civil Engineering, Architectural Engineering, Environmental Engineering, Chemical Engineering, Mechanical Engineering, and some other engineering programs. Student records were obtained by submitting a data request from the university’s office of
Institution Research and Planning. The university kept the data of students since 2000. In this study, the data were collected from all students who were enrolled in these
engineering programs during the 11 academic years, from 2000 to 2011. But only the students who had registered classes for at least one and a half years or 3 academic semesters (in order to get the 1st-year and the 2nd-year GGPA) were retained for use in this study.
Procedures
The data were obtained separately from different databases maintained by the university’s office of Institution Research and Planning and the Graduate Studies. One
was the admission file, a database containing the information from the applications submitted to the university, including GRE scores, UGPA, and TOEFL scores, and some other information. Another database contained the information about the demographics (e.g., gender, country of origin, etc.), the graduate status (e.g., enrolling terms,
of coursework included the grades in each semester and the corresponding credit hours in each semester, and the cumulative grades and the corresponding cumulative credit hours at each point of semester. Then, the 1st-year GGPA and the total GGPA were obtained directly from the records, but the 2nd-year GGPA was obtained by averaging the grades of all the classes in the second year of graduate school. These databases were then organized and joined into a single database in order to obtain a more complete data profile for each student. Finally, only the data of interest were used, which included admission status, nationality, sex, degree level, department, major, entry term, exit term, GRE scores (Verbal, Quantitative, Analytical Writing, and total scores), TOEFL scores, UGPA, first-year GGPA, second-first-year GGPA, cumulative GGPA, and the corresponding credit hours.
Considering the existence of considerable missing or incomplete data for many students, and in order to keep as much information as possible, the students who had complete GGPAs (1st-year, 2nd-year, and cumulative GGPA) and at least one predictor score (i.e., either GRE, TOEFL, or UGPA) were retained. Students with none of the three predictor scores were eliminated. Moreover, in synthesizing all the given records of grades and credit hours for each student, inconsistencies and incompletions in the data were found for some students. For example, by averaging the grades of classes in the first one or two years, the results for some students did not match with their given cumulative grades. This situation made it impossible to determine what the grades actually were for these students. Thus, these students with inconsistent or wrong records were eliminated. After meeting these selection criteria, a total of 1083 students (N=1083) were available in the final database. Amongst these students, 39.6% of the students were originally from the United States (41.6% were non-alien), 24.6% were from China, 14.3% were from
India, and the rest (21.5%) were from other 62 countries around the world. In terms of gender, 79.8% of the students were male and 20.2% were female. Regarding degree level, master’s students consisted 61.3% of all the selected students, and doctoral students were
the remaining 38.7%.
Measures
Graduate Student Performance. Three measures were used as the indicators of graduate performance: the 1st-year GGPA, the 2nd-year GGPA, and the total GGPA (or cumulative GGPA). The three criterion measures were available for all the selected students (N=1083). GGPA was on a four-point scale ranging from 0 through 4.0. The 1st -year GGPA and the 2nd-year GGPA both covered one academic year. The total GGPA was different and it covered the period of time from the beginning when students enrolled in graduate study until the end they graduated or to the last semester the data covered in the database (i.e., 2012 Fall). The number of years which total GGPA covered differed by individual. For example, doctoral students usually had more years of records than
master’s students. In addition, considering the number of classes that students registered in each year differed individually, the corresponding credit hours for each student in each period of time were also kept in the database.
UGPA. UGPA is a cumulative grade point average covering all the undergraduate coursework. It was also on a four-point scale ranging from 0 to 4.0. However, in this study, this measure was only available for the students who had studied and got their bachelor’s degrees from the targeted midwestern university. For other students who
graduated from other universities or colleges, their UGPAs were not available because the university did not tetain this record of admission.
Graduate Record Examination. GRE has three subtests that measure verbal reasoning, quantitative reasoning, and analytical writing skills (Educational Testing Services, 2013). Specifically, the Verbal Reasoning subtest (GRE-V) measures the ability to analyze and evaluate written material and synthesize information, and analyze
relationships among component parts of sentences and recognize relationships among words and concepts. The Quantitative Reasoning subtest (GRE-Q) tests problem-solving ability, focusing on basic concepts of arithmetic, algebra, geometry, and data analysis. The Analytical Writing subtest (GRE-A) measures critical thinking and analytical writing skills, specifically the ability to articulate and support complex ideas clearly and
effectively. The GRE-V and the GRE-Q had a possible score range from a minimum of 200 to a maximum of 800. GRE-A tests were changed during this period with test scores following two different scales: one was on a 7-point scale ranging from 0 to 6.0; another one had the same scale as GRE-V ranging from 200 to 800. The GRE total was the sum of the GRE-V and GRE-Q scores. In this study, only GRE-V, GRE-Q, and GRE total scores were used in the analysis.
TOEFL. The TOEFL is a test to evaluate the English proficiency of people whose native language is not English. Since 2006, the Internet-based version of the TOEFL test (TOEFL iBT) had been phased in worldwide, testing listening, reading, speaking and writing skills. Before 2006, TOEFL tests had different versions - paper-based TOEFL (PBT) and computer-based TOEFL (CBT), testing listening, structure/writing, and reading skills, no speaking (Alderson, 2009). These three versions have different scoring scales. The TOEFL Score Comparison Tables are available to show the relationship between the new TOEFL iBT scores and the scores from the CBT and PBT versions of
the TOEFL tests (Educational Testing Services, 2005). Institutions may choose to set TOEFL iBT scores that are comparable to the CBT and PBT for the total score, and for the Reading, Writing and Listening scores. In this study, 53.1% (N = 575) of the total students had TOEFL scores. Among these students, 211 students took TOEFL PBT, 176 iBT, and 188 CBT. In order to integrate the TOEFL scores, these three versions of scores were placed on one scale. Based on the characteristics of the scores on the TOEFL Score Comparison Tables, this study transformed TOEFL iBT scores and PBT scores into the CBT scores. The TOEFL CBT has a scoring range of 0 to 300. Since the difference of the subtests of each version (i.e., TOEFL iBT has a subtest which tests the speaking skills but CBT and PBT not), only the total scores were used and transformed. For those students (i.e. only five students in this study) who took the TOEFL more than one time, the highest score was used as his or her TOEFL score.
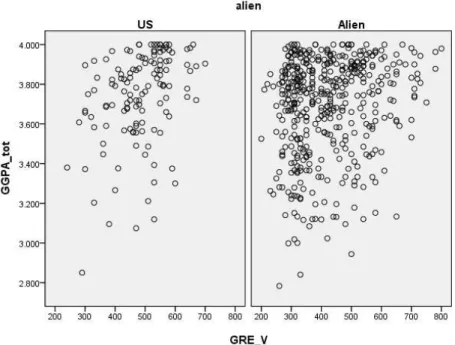
Demographics. The term alien status in this study represented whether or not the students were the residents of the United States. In the final sample, 41.6% of the
students were US residents, and the remaining 58.4% were aliens. In terms of the degree level, students who enrolled as a doctoral students or originally as master’s students and then continued to the doctoral programs of the same midwestern university were noted as doctoral students. Students who enrolled as master’s students and did not continued to the doctoral programs of the same university were noted as master’s students.
Data Analysis
The data analysis for this study consisted of both descriptive and inferential statistics. Some demographic information was presented at the beginning, such as the frequencies and percentages of different groups (e.g., alien status, degree, gender). The
descriptive statistics were computed for all three predictor variables (GRE scores: Verbal, Quantitative, total; UGPA, and TOEFL) and three criterion variables (1st-year, 2nd-year, and cumulative GPA). In addition, the descriptive statistics were also computed for different groups (i.e., American vs. international students; master’s vs. doctoral students). The group differences were further tested by independent t test. The difference of
variables by alien status and degree level would help us to explain the following differential prediction of GRE scores between different subgroups.
To test the validity of GRE scores, 1st-year GGPA, 2nd-year GGPA, and total GGPA were regressed separately on GRE-V, GRE-Q, and GRE total scores. The standardized regression coefficient provided the information about the direction and the strength of the prediction, and R square informed us how much variance was explained by the predictor. The corresponding F-test tested the significance of the prediction. To test the difference in the validity of GRE scores by alien status and degree level, separate regressions were conducted for American and international students, and for master’s and doctoral students.
Hierarchical multiple regression analyses were conducted to examine the
incremental validity of GRE scores over UGPA in predicting 1st-year, 2nd-year, and total GGPA. This analysis evaluated whether UGPA was a good predictor of graduate
performance, and whether adding GRE scores could improve the prediction and how much more variance in GGPA could be explained by GRE scores over/beyond UGPA. In the analysis, the UGPA was entered into the hierarchical model first (i.e., model 1), then GRE scores (GRE-V, GRE-Q, GRE-tot, separately) into the model (i.e., model 2). Hierarchical multiple regression analysis provides the proportion of variance in the
criterion that is explained by the predictor variables in each model, indicated by R2, and the change in R2 in the latter model over the former model. In this case, the R2in model 1 was the variance explained by the UGPA, then the R2in model 2 was the variance
explained by both UGPA and GRE scores, and the change in R2was the additional variance explained by GRE score but not by UGPA. In addition, by using F-test, the significances of R2and R2change were tested to determine whether the explained
variances were significant and whether GRE scores added significant more variance over UGPA. Similarly, to test the incremental validity of GRE scores over TOEFL scores, this hierarchical multiple regression analysis was used in the same way.
As mentioned in the section of research methods, because of incomplete records of many students, only the students who had full records of the three criterion variables and the record of at least one of the three predictors (GRE, TOEFL, UGPA) were
retained in the final database. Finally, 1083 students were retained, however, GRE scores were available for 591 of these students, UGPA for 398, and TOEFL scores for 575 students. Among these students, only 401 students had both GRE and TOEFL scores (and of course these students were all international students), and 65 students had both GRE scores and UGPA, however, only 5 students had all the three predictor scores. Among these numbers, the overlapped students (i.e., those students who had the scores of two predictors) were different. To solve the problem of incomplete data, this study applied the Listwise deletion to deal with the missing data. As a consequence, in answering each research question, different samples and the corresponding different sample sizes were used in the analysis, as the variables involved in each question differed from each other.
CHAPTER III
RESULTS
This chapter presents the results of this study that investigated the validity of GRE scores in predicting graduate performance for engineering students. Descriptive statistical analyses were conducted first for the demographic and research variables. To examine the validity of GRE scores specified in each research question, the methods of Pearson’s correlations, simple linear regression, and hierarchical multiple linear regression were utilized.
Descriptive Statistics
The database contained the information for a total of 1083 students (N = 1083). Among these students, 41.64 % (N = 451) were non-alien (i.e., American students) and 58.36% (N = 632) were Alien (i.e., international students); 61.31% (N =664) of the students were master’s students, and 38.69% (N = 419) were doctoral students. As shown in Table 1, amongst master’s students, American students and international students
constituted 55.7% and 44.3%, respectively. Amongst doctoral students, international students composed a much larger percentage (80.7%) than American students (19.3%). American students for most part (N = 370, percent = 82.0%) were master’s students, compared with a much smaller number of doctoral students (N = 81, percent = 18%). By contrast, for international students, a relatively close proportion of students distributed between master’s and doctoral students (i.e., 46.5% and 53.5%, respectively).
Table 1
Frequency and Percentage of Master’s and Doctoral Students by Alien Status
Alien Status N % N % Total
US 370 55.7% 81 19.3% 451
Alien 294 44.3% 338 80.7% 632
Total 664 100% 419 100% 1083
As for academic characteristics, Table 2 presents the means, standard deviations, and minimums and maximums of all criterion variables and predictor variables. The means of the three criteria, 1st-year GGPA (M = 3.64, SD = .32), 2nd-year GGPA (M = 3.68, SD = .33) and total GGPA (M = 3.68, SD = .27), were quite similar. They were all on a 0-4 scale. The corresponding credit hours in each period of time were different, and the ranges of hours were large. The mean credit hours was 20.24 (SD = 6.21) for the 1st -year GGPA, 17.14 (SD = 7.64) for the 2nd-year GGPA, and 50.21 (SD = 27.24) for total GGPA. The distribution of credit hours for total GGPA was quite varied compared to 1st -year and 2nd-year GGPA. One possible reason for the differences in credit hours was that the sample included both masters’ and doctoral students, and doctoral students usually
studied for more years and earned more credits than masters’ students. Another possible reason was that some students had completed their course work but some others not
The three predictor variables in this study were GRE scores, UGPA, and TOEFL scores of international students. This study considered the GRE Verbal and Quantitative and total scores separately. The mean of GRE total score was 1166.99 (SD = 159.95, ranging from 650 to 1600). The GRE-V had a lower mean score, larger standard deviation, and larger range (M = 435.25, SD = 119.42, ranging from 200 to 800) than GRE-Q (M = 731.74, SD = 73.32, ranging from 320 to 800). Both GRE-V and GRE-Q
scores were on a scoring scale of 200 to 800. The mean UGPA was 3.41 (SD = .36) on a 0-4 scale. The mean of TOEFL total score was 236.14 (SD = 27.30), with a range of 130 to 293 on a 0-300 scale.
Table 2
Descriptive Statistics of the Predictors and the Criteria
Variables N M SD Minimum Maximum
Criteria 1.GGPA-1 1083 3.64 .32 2.00 4.0 (1st-year hours) (20.24) (6.21) (5) (48) 2.GGPA-2 1083 3.68 .33 1.67 4.0 (2nd-year hours) (17.14) (7.64) (1) (60) 3.GGPA-tot 1083 3.68 .27 2.44 4.0 (total hours) (50.21) (27.24) (9) (174) Predictors GRE-V 591 435.25 119.42 200 800 GRE-Q 591 731.74 73.32 320 800 GRE-tot 591 1166.99 159.95 650 1600 UGPA 398 3.41 .36 2.49 4.0 TOEFL 575 236.14 27.30 130 293
Pearson correlations were computed among all variables. As shown in Table 3, all correlations were significant at an α = .01 level except the one between TOEFL and UGPA which was significant at an α = .05 level. The correlation between 1st-year and 2nd-year GGPA was .56, and the two one-year GGPAs both correlated with total GGPA at .82 and .81, respectively, although these correlation coefficients were spurious. GRE-V
correlated with GRE-Q at .34, and these two subtest scores had a spurious correlation with GRE-tot at .90 and .71, respectively. The correlations between predictor variables, GRE and TOEFL scores, and criterion variables ranged from .17 to .28. In contrast, the correlations between UGPA and the three criterion variables ranged from .52 to .64. GRE scores had correlations with UGPA, ranging from .37 to .51, and with TOEFL, ranging from .23 to .54.
Table 3
Correlations among Variables
GGPA-1 GGPA-2 GGPA-tot GRE-V GRE-Q GRE-tot UGPA TOEFL
GGPA-1 1 GGPA-2 .56** 1 GGPA-tot .82** .81** 1 GRE-V .17** .19** .21** 1 GRE-Q .22** .18** .26** .34** 1 GRE-tot .23** .22** .28** .90** .71** 1 UGPA .64** .52** .64** .37** .51** .50** 1 TOEFL .15** .17** .22** .54** .23** .51** .50* 1 * p < .05, ** p < .01
Difference of Descriptive Statistics of Variables by Alien Status and by Degree Level
The means and standard deviations of variables for American and international students were presented in Table 4. In order to see the significance of the difference in means between two groups, independent sample t tests were conducted. As mentioned before, because the majority of students who had UGPA were American students and