Journal of Economic and Administrative Sciences
Efficiency analysis of UAE banks using data envelopment analysisTamer Mohamed Shahwan Yousef Mohammed Hassan
Article information:
To cite this document:
Tamer Mohamed Shahwan Yousef Mohammed Hassan, (2013),"Efficiency analysis of UAE banks using data envelopment analysis", Journal of Economic and Administrative Sciences, Vol. 29 Iss 1 pp. 4 - 20 Permanent link to this document:
http://dx.doi.org/10.1108/10264111311319204 Downloaded on: 21 February 2017, At: 04:12 (PT)
References: this document contains references to 62 other documents. To copy this document: [email protected]
The fulltext of this document has been downloaded 620 times since 2013*
Users who downloaded this article also downloaded:
(2013),"Efficiency of Islamic and conventional banks in Malaysia", Journal of Financial Reporting and Accounting, Vol. 11 Iss 1 pp. 92-107 http://dx.doi.org/10.1108/JFRA-03-2013-0011
(2007),"The efficiency of Islamic banking industry in Malaysia: Foreign vs domestic banks", Humanomics, Vol. 23 Iss 3 pp. 174-192 http://dx.doi.org/10.1108/08288660710779399
Access to this document was granted through an Emerald subscription provided by emerald-srm:523001 []
For Authors
If you would like to write for this, or any other Emerald publication, then please use our Emerald for Authors service information about how to choose which publication to write for and submission guidelines are available for all. Please visit www.emeraldinsight.com/authors for more information.
About Emerald www.emeraldinsight.com
Emerald is a global publisher linking research and practice to the benefit of society. The company manages a portfolio of more than 290 journals and over 2,350 books and book series volumes, as well as providing an extensive range of online products and additional customer resources and services.
Emerald is both COUNTER 4 and TRANSFER compliant. The organization is a partner of the Committee on Publication Ethics (COPE) and also works with Portico and the LOCKSS initiative for digital archive preservation.
*Related content and download information correct at time of download.
Efficiency analysis of UAE banks
using data envelopment analysis
Tamer Mohamed Shahwan and Yousef Mohammed Hassan
Department of Accounting, Finance and Banking,
Al Ain University of Science and Technology, Al Ain, United Arab Emirates
Abstract
Purpose– The current study aims to explore and measure the profitability, marketability, and social disclosure efficiency of UAE banks using a nonparametric frontier method – data envelopment analysis (DEA).
Design/methodology/approach– In order to estimate the relative efficiency of the Emirati banks based on three different dimensions: profitability, marketability and social disclosure, a sample of 20 listed Emirati banks in 2009 is first selected. Second, a disclosure index to measure the extent of their social disclosure is developed and utilized. Third, the input-oriented version of DEA model is deployed to estimate their technical and scale efficiency.
Findings– Based on nonparametric Wilcoxon signed rank test, paired-differencettest and sign test, this study reports significant evidence that the UAE banks are performing much better in profitability and social disclosure activities than marketability activities. The results also provide additional evidence regarding the positive relation observed between the performance of social disclosure and profitability performance.
Research limitations/implications – The sample is small, although it includes all relevant Emirati banks. Moreover, follow-up research using panel data derived from the UAE banking sector are required to test and generalize the current results.
Originality/value – The paper is original in its approach by introducing social disclosure as a new empirical dimension to the literatures of banking efficiency analysis using DEA.
Keywords Bank efficiency, Profitability efficiency, Marketability efficiency, Social disclosure efficiency, DEA, Process efficiency, Banks, Data analysis
Paper type Research paper
Introduction
The financial services sector, particularly, the banking system is one of the most complex industries in the world. It plays a vital role in the economic development by diversifying growth’s elements of any country. In 2009, the contribution of the financial services and insurance sector to the UAE GDP is 5.8 percent (Statistics Centre-Abu Dhabi (SCAD), 2010). Over the last years, many of significant challenges faced both global and UAE banking sector, especially in the wake of the credit crunch of 2007. These challenges include deregulation concerning the establishment, operation, and supervision of credit institutions; the accelerating improvements in computer and telecommunication technologies; and growing competition from both global and domestic banks. According to KAMCO Research & UAE National Bureau of Statistics (2011), the financial services sector contributions to the UAE GDP fell down from 7.1 percent in 2007 to 6.7 percent in 2008 as a result of the recent financial crisis where profitability level and credit conditions shrunk considerably. Moreover, the future expansion within the UAE banking sector due to the government’s demonstrated commitment to implement its strategy, namely known as Abu Dhabi Economic Vision 2030 will pose further opportunities and threats to the UAE banks regarding the improvement of their efficiencies.
The current issue and full text archive of this journal is available at
www.emeraldinsight.com/1026-4116.htm
Journal of Economic and Administrative Sciences Vol. 29 No. 1, 2013 pp. 4-20
rEmerald Group Publishing Limited 1026-4116
DOI 10.1108/10264111311319204
4
JEAS
29,1
Measuring the efficiency of banking industry has attracted considerable attention by academics, policymakers, and other market participants all over the world (e.g. Yue, 1992; Tahir et al., 2009). However, these studies ignored several areas related to banking efficiency analysis. First of all, very few studies (e.g. Al Tamimi and Lootah, 2007; Avkiran, 2009) have only addressed the operational and profitability efficiency of the UAE banks and ignored the other indicators of the efficiency such as marketability and social disclosure efficiencies. Seiford and Zhu (1999) and Luo (2003) show that marketability efficiency is a vital indicator as well as the profitability efficiency since the real value of a bank should be defined by the current stock market. Second, greater disclosure enhances stock market liquidity thereby reducing cost of equity capital through reducing information asymmetry between management and fund providers (Botosan, 1997; Christensenet al., 2008; Franciset al., 2008; Gao, 2008). In this context, the second stream of environmental disclosure research suggests that a significantly negative association between disclosure and cost of equity capital may be extended to corporate voluntary social reporting. Disclosing information to show socially responsible behaviors can help companies avoid government regulation, gain legitimacy, and reduce compliance costs (Dhaliwalet al., 2009). Furthermore, consumers and investors who care about social and environmental issues prefer socially responsible corporations thereby improving their sales level and financial performance (Lev et al., 2010; Richardson and Welker, 2001). Accordingly, this study contributes to this literature by extending the efficiency analysis of the UAE banks based on the following three dimensions: profitability, marketability, and social disclosure efficiencies. The remainder of this paper proceeds as follows: the following briefly reviews the literature on data envelopment analysis (DEA) used in banking efficiency analysis. Third section describes procedures used to estimate the level of the UAE banks’ social disclosure. Fourth section presents the DEA that is applied in this study. Fifth section discuses the data and empirical results; and the final section summarizes the study’s conclusions, implications, and suggestions for future research.
DEA in banking efficiency analysis
As financial managers scramble to compete in highly chaotic environment, they must do so by achieving good performance which is a cornerstone for the survival of any organization (March and Sutton, 1997; Amadoet al., 2012). Since a good performance is concerned with high efficiency and effectiveness, much effort has been devoted over the past decades among researchers to estimate the level of efficiency with which banks work to their competitors. Most of this work has focussed on the USA and the UK. The literatures of the bank efficiency measurement can be classified into different categories based on the method of analysis, the level of data, and the dimensions of performance ( Johnes, 2006; Paradiet al., 2011). Regarding the method of analysis, there are numerous techniques used to measure bank operational efficiency such as ratios (Heizer and Render, 2006; Schweser and Temte, 2002) and regression analysis (Hensel, 2003). However, those traditional techniques have become unsatisfactory analysis methods due to the following inherent limitations. First of all, regression analysis compares efficiency with average performance rather than with the best performance (Colbertet al., 2000). Second, regression analysis as a parametric approach which requires the prespecification of a production function restricts the usefulness of this model in capturing real function (Sexton, 1986). Additionally, under the financial ratio analysis, it is impossible to determine a single performance score of different multiple ratios objectively (Colbertet al., 2000). In recent years, two competing frontier efficiency approaches – the stochastic frontier approach (SFA) and DEA – have been proposed as alternative
5
Efficiency
analysis of
UAE banks
techniques for measuring the relative efficiency of any financial institution against the group’s observed best practice. A review of the SFA applications in the banking industry can be found in Kumbhakar and Lovell (2000).
DEA as a non-parametric technique was first put forward by Charnes, Cooper, and Rhodes in 1978. DEA computes a comparative ratio of weighted outputs to weighted inputs for each decision-making unit (DMU) using linear programming. The popularity of DEA in measuring the relative efficiency is due to several distinguishing features that make them a valuable and attractive tool for performance analysis. First, DEA is a methodology directed to frontiers rather than central tendencies (Cooperet al., 2000). Second, DEA as a non-parametric technique does not need to make distributional assumptions regarding the residuals (Abbott and Doucouliagos, 2003). Thus, DEA rather than regression analysis is the ideal tool to fit the data. Second, multiple inputs and outputs can be used in the DEA model without any concern regarding the relative importance of each input and output (Colbert et al., 2000). Third, in comparison to traditional methods based on predefined model structures such as the SFA, DEA has the advantage in avoiding the need to make prior assumptions regarding the functional form of the best practice frontier (Cooperet al., 2000). Ruggiero (2007) shows that the SFA model does not produce better results than DEA.
There are ample DEA studies in exploring banking efficiency (e.g. Seiford and Zhu, 1999; Chenet al., 2008). For instance, Luo (2003) evaluates both the commercial banks’ marketability and profitability efficiency. He measured profitability efficiency based on three inputs (employee, total assets, and equity) and two outputs (revenue and profits), while the marketability is based on two inputs (revenue and profits) and three outputs (market value, stock price, and earnings per share (EPS)). Based upon a sample of 245 large banks, Luo concludes that 14 percent of banks with higher level of profitability performance have lower level of marketability performance. Tahir et al. (2009) use DEA to estimate the overall, pure technical and scale efficiencies for 22 Malaysian commercial banks. The results suggest that domestic banks are relatively more efficient than foreign banks. Moreover, inefficiency of domestic banks is attributed to pure technical inefficiency rather than scale inefficiency. On the other hand, inefficiency of foreign banks is attributed to scale inefficiency rather than pure technical inefficiency. Additionally, the technical efficiency of the Japanese banks from 2000 to 2007 based on both of desirable and undesirable output is analyzed. The results indicate that non-performing loans as undesirable output remain a significant burden for banks’ performance (Barroset al., 2012).
The voluntary social disclosure index
The corporate social and environmental reporting is one of the main areas that witnessed an increasing attention from accounting researchers. Although this sort of disclosure has been regulated and has become compulsory in some countries, especially the developed nations (e.g. UK, France, and Denmark), disclosing this kind of information is still not required from firms in other countries and reporting on these themes depends on management decision.
The investigation of the related voluntary social disclosure literature shows that there is no one generally accepted definition for the concept of corporate social reporting provided by researchers and organizations (e.g. Grayet al., 1988; Mathews and Perera, 1991; European Commission, 2001). Despite the different definitions offered by different authors and organizations for the corporate social disclosure concept, the
6
JEAS
29,1
information included in this type of disclosure may be divided into five main themes: environment, energy, community involvement, human resources, and product- and consumer-related information (Epstein and Freedman, 1994; Hackston and Milne, 1996; Williams and Pei, 1999; Deegan, 2002).
To measure the efficiency of Emirati banks based on their social disclosure, there is a need to develop a suitable social and environmental disclosure index. In the current section we describe the construction of our social disclosure index and the scoring procedures of the Emirati banks’ social disclosure level. Since there is no agreement regarding the appropriate items that have to be included in a social disclosure index, an extensive review of prior studies in emerging economies in general (e.g. Gaoet al., 2005; Haniffa and Cooke, 2005) and within the context of Arab countries (e.g. Naseret al., 2006; Rizk et al., 2008; Menassa, 2010) in particular is conducted to develop a list of social and environmental items that can be included in a disclosure index. This review of the relevant corporate social disclosure literature had led to the development of a 38 item that may be voluntary disclosed by Emirati listed banks. For the assessment of the designed index validity, the index is tested by the researchers on a number of listed Emirati banks’ annual reports. Moreover, it is also assessed by an external accounting professor with special interest in corporate social practices in the Arab countries. In light of the researchers’ test and the expert’s assessment, some of the 38 items are excluded as they either are not disclosed by any of the banks or irrelevant. Accordingly, the constructed disclosure index for the current study is adjusted to include 26 items. These items include information about environment, energy, human resources, product and customer, community, and other social and environmental disclosure (e.g. zakatable amount and/or beneficiaries, employee communication, and expenditure on research and development). Moreover, the Cronbach’s coefficientais estimated to assess the internal consistency of the selected items in our disclosure index. The value ofavaries between 0 and 1. The higher the coefficient is, the more reliable the measure is. Nunnaly (1978) shows that 0.7 can be considered an acceptable reliability coefficient. In the current study, the coefficienta is found to be 0.73 for all categories which indicates a reasonable degree of internal consistency among the selected items in our designed index. Table I summarizes the elements of the social disclosure index. Regarding the scoring scheme implemented in the constructed social and environmental disclosure index, there are typically two basic approaches: the weighted vs the unweighted disclosure index. Many existing empirical research (e.g. Wallaceet al., 1994; Chen and Jaggi, 2000; Archambault and Archambault, 2003) tend to support the use of unweighted index approach. Moreover, the studies done by Wallace and Naser (1995) and Coombs and Tayib (1998) show that only little difference has been found under both unweighted and weighted indices. Accordingly, the unweighted disclosure index approach is adopted to measure the extent of the social and environmental disclosure by Emirati listed banks. Under the unweighted social disclosure method, each item is considered as a dichotomous variable. If an information item has been disclosed in the bank’s annual report, then “1” will be assigned, otherwise, it will be “0.” Accordingly, the total social disclosure (TSD) score for a bank (j) is measured as follows:
TSDj¼ Pn i¼1Scoreij Pn i¼1maxScorei ð1Þ
7
Efficiency
analysis of
UAE banks
where max Scorei is the maximum score awarded to any bank for all categories (i¼1,y, 6).Scoreijreflects the total items a bank actually disclosed.
The DEA methodology
Specification of DEA models
DEA assigns a score of 1 to an efficiently unit when they are compared with other relevant units. A score o1 imply that a linear combination of other units from the sample could produce the same vector of outputs using a smaller vector of inputs. The efficiency can be measured as follows (Cooperet al., 2011):
Max h0ðu;vÞ ¼ X r uryr0= X i vixi0 Subject to X r uryrj= X i vixijp1 forj¼1;. . .;n;
ur;viX0 for alliandr
ð2Þ
(A) Environmental information 1. Environmental policies
2. Environmental protection and pollution prevention 3. Efforts to reduce gas emissions
4. Conservation of natural resources 5. Recycling plant of waste products
6. Environment’s awards or certificates (e.g. ISOs 14000) (B) Energy
1. Conservation of energy 2. Energy efficiency of products (C) Human resources
1. Number of employees
2. Management relationships with employees to improve job satisfaction 3. Training and development
4. Commitment to emiratization strategy 5. Working conditions
6. Health and safety arrangements (D) Product and customers
1. Product (service) quality information 2. Product safety information
3. Customer satisfaction
4. Quality’s reward (e.g. ISO 9000, prizes and awards received) (E) Community-related disclosures
1. Donations and charity contributions 2. Community relations
3. Seminars, conferences, and educational institutions 4. Support and sponsorship programs
5. Humanitarian aid programs
6. Preservation national culture and tradition 7. Support for people with special needs (F) Other social and environmental disclosure Table I.
Social disclosure index
8
JEAS
29,1
where the ur’s and vi’s are the variables of the problem. The yr0’s andxi0’s are the observed output and input values. To solve this model, we opt to the equivalent linear programming transformation as illustrated in the following equations:
Minye X m i¼1 si þX s r¼1 sþr ! Subject to Xn j¼1 xijljþsi ¼yxi0 i¼1;2;. . .;m; Xn j¼1 yrjljsþr ¼yr0 r¼1;2;. . .;s; ljX0 j¼1;2;. . .;n ð3Þ
whereyis efficiency score. It reflects the radial distance from the estimated production frontier to the DMU under consideration. The value of this score is between 0 and 1.lj are the optimal weights of referenced units for unitj;xijis the value of theith input to unitj;yrjis the value of therth output from unitj;srþ andsiare output and input slacks, respectively, andeis non-archimedean element that is smaller than any positive number and 40. The DEA model illustrated in Equation (3) is referred to CCR[1] model in the form of input-oriented version. In this context, the CRS can be converted into BCC[2] model if the constraint Sjn¼1lj¼1 is adjoined. BCC model can then be written as follows (Cooperet al., 2011):
Minye X m i¼1 si þX s r¼1 sþr ! Subject to Xn j¼1 xijljþsi ¼yxi0 i¼1;2;. . .;m; Xn j¼1 yrjljsþr ¼yr0 r¼1;2;. . .;s; ljX0 j¼1;2;. . .;n X lj¼1 ð4Þ
Specification of DEA inputs and outputs
The selection of appropriate inputs and outputs is the most important step in measuring the relative efficiency of banks using DEA (Yue, 1992). Till today, there is no clear agreement over the appropriate inputs and outputs for measuring banks’ efficiency (Avkiran, 2011). Generally, there are two different perspectives for specifying the proper inputs and outputs: the production approach and the intermediation approach (e.g. Yue, 1992; Sathye, 2001; Luo, 2003; Avkiran, 2011). Under the production approach, banks can be defined as producers of services by processing deposits and loans (Seiford and Zhu, 1999). On the other hand, the intermediation approach views
9
Efficiency
analysis of
UAE banks
banks as financial intermediaries that focus on borrowing funds from depositors and lending those funds to deficit units (Tahir et al., 2009). In order to improve the evaluation of Emirati banking performance we design a performance criterion that will enable banks’ managers to determine where improvements can be made. The study of Luo (2003) serves as the basis for our design approach. Specifically, we adapt the production approach in defining inputs and outputs for banks. Figure 1 depicts the three dimensions of the UAE banking efficiency model.
The first dimension is concerned with measuring the profitability efficiency based on three inputs (total deposits, total operating expenses, and leverage) and two outputs (return on assets (ROA) and return on equity (ROE)). For measuring the marketability efficiency, there are two inputs (ROA and ROE) and three outputs (price/earnings (P/E) ratio and EPS). In order to measure social disclosure efficiency, six inputs are used. The first input is the existence of audit committee. The extent of corporate social responsibility (CSR) disclosure is expected to be higher for firms that have an audit committee. The existence of an audit committee might be seen as a monitoring mechanism that improves the quality of corporate reporting (McMullen, 1996; Barako
et al., 2006), reduces the information asymmetry (Chung et al., 2004), and reduces irregularities and unreliable disclosure (McMullen, 1996). The second input is the proportion of Sheikhs[3] on corporate board. Following Graham (1991) and Spears (2010) who argued that “servant leader” recognizes his social responsibility to serve his followers, it is reasonable to expect that the existence of a Sheikh as a “servant leader” in the Emirati banks’ board of directors will emphasize a company’s social and charitable role and promote the culture of donation and the concept of CSR toward the community. The third input is the institutional ownership[4]. That is, corporations with high percentage of shares held by institutional investors, who have strong incentives to monitor these companies’ disclosure practices, are more likely to voluntarily disclose information to assure those investors and meet their expectations, and thus, reduce agency costs (Barakoet al., 2006; Naseret al., 2006). The fourth input is the government ownership[5] which has a vital impact on the corporation’s social disclosure, particularly in the absence of labor unions in the UAE. Naseret al.(2006) argues that corporations with high proportion of shares held by government are expected to offer welfare and training programs and pension plans to enhance its employees’ working conditions. Moreover, such companies are more likely to observe environmental issues
ROE Total deposits Profitability efficiency Scores of social disclosure Institutional ownership percentage Marketability efficiency Sheikh percentage Total operating expenses Leverage Social disclosure efficiency ROA EPS P/E Governmental ownership percentage Existence of audit committee Figure 1. Banking profitability, marketability, and social disclosure efficiencies model
10
JEAS
29,1
in its annual reports to reflect its role in the society and to present itself as a good example for other firms in the country. Finally, most of the recent quantitative studies (e.g. Knoepfel, 2001; Rufet al., 2001; Van de Veldeet al., 2005) support the existence of positive relationship between corporate social performance and corporate financial performance. Hence, EPS and P/E ratios are selected as proxies of the bank financial performance and to be used as inputs to measure the bank’s social disclosure, while the output of the banks’ social disclosure model is the computed social disclosure scores of each bank which previously illustrated in “The voluntary social disclosure index”.
Data and empirical analysis
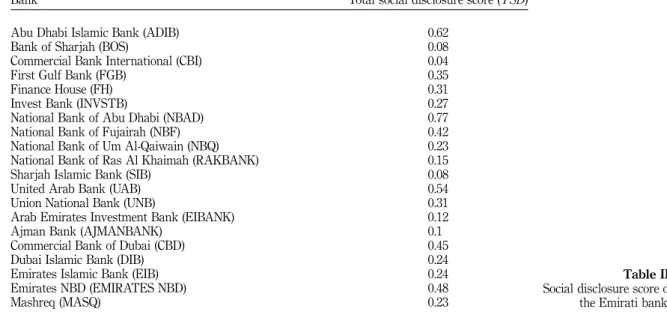
To compute the social disclosure scores and evaluate the relative efficiency of Emirati banks using DEA, data set including all of the 2009 listed Emirati banks’ annual reports is used[6]. It consists of 20 out of 23 listed banks in UAE as banks with negative values are ignored[7]. Table II represents the computed social disclosure score for each of the Emirate banks where the lowest score is obtained by the Commercial Bank International (CBI). However, the highest social disclosure score is obtained by National Bank of Abu Dhabi (NBAD) followed by Abu Dhabi Islamic Bank (ADIB), United Arab Bank (UAB), and so on. Back to the DEA analysis of the data set, the efficiency analysis of the selected banks is conducted by using a computer program DEAP where both of CCR and BCC models are used to evaluate the performance of the UAE banks from three different dimensions: profitability, marketability, and social disclosure. The input-oriented version of DEA model is selected in the current study as the Emirati banks are governed under the direct supervision of the UAE central bank according to the Union Law No. 10 of 1980. This implies that the differences in product offerings between the competing banks are often limited. Table III reports the descriptive statistics of the inputs and outputs in each stage of DEA analysis. Most of variables’ scores varied as indicated by the minimum and maximum values. This
Bank Total social disclosure score (TSD)
Abu Dhabi Islamic Bank (ADIB) 0.62
Bank of Sharjah (BOS) 0.08
Commercial Bank International (CBI) 0.04
First Gulf Bank (FGB) 0.35
Finance House (FH) 0.31
Invest Bank (INVSTB) 0.27
National Bank of Abu Dhabi (NBAD) 0.77
National Bank of Fujairah (NBF) 0.42
National Bank of Um Al-Qaiwain (NBQ) 0.23
National Bank of Ras Al Khaimah (RAKBANK) 0.15
Sharjah Islamic Bank (SIB) 0.08
United Arab Bank (UAB) 0.54
Union National Bank (UNB) 0.31
Arab Emirates Investment Bank (EIBANK) 0.12
Ajman Bank (AJMANBANK) 0.1
Commercial Bank of Dubai (CBD) 0.45
Dubai Islamic Bank (DIB) 0.24
Emirates Islamic Bank (EIB) 0.24
Emirates NBD (EMIRATES NBD) 0.48
Mashreq (MASQ) 0.23
Table II.
Social disclosure score of the Emirati banks
11
Efficiency
analysis of
UAE banks
grants credibility to the findings of the study as it covers all the banks listed in Emirati stock markets with different features. The table reveals that the mean ofTSDscore is only 30 percent of the standard social disclosure items that formed the index. It ranges between 4 and 77 percent of the expected number of items that formed the index. Over the full sample, ROA ranged from 0.006 to 4.24 percent, with a mean of 1.89 percent. Moreover, the mean of ROE is about 11.3 percent, ranging from a high of nearly 26 percent to a low of 6.6 percent. The statistics on marketability measures, namely EPS and P/E, also showed a considerable dispersion in the scores. While the EPS ranged from 0 to 6.21, with a mean of 0.7, the P/E ratio varied from 4.9 to 817.4 percent with an average of 96.94 percent. With respect to leverage, it ranged from 0.48 to 0.90, with a mean of 0.821. This result is expected as long-term debt is usually a significant portion of the capital structure of banks. In 2009, the operating expenses of Emirati banks ranged from 18,562,313 to 7,249,776,000 Emirati Dirhams. Concerning corporate governance variables, Table III shows that the existence of corporate audit committee variable ranged from 0 to 1, where 1 indicates that the company has audit committee, 0 means that the audit committee does not exist. The mean of existence of audit committee is only about 0.35 revealing that the most of the Emirati banks are still with no audit committees. The ratio of Sheikh on Emirati companies’ boards ranged from 0 to 0.4286, with a mean of 0.1359 for the whole population.
Turning to ownership structure variables, Table III also indicates that while governmental ownership ranged from 0 to 0.71, with a mean of 0.237 for the whole population, the proportion of institutional ownership also ranged from 0.0564 to 0.9985, with a mean of 0.31. This mean might reflect the existence of a number of investment companies which have substantial ownership in listed banks.
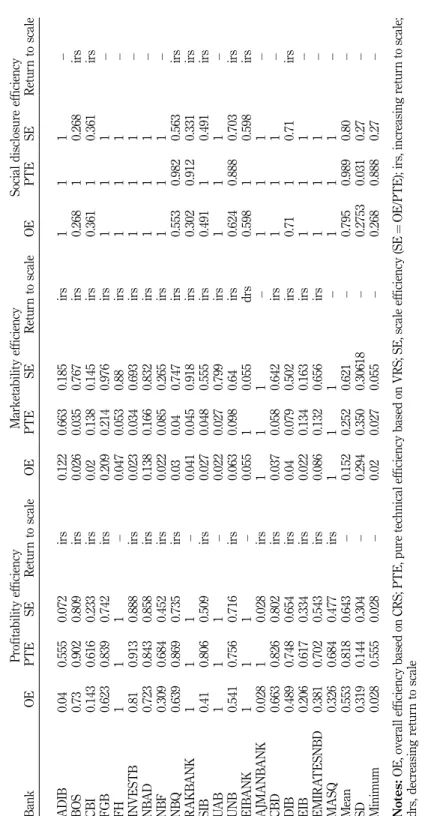
Back to the DEA analysis of our data set where the overall, pure technical efficiency and scale efficiency scores achieved by Emirati banks along with the direction of return to scale are shown in Table IV. The approach taken was to consider banks efficient if their relative efficiency ratios equaled 1 and regarded as inefficient if they obtained a relative efficiency ratio o1. At the first stage of our analysis, bank profitability efficiency is measured. Our results indicate that five banks are deemed as efficient while 15 banks are rated as inefficient. The results also indicate that the average pure technical efficiency score for the banks is 81.8 percent under the assumption of VRS, which is higher than the average efficiency score of overall technical efficiency under the CRS assumption. On the other hand, the average score of
Variable(s) Mean SD Minimum Maximum
TSDscore 0.3015 0.196 0.04 0.77
ROA 0.0189 0.0131 0.0006 0.0424
ROE 0.1129 0.0662 0.0011 0.2596
EPS 0.7125 1.386934 0 6.21
P/E 96.936 234.16 4.91 817.41
Total deposits 39,295,657,350 52,785,198,299 518,248,000 2.11157Eþ11 Operating expenses 1,043,340,066 1,642,713,528 18,562,313 7,249,776,000 Leverage 0.821 0.094751753 0.48 0.9 Institutional ownership 0.31 0.252476362 0.0564 0.9985 Governmental ownership 0.237 0.235910331 0 0.71 Sheikh percentage 0.135965 0.144465903 0 0.4286 Audit committee 0.35 0.489360485 0 1 Table III. Descriptive statistics of variables used to measure the efficiency of Emirati banks
12
JEAS
29,1
Pr ofita bility ef ficiency Mar keta bility ef ficiency Social disclosu re ef ficiency Bank OE PTE SE R etu rn to scale OE PTE SE R etur n to scale OE PTE SE R etur n to scale ADIB 0.04 0.555 0.072 irs 0.122 0.663 0.185 irs 1 1 1 – BOS 0.73 0.902 0.809 irs 0.026 0.035 0.767 irs 0.268 1 0.268 irs CBI 0.143 0.616 0.233 irs 0.02 0.138 0.145 irs 0.361 1 0.361 irs FGB 0.623 0.839 0.742 irs 0.209 0.214 0.976 irs 1 1 1 – FH 1 1 1 – 0.047 0.053 0.88 irs 1 1 1 – INVESTB 0.81 0.913 0.888 irs 0.023 0.034 0.693 irs 1 1 1 – NB AD 0.723 0.843 0.858 irs 0.138 0.166 0.832 irs 1 1 1 – NBF 0.309 0.684 0.452 irs 0.022 0.085 0.265 irs 1 1 1 – NBQ 0.639 0.869 0.735 irs 0.03 0.04 0.747 irs 0.553 0.982 0.563 irs RAKB ANK 1 1 1 – 0.041 0.045 0.918 irs 0.302 0.912 0.331 irs SIB 0.41 0.806 0.509 irs 0.027 0.048 0.555 irs 0.491 1 0.491 irs U A B 1 1 1 – 0.022 0.027 0.799 irs 1 1 1 – UNB 0.541 0.756 0.716 irs 0.063 0.098 0.64 irs 0.624 0.888 0.703 irs EIB ANK 1 1 1 – 0.055 1 0.055 drs 0.598 1 0.598 irs AJMANB ANK 0.028 1 0.028 irs 1 1 1 – 1 1 1 – CBD 0.663 0.826 0.802 irs 0.037 0.058 0.642 irs 1 1 1 – DIB 0.489 0.748 0.654 irs 0.04 0.079 0.502 irs 0.71 1 0.71 irs EIB 0.206 0.617 0.334 irs 0.022 0.134 0.163 irs 1 1 1 – EMIRA TESNBD 0.381 0.702 0.543 irs 0.086 0.132 0.656 irs 1 1 1 – MASQ 0.326 0.684 0.477 irs 1 1 1 – 1 1 1 – Me an 0.553 0.818 0.643 – 0.152 0.252 0.621 – 0.795 0.989 0.80 – SD 0.319 0.144 0.304 – 0.294 0.350 0.30618 – 0.2753 0.031 0.27 – Minimum 0.028 0.555 0.028 – 0.02 0.027 0.055 – 0.268 0.888 0.27 – Notes: OE, ov erall ef ficiency based on CRS; PTE, pure tech nical ef ficiency based on VRS; SE, scale ef ficiency (SE ¼ OE/PTE); irs, incr easing retu rn to scale; drs, decr easing retu rn to scale Table IV.
Technical and scale efficiency scores for Emirati banks
13
Efficiency
analysis of
UAE banks
scale efficiency is 64.3 percent which means that bank profitability inefficiency is attributed to scale inefficiency. In a similar way, for bank marketability efficiency, the average pure technical efficiency score for banks is 25.2 percent which is less than the average score of scale efficiency 62.1 percent. This implies that bank marketability inefficiency is attributed to pure technical inefficiency rather than scale inefficiency. Furthermore, the results suggest that the average of profitability efficiency is higher than the average of marketability efficiency based on all mentioned indices. At the last stage of the analysis, DEA is conducted on the entire pool of Emirati banks to measure their social disclosure efficiency. As seen in Table IV, the average pure technical efficiency score for banks 98.9 percent is higher than the average score of scale efficiency 80.1 percent. So, the social disclosure inefficiencies are attributed to scale inefficiency rather than pure technical inefficiency. The distribution of the pure technical efficiency scores related to profitability, marketability, and social disclosure of Emirati banks is illustrated in Table V within different score interval. As seen in Table V, our findings obviously indicate that a majority of Emirati banks are efficient regarding the profitability and social disclosure rather than marketability. Our results also turn out that “good” environmental performance can be associated with “good” profitability performance. These findings are consistent with the results of Hossain
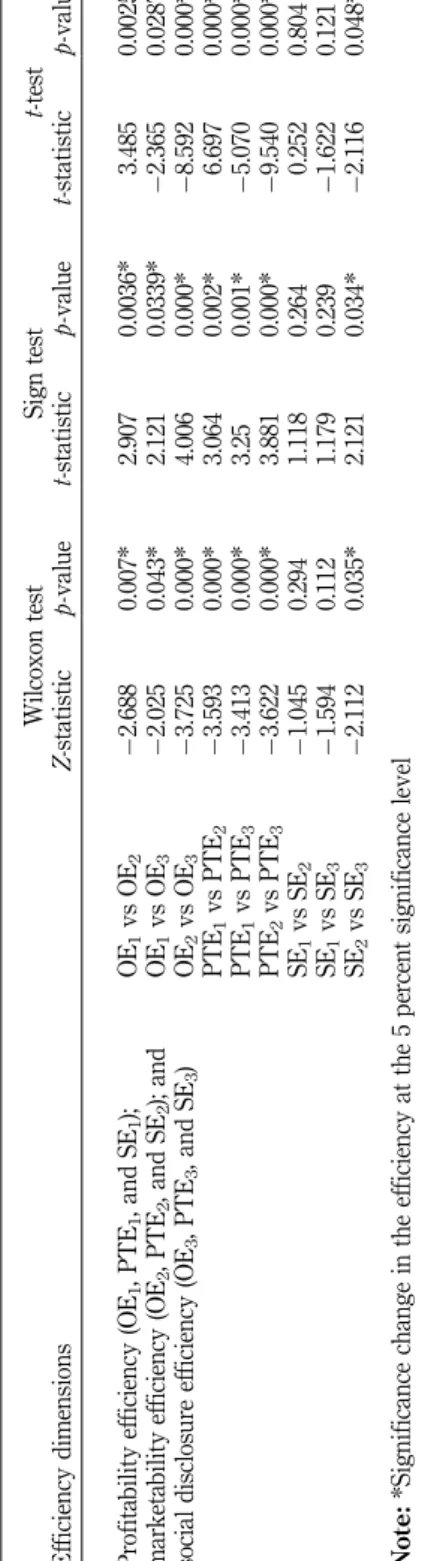
et al. (2006) that there is significantly positive relation between profitability and environmental social disclosure. Having discussed the profitability, marketability, and social disclosure efficiency results, attention should now be turned to determine whether there is significant difference between scores of technical and scale efficiency across the three DEA stages. The results of Wilcoxon signed-rank test, sign test, and
t-test are shown in Table VI. These results further provide statistically significant evidence of the low level of marketability efficiency inside Emirati banks compared to profitability and social disclosure efficiencies.
Conclusions
In this study we explore the usefulness of DEA to evaluate the relative efficiency of UAE banks using three different dimensions (profitability, marketability, and social disclosure). Hence, this study introduces new empirical dimension to the literatures of evaluating the banking efficiency. In contrast to studies that only measure the efficiency of banks based on profitability and marketability performance, this study adopts additional dimension: the social disclosure performance. Six categories of social disclosure information, referring to environmental issues, energy-related issues, human resources issues, products and customers issues, community-related disclosure, and other social items are analyzed. Our primary findings imply that the majority of Emirati banks obtain high level of profitability and social disclosure efficiency. Bank’s efficiency interval Banks (%) based on profitability efficiency Banks (%) based on marketability efficiency
Banks (%) based on social disclosure efficiency 0o0.6 0.05 0.8 0 0.6o0.8 0.35 0.05 0 0.8o0.85 0.15 0 0 0.85o0.90 0.1 0 0.05 0.90o0.95 0.1 0 0.05 0.95-1 0.25 0.15 0.9 Table V. Distribution of pure technical efficiency scores, Emirati banks
14
JEAS
29,1
W ilcox on test Sign test t -test Ef ficiency dimensions Z -statistic p -value t -statistic p -value t -statistic p -value Pr ofita bility ef ficiency (OE 1 , PTE 1 , and SE 1 ); mar keta bility ef ficiency (OE 2 , PTE 2 , and SE 2 ); and social disclosu re ef ficiency (OE 3 , PTE 3 , and SE 3 ) OE 1 vs OE 2 2.688 0.007* 2.907 0.0036* 3.485 0.0025* OE 1 vs OE 3 2.025 0.043* 2.121 0.0339* 2.365 0.0287* OE 2 vs OE 3 3.725 0.000* 4.006 0.000* 8.592 0.000* PTE 1 vs PTE 2 3.593 0.000* 3.064 0.002* 6.697 0.000* PTE 1 vs PTE 3 3.413 0.000* 3.25 0.001* 5.070 0.000* PTE 2 vs PTE 3 3.622 0.000* 3.881 0.000* 9.540 0.000* SE 1 vs SE 2 1.045 0.294 1.118 0.264 0.252 0.804 SE 1 vs SE 3 1.594 0.112 1.179 0.239 1.622 0.121 SE 2 vs SE 3 2.112 0.035* 2.121 0.034* 2.116 0.048* Note: *Significance change in the ef ficiency at the 5 p er cent significance leve l Table VI.
Test results of the difference between technical and scale efficiency across the three DEA stages, Emirati banks
15
Efficiency
analysis of
UAE banks
However, these banks are inefficient in performing marketability-related activities. These results will attract the attention of the policymakers in Emirati banks to enhance their activities for generating more market value. This study also indicates that the majority of banks with high profitability efficiency tend to have high disclosure efficiency. However, it is not clear why some banks with low profitability efficiency level tend to adequately disclose social information. Therefore, a comprehensive study is needed to further investigate the relation between profitability and social disclosure efficiency.
As a suggestion for further improvement in the evaluation of banking efficiency, it is worthwhile to extend the presented model by applying it overtime using DEA window analysis. Moreover, a sensitivity analysis can also be performed in order to determine the causes of inefficiency in the Emirati banks.
Notes
1. The CCR model is referred to the constant returns to scale (CRS) model which has been developed by Charneset al.(1978).
2. The BCC model is also known as the variable return to scale (VRS) model which has been developed by Bankeret al.(1984).
3. A “Sheikh” is an Arabic title of respect and honor which is commonly used to designate a tribal leader, an Islamic scholar, or sometimes to a person who has financial or political influence.
4. The institutional ownership is measured by the percentage of common shares held by institutional investors.
5. The government ownership of the firm is measured as a percentage of common shares owned by government.
6. The annual balance sheets and income statements are obtained from Abu Dhabi Securities Exchange and Dubai Financial Market.
7. Abu Dhabi Commercial Bank, Amlak Finance, and Tamweel are excluded from our data set due to the negative values of their ROE, ROA, and EPS in 2009.
References
Abbott, M. and Doucouliagos, C. (2003), “The efficiency of Australian universities: a data envelopment analysis”,Economics of Education Review, Vol. 22 No. 1, pp. 89-97. Al Tamimi, H. and Lootah, A. (2007), “Evaluating the operational and profitability efficiency
of a UAE-based commercial bank”,Journal of Financial Services Marketing, Vol. 11 No. 4, pp. 333-348.
Amado, C.A.F., Santos, S.P. and Marques, P.M. (2012), “Integrating the data envelopment analysis and the balanced scorecard approaches for enhanced performance assessment”,Omega – International Journal of Management Science, Vol. 40 No. 3, pp. 390-403.
Archambault, J.J. and Archambault, M.E. (2003), “A multinational test of determinants of corporate disclosure”,The International Journal of Accounting, Vol. 38 No. 2, pp. 173-194. Avkiran, N.K. (2009), “Opening the black box of efficiency analysis: an illustration with UAE banks”,Omega – International Journal of Management Science, Vol. 37 No. 4, pp. 930-941. Avkiran, N.K. (2011), “Association of DEA super-efficiency estimates with financial ratios: investigating the case for Chinese banks”,Omega – International Journal of Management Science, Vol. 39 No. 3, pp. 323-334.
Banker, R., Charnes, A. and Cooper, W.W. (1984), “Some models for estimating technical and scale inefficiencies in data envelopment analysis”,Management Science, Vol. 30 No. 9, pp. 1078-1092.
16
JEAS
29,1
Barako, D.G., Hancock, P. and Izan, H.Y. (2006), “Factors influencing voluntary corporate disclosure by Kenyan companies”,Corporate Governance: An International Review, Vol. 14 No. 2, pp. 107-125.
Barros, C.P., Managi, S. and Matousek, R. (2012), “The technical efficiency of the Japanese banks: non-radial directional performance measurement with undesirable output”, Omega – International Journal of Management Science, Vol. 40 No. 1, pp. 1-8.
Botosan, C.A. (1997), “Disclosure level and the cost of equity capital”,The Accounting Review, Vol. 72 No. 3, pp. 323-349.
Charnes, A., Cooper, W.W. and Rhodes, E. (1978), “Measuring the efficiency of decision making units”,European Journal of Operational Research, Vol. 2 No. 6, pp. 429-444.
Chen, C.J.P. and Jaggi, B. (2000), “Association between independent non-executive directors, family control and financial disclosures in Hong Kong”,Journal of Accounting and Public Policy, Vol. 19 Nos 4-5, pp. 285-310.
Chen, T.-Y., Chen, C.-B. and Peng, S.-Y. (2008), “Firm operation performance analysis using data envelopment analysis and balanced scorecard: a case study of a credit cooperative bank”, International Journal of Productivity and Performance Management, Vol. 57 No. 7, pp. 523-539. Christensen, H., Lee, E. and Walker, M. (2008), “Do IFRS reconciliations convey new information? The debt contraction effect”, working paper, Manchester Business School, Manchester. Chung, R., Ho, S. and Kim, J.B. (2004), “Ownership structure and the pricing of discretionary
accruals in Japan”,Journal of International Accounting, Auditing and Taxation, Vol. 13 No. 1, pp. 1-20.
Colbert, A., Levary, R.R. and Shaner, M.C. (2000), “Determining the relative efficiency of MBA programs using DEA”,European Journal of Operational Research, Vol. 125 No. 3, pp. 656-669. Coombs, H.M. and Tayib, M. (1998), “Developing a disclosure index for local authority published accounts – a comparative study of local authority published financial reports between the UK and Malaysia”, paper presented at the Asian Pacific Interdisciplinary Research in Accounting Conference, Osaka, August, available at: www3.bus.osaka-cu.ac.jp/apira98/ archives/pdfs/22.pdf (accessed November 12, 2011).
Cooper, W.W., Seiford, L.M. and Tone, K. (2000),Data Envelopment Analysis: A Comprehensive Text With Models, Applications, References and DEA-Solver Software, Kluwer Academic Publishers, Boston, MA.
Cooper, W.W., Seiford, L.M. and Zhu, J. (2011),Handbook on Data Envelopment Analysis, 2nd ed., Springer, Berlin.
Deegan, C. (2002), “The legitimising effect of social and environmental disclosures – a theoretical foundation”,Accounting, Auditing and Accountability Journal, Vol. 15 No. 3, pp. 282-311.
Dhaliwal, D., Li, O.Z., Tsang, A.H. and Yang, Y.G. (2009), “Voluntary non-financial disclosure and the cost of equity capital: the case of corporate social responsibility reporting”, working paper, University of Arizona, Tucson, AZ.
Epstein, M.J. and Freedman, M. (1994), “Social disclosure and the individual investor”, Accounting, Auditing and Accountability Journal, Vol. 7 No. 4, pp. 94-109.
European Commission (2001), “Green paper – promoting a European framework for corporate social responsibility”, available at: http://eurlex.europa.eu/LexUriServ/site/en/com/2001/ com2001_0366en01.pdf (accessed January 19, 2012).
Francis, J., Nanda, D. and Olsson, P. (2008), “Voluntary disclosure, earnings quality, and cost of capital”,Journal of Accounting Research, Vol. 46 No. 1, pp. 53-99.
Gao, P. (2008), “Keynesian beauty contest, accounting disclosure and market efficiency”,Journal of Accounting Research, Vol. 46 No. 4, pp. 785-807.
17
Efficiency
analysis of
UAE banks
Gao, S.S., Heravi, S. and Xiao, J.Z. (2005), “Determinants of corporate social and environmental reporting in Hong Kong: a research note”, Accounting Forum, Vol. 29 No. 2, pp. 233-242.
Graham, J.W. (1991), “Servant-leadership in organizations: inspirational and moral”, The Leadership Quarterly, Vol. 2 No. 2, pp. 105-119.
Gray, R., Owen, D. and Maunders, K. (1988), “Corporate social reporting: emerging trends in accountability and the social contract”,Accounting, Auditing and Accountability Journal, Vol. 1 No. 1, pp. 6-20.
Hackston, D. and Milne, M.J. (1996), “Some determinants of social and environmental disclosures in New Zealand companies”,Accounting, Auditing and Accountability Journal, Vol. 9 No. 1, pp. 77-108.
Haniffa, R.M. and Cooke, T.E. (2005), “The impact of culture and governance on corporate social reporting”,Journal of Accounting and Public Policy, Vol. 24 No. 5, pp. 391-430.
Heizer, J. and Render, B. (2006),Operations Management, 8th ed., Pearson Education Inc, Upper Saddle River, NJ.
Hensel, N.D. (2003), “Strategic management of efficiencies in networks: cross-country evidence on European branch banking”,European Financial Management, Vol. 9 No. 3, pp. 333-360.
Hossain, M.A., Islam, K.S. and Andrew, J. (2006), “Corporate social and environmental disclosure in developing countries: evidence from Bangladesh”, proceedings of the Asian Pacific Conference on International Accounting Issues, Hawaii, HI, October.
Johnes, J. (2006), “Measuring teaching efficiency in higher education: an application of data envelopment analysis to economics graduates of UK Universities 1993”,European Journal of Operational Research, Vol. 174 No. 1, pp. 443-456.
Knoepfel, I. (2001), “Dow Jones Sustainability Group Index: a global benchmark for corporate sustainability”,Corporate Environmental Strategy, Vol. 8 No. 1, pp. 6-15.
Kumbhakar, S.C. and Lovell, C.A.K. (2000),Stochastic Frontier Analysis, Cambridge University Press, Cambridge.
Lev, B., Petrovits, C. and Radhakrishnan, S. (2010), “Is doing good for you? Yes, charitable contributions enhance revenue growth”, Strategic Management Journal, Vol. 31 No. 2, pp. 182-200.
Luo, X. (2003), “Evaluating the profitability and marketability efficiency of large banks an application of data envelopment analysis”,Journal of Business Research, Vol. 56 No. 8, pp. 627-635. McMullen, D.A. (1996), “Audit committee performance: an investigation of the consequences
associated with audit committees”,Auditing, Vol. 15, pp. 87-103.
March, J.G. and Sutton, R.I. (1997), “Organizational performance as a dependent variable”, Organization Science, Vol. 8 No. 6, pp. 698-706.
Mathews, M.R. and Perera, M. (1991),Accounting Theory and Development, Nelson, Melbourne. Menassa, E. (2010), “Corporate social responsibility: an exploratory study of the quality and extent of social disclosures by Lebanese commercial banks”, Journal of Applied Accounting Research, Vol. 11 No. 1, pp. 4-23.
Naser, K., Al-Hussaini, A., Al-Kwari, D. and Nuseibeh, R. (2006), “Determinants of corporate social disclosure in developing countries: the case of Qatar”,Advances in International Accounting, Vol. 19, pp. 1-23.
Nunnaly, J. (1978),Psychometric Theory, McGraw-Hill, New York, NY.
Paradi, J., Rouatt, S. and Zhu, H. (2011), “Two-stage evaluation of bank branch efficiency using data envelopment analysis”, Omega – International Journal of Management Science, Vol. 39 No. 1, pp. 99-109.
18
JEAS
29,1
Richardson, A. and Welker, M. (2001), “Social disclosure, financial disclosure and the cost of equity capital”, Accounting, Organization and Society, Vol. 26 Nos 7-8, pp. 597-616.
Rizk, R., Dixon, R. and Woodhead, A. (2008), “Corporate social and environmental reporting: a survey of disclosure practices in Egypt”, Social Responsibility Journal, Vol. 4 No. 3, pp. 306-323.
Ruf, B.M., Muralidhar, K., Brown, R.M., Janney, J.J. and Paul, K. (2001), “An empirical investigation of the relationship between change in corporate social performance and financial performance: a stakeholder theory perspective”, Journal of Business Ethics, Vol. 32 No. 2, pp. 143-156.
Ruggiero, J.A. (2007), “A comparison of DEA and the stochastic frontier model using panel data”, International Transactions in Operational Research, Vol. 14 No. 3, pp. 259-266.
Sathye, M. (2001), “X-efficiency in Australian banking: an empirical investigation”, Journal Banking Finance, Vol. 25 No. 3, pp. 613-630.
Schweser, C. and Temte, A. (2002),Schweser’s Study Notes: Financial Statement Analysis, Vol. 3, Kaplan Professional Company, Iowa.
Seiford, Z. and Zhu, J. (1999), “Profitability and marketability of the top 55 US commercial banks”, Management Science, Vol. 45 No. 9, pp. 1270-1288.
Sexton, T.R. (1986), “The methodology of data envelopment analysis”, in Silkman, R.H. (Ed.), Measuring Efficiency: An Assessment of Data Envelopment Analysis, Jossey-Bass, San Francisco, CA, pp. 7-29.
Spears, L.C. (2010), “On character and servant-leadership: ten characteristics of effective, caring leaders”,The Journal of Virtues and Leadership, Vol. 1 No. 1, pp. 25-30.
Statistics Centre-Abu Dhabi (SCAD) (2010), “Statistical yearbook of Abu Dhabi 2010”, available at: www.scad.ae/SCAD%20Publications/SYB%202010%20English.pdf (accessed January 5, 2010).
Tahir, I.M., Abu Baker, N.M. and Haron, S. (2009), “Evaluating efficiency of Malaysian banks using data envelopment analysis”,International Journal of Business and Management, Vol. 4 No. 8, pp. 96-106.
Van de Velde, E., Vermeir, W. and Corten, F. (2005), “Finance and accounting: corporate social responsibility and financial performance”,Corporate Governance, Vol. 5 No. 3, pp. 129-138.
Wallace, R.S. and Naser, K. (1995), “Firm-specific determinants of the comprehensiveness of mandatory disclosure in the corporate annual reports of firms listed on the stock exchange of Hong Kong”,Journal of Accounting and Public Policy, Vol. 14 No. 4, pp. 311-368. Wallace, R.S.O., Naser, K. and Mora, A. (1994), “The relationship between the comprehensiveness
of corporate annual reports and firm characteristics in Spain”,Accounting and Business Research, Vol. 25 No. 97, pp. 41-53.
Williams, S.M. and Pei, W.H. (1999), “Corporate social disclosures by listed companies on their web sites: an international comparison”,The International Journal of Accounting, Vol. 34 No. 3, pp. 389-419.
Yue, P. (1992), “Data envelopment analysis and commercial bank performance: a primer with applications to Missouri banks”, Federal Reserve Bank of St Louis, Vol. 74 No. 1, pp. 31-45.
Further reading
Yue, P. (2011), United Arab Emirates (UAE) Economic Brief and Outlook 2011, KAMCO Investment Research Department.
19
Efficiency
analysis of
UAE banks
About the authors
Tamer Mohamed Shahwan is an Assistant Professor in Finance and Banking. He got his PhD from Humboldt University of Berlin, Germany (2006). His dissertation is concerned with “Forecasting commodity prices using artificial neural networks.” His research interests are in the areas of investment and financial engineering. This involves research into stocks, financial risks, financial forecasting and market efficiency. Most of his research involves the use of intelligent systems and mathematical models such as neural networks, fuzzy logic, hybrid systems and evolutionary algorithms. Tamer Mohamed Shahwan is the corresponding author and can be contacted at: [email protected]
Yousef Mohammed Hassan is based in the Department of Accounting, Finance and Banking, Al Ain University of Science and Technology, Al Ain, United Arab Emirates.
To purchase reprints of this article please e-mail:[email protected]
Or visit our web site for further details:www.emeraldinsight.com/reprints
20
JEAS
29,1
This article has been cited by:
1. Tamer Mohamed Shahwan Department of Management, Zagazig University, Zagazig, Egypt . 2015. The effects of corporate governance on financial performance and financial distress: evidence from Egypt.
Corporate Governance: The international journal of business in society 15:5, 641-662. [Abstract] [Full Text]
[PDF]
2. Tamer Mohamed Shahwan Department of Accounting, Finance & Banking, Al Ain University of Science and Technology, Al Ain, United Arab Emirates and Management Department, Zagazig University, Zagazig, Egypt Abdoulaye Kaba Library, Al Ain University of Science and Technology, Al Ain, United Arab Emirates . 2013. Efficiency analysis of GCC academic libraries: an application of data envelopment analysis. Performance Measurement and Metrics 14:3, 197-210. [Abstract] [Full Text] [PDF]