The Acceptance of Information
Technology in the Sales Force
Niels Schillewaert
Ghent University
Michael Ahearne
Penn State SCBA
Ruud Frambach
Free University of Amsterdam
Rudy K. Moenaert
Ghent University
ISBM Report 15-2000
Institute for the Study of Business Markets The Pennsylvania State University 402 Business Administration Building
University Park, PA 16802-3004 (814) 863-2782 or (814) 863-0413 Fax
The Acceptance of Information Technology in the Sales Force
Niels Schillewaert*
ICM Doctoral Fellow – The Vlerick Leuven Ghent Management School and Ghent University, Belgium
Michael J. Ahearne*
Assistant Professor of Marketing – Penn State University, U.S.A.
Ruud T. Frambach
Associate Professor of Marketing – Free University of Amsterdam, The Netherlands
Rudy K. Moenaert
Associate Professor of Marketing – Ghent University, Belgium
Paper submitted to Journal of Marketing
December 11, 2000
* The first two authors contributed equally to the realization of this manuscript.
The authors would like to thank the Institute for the Study of Business Markets (ISBM), Pennsylvania State University for its excellent financial and academic support of this study. The first author also wishes to thank the Intercollegiate Center for Management Science (ICM), Belgium, for the financial support in terms of a Ph.D. scholarship.
Key Words: Technology Acceptance, Sales Management, Innovativeness
Correspondence may be addressed to Niels Schillewaert, The Vlerick Leuven Ghent Management School, Bellevue 6, B-9050 Ledeberg, Belgium, Europe; e-mail: [email protected]
The Acceptance of Information Technology in the Sales Force
Abstract:
Combining both a direct and an unobtrusive measure of acceptance (i.e. two judges for measuring acceptance), the authors develop and test a theoretical model that explains the extent to which salespeople accept an information technology. The model builds on the Technology Acceptane Model and specifies relationships between perceived usefulness, ease of use, personal innovativeness, computer self-efficacy, organizational facilitators, supervisor influence, peer usage, customer influence, competitive pressure and technology acceptance. Counter to the theory of the Technology Acceptance Model, the results indicate that the personal innovativeness of a salesperson and the organizational facilitators are key to explaining salespeople’s technology acceptance. In addition, the findings suggest that salespeople comply with the influences of their supervisors and competitive reps in adopting sales technology. Implications of the findings are discussed in light of providing guidelines for successful technology implementation in the sales force.
Introduction
The introduction of information technology into (sales and marketing) organizations has been shown on many occasions to result in superior returns for a company (e.g. enhanced productivity, customer communication and relationships) when these technologies are embraced by the individual target users (Bhattacherjee 1998; Srinivasan 1985; Davis et al. 1989; Leonard-Barton and Deschamps 1988). Still, in sales force contexts the acceptance of technological innovations at the individual level (i.e. the field salespeople), has not been investigated previously. The marketing literature on innovation adoption has primarily focused either on consumer markets (e.g. Ozanne and Churchill 1971; Gatignon and
Robertson 1985; Steenkamp et al. 1999) or on adoption at the organizational/departmental level (e.g. Robertson and Gatignon 1986; Gatignon and Robertson 1989; Frambach et al. 1997; Moriarty and Swartz 1991).
Conversely, the information systems literature contains an extensive and long standing tradition of research that focuses on explaining the acceptance of information technology from the user’s (i.e. individual’s) perspective (e.g. DeLone and McLean 1992; Zmud 1979; Ives and Olson 1984; Davis et al. 1989; Doll and Torkzadeh 1988; Trevino and Webster 1992). Perhaps the best contributions in predicting and explaining user acceptance of computer technology in organizational contexts have been made by the Technology Acceptance Model (TAM) (e.g. Davis et al. 1989; Venkatesh and Davis 2000). The central thesis of the TAM is that individual computer acceptance is determined by two instrumental beliefs: perceived usefulness (i.e. the extent to which a person believes that using the system
will improve his/her job performance) and perceived ease of use (i.e. the extent to which a
person considers that using the system will be free of effort). Over the years, strong empirical support has accumulated in favor of TAM (e.g. Igbaria et al. 1996; Davis 1989; Trevino and Webster 1992; Igbaria 1993; Adams et al. 1992; Doll et al. 1998). Therefore, this model represents the current thinking in the field of information systems about user acceptance of computer technology.
Whereas some research has been done to model the effects of different external variables, TAM needs to be broadened to encompass other important theoretical constructs which need to be tested within an integrated nomological net of variables. Such integrated models depart from prior research on innovation adoption and computer acceptance, which has focused
primarily on either first order effects of acceptance determinants (e.g. Rogers 1995; Thompson et al.1991) or antecedents of perceived usefulness or ease of use separately (e.g. Venkatesh and Davis 2000; Venkatesh 1996; Venkatesh and Davis 1996; Karahanna and Straub 1999). Against this background, a major contribution of our study is that it develops and tests a theoretically integrated model which explains salespeople’s computer acceptance behavior.
Moreover, observations in practice suggest implementation failure rates of sales technology as high as 75% (Petersen 1997; Siebel and Malone 1996; Blodgett 1995; Lee 1998) and indicate that a major reason may be that salespeople are among the most technophobic and resistant of all white collar workers (e.g. Parthasarathy and Sohi 1997; Bresnahan 1998; Mills 1995). Harris and Pike (1996), for example, report that almost one out of five sales reps in the agribusiness never use a computer in their work. Given this situation, we assert that a sales rep’s personal innovativeness in the domain of information technology is key in understanding and explaining the acceptance of technology in the context of personal selling. Counter to the assertions of the TAM, we develop hypotheses maintaining that innovative salespeople will not only hold different belief structures in terms of using sales technology, but also that a sales rep’s individual innovativeness will influence acceptance behavior over and above these held beliefs. Hence, we asses whether organizations should actively identify and target those salespeople, within their sales organization, that are high in personal innovativeness during the implemention of sales technology (Agarwal and Prasad 1998).
Despite the extensive study of TAM, the impact of social influences and norms on acceptance remains one of the poorly understood aspects of technology acceptance (Davis et al. 1989; Venkatesh and Davis 2000). The prior studies on TAM investigate the role of social influences from a general standpoint, namely that of “important others”. Consequently, these social influences are not adapted to a personal selling context. In this study, we adapt and disentangle these influences to a sales setting as we hypothesize that these effects are differential depending on the source (e.g. customers, competitors, supervisors and colleagues).
An additional limitation of current research is that both the TAM and the traditional innovation adoption literature take a narrow view on acceptance. This criterion variable is traditionally conceptualized as the mere “frequency of use” (e.g. Davis et al. 1989) or as a “dichotomous (single) adoption decision” (e.g. Frambach et al 1998; Gatignon and Robertson 1985). Virtually no studies have measured and examined “acceptance” as the “extent of adoption” where the innovating unit goes through an implementation and confirmation stage (Rogers 1995; Westphal et al. 1997). Hence, an additional objective of this study is to conceptualize and measure ‘individual technology acceptance’.
We examine the issue of salesperson technology acceptance using both a direct and an unobtrusive measure of acceptance. The direct measure of acceptance consists the salesperson’s reports about his/her own acceptance behavior, while the unobtrusive measure is an assessment of the sales rep’s acceptance behavior as perceived by a second source, namely the focal sales rep’s sales manager. After establishing adequate levels of interrater
agreement (i.e. between the sales rep and his/her sales manager), both measures are aggregated to form a reliable measure of acceptance. Hence, we reduce the effects of common method bias as an explanation for a sales rep’s technology acceptance.
As a context for our research, we focus on Sales Automation (SA) technology. SA-applications are defined here as an umbrella term describing computerized systems, which are specifically designed to support individual field sales representatives. In the sections that follow, we begin with a discussion of the focal constructs and develop our research hypotheses. In the method section, we outline the sample and data acquisition procedure as well as the measure development. Next, we test our research model using multiple respondent data from a cross sectional sample of sales reps (N=168) and their (field) sales managers. Finally, we discuss the implications of our findings and provide suggestions for future research.
Theoretical Background and Hypotheses
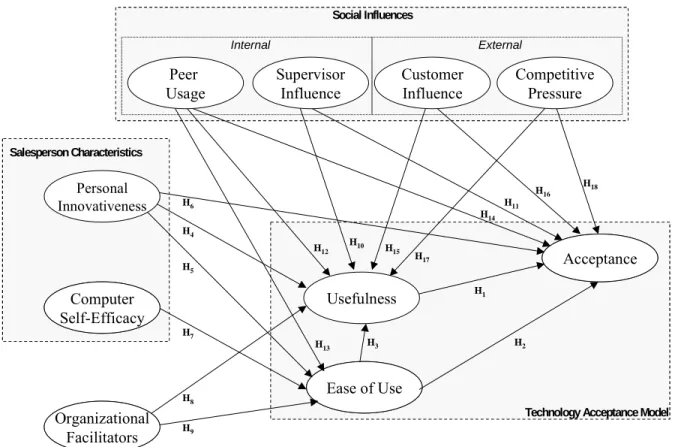
The model used to study the acceptance of sales technology is depicted in Figure 1. Our model includes the effects of external variables covering (1) the individual characteristics ‘Personal Innovativeness of a sales person with respect to information technology’ and
‘Computer Self-Efficacy’, (2) ‘Organizational Facilitators’ (i.e. ‘user training’, ‘technical user support’ and ‘organizational implementation’), and (3) social influence variables such
Below we describe each of these constructs and build a theoretical justification for the interrelationships within the model.
(Figure 1 about here)
Explicating Acceptance
“Adoption” can be defined in several ways. In the innovation literature, adoption is typically considered as a discrete or dichotomous phenomenon (Westphal et al. 1997; Gatignon and Robertson 1985). However, such an approach neglects the variation that inevitably exists in terms of the degree of adoption by the target population. Studies in the field of information systems, on the other hand, assess “user acceptance” by means of (1) the frequency or the number of times a computer system is used, (2) the duration of user sessions and (3) the number of different computer applications used. Still, these studies always employ these measures of “user acceptance” in isolation and as single indicators. In either case, this view of adoption or acceptance is too narrow and does not cover the entire domain and meaning of “acceptance” as a construct. Actually, Rogers (1995, p. 190) proposes that after the stages of
the adoption decision and trial use, the innovating unit goes through an implementation and confirmation stage. “Using the innovation on a regular bases”, “continued use of the innovation” and “integration of the innovation into one’s ongoing routine”, are characteristic for these stages. Consistent with this broader view on “actual” adoption, we define individual acceptance as the extent to which a sales individual frequently and fully uses his/her company’s SA system and does so throughout his/her sales process activities for which the SA is suited.
Technology Acceptance Model: Perceived Usefulness and Ease of Use
As was noted earlier, our research model is based on the Technology Acceptance Model (TAM). The TAM is theoretically derived from Fishbein and Ajzen’s (1975) Theory of Reasoned Action (TRA), and attempts to explain the determinants of computer use across a broad range of end-user computing technologies and populations (Davis et al. 1989). TAM explains an individual’s acceptance of computer technology based on two specific beliefs:
perceived usefulness (i.e. the degree to which a person thinks that using a system will
enhance his/her performance) and perceived ease of use (i.e. the extent to which an
individual believes that using the technology will require little effort). TAM theorizes that both beliefs determine acceptance behavior directly. The theory also suggests that perceived ease of use influences perceived usefulness, because, ceteris paribus, technologies that are easy to use can be more useful (Davis et al. 1989; Davis 1989; Venkatesh 1999; Venkatesh and Davis 2000). Strong empirical support has accumulated in favor of TAM (e.g. Venkatesh and Davis 2000; Davis 1989; Trevino and Webster 1992; Igbaria 1993; Adams et al. 1992; Doll et al. 1998).
The adoption literature typically used more general innovation characteristics for explaining adoption rates (e.g. Rogers 1995; Moore and Benbasat 1991; Frambach et al. 1998). Based on a meta-analysis of innovation characteristics, Tornatzky and Klein (1982) found that three innovation characteristics – ‘perceived relative advantage’, ‘compatibility’ and ‘complexity’ – where consistently related to adoption behavior. The beliefs from TAM are conceptually very similar to these innovation characteristics, however. ‘Complexity’ can be considered the inverse of ‘ease of use’ as it indicates the degree to which an innovation is perceived as difficult to use and understand. ‘Relative advantage’ reflects the benefits of the innovation and is closely related to the conception of ‘usefulness’ in TAM (Moore and Benbasat 1991).
Additionally, Moore and Benbasat (1991) could not distinguish ‘compatibility’ and ‘relative advantage’ as separate factors. Because TAM was developed to specifically explain the individual acceptance of computer technologies in organizationam settings, we relied on TAM in developing our model.
Hence, conform this “robust” theory and findings we formulate the following basic hypotheses:
H1: Perceived usefulness has a positive effect on a sales person’s acceptance of SA
H2: Perceived ease of use has a positive effect on a sales person’s acceptance of SA
H3: Perceived ease of use has an indirect effect on a sales person’s SA-acceptance through Perceived Usefulness
In line with the assertions of TRA, TAM assigns a key role to both beliefs in that it theorizes that these beliefs mediate the effects of all “external variables” (i.e. factors other than cognitive and normative beliefs) on acceptance behavior (Davis et al. 1989; Venkatesh 1999; Venkatesh and Davis 1999; Karahanna and Straub 1999). According to both theories, the effect of any such variable on user acceptance operates through the central beliefs. Hence, the influence of any uncontrollable environmental factor (e.g. user characteristics, task characteristics) or controllable intervention (e.g. implementation and educational programs, user support) on acceptance behavior, is supposed to be indirect. Consequently, we hypothesize that salespeople’s beliefs (at least partially) mediate the effects of individual, organizational and social variables.
The effect of individual salesperson characteristics
The Personal Innovativeness of a Sales Person in terms of IT
Personal innovativeness has a long standing tradition in the fields of marketing and innovation adoption. The term innovativeness has been used to operationalize different notions, however. Rogers (1995) defines innovativeness as the degree to which a person’s observed time of adoption occurs relatively earlier than that of other people in his/her social
system. Although useful for purposes of ex post description and classification of individuals in terms of actualized innovative behavior (e.g. early versus late adopter), this behavioral
measure of innovativeness generates a tautology: individuals are considered to be innovative, if, and only if, they actually innovate (Midgley and Dowling 1978; Steenkamp et al. 1999). In contrast, innovativeness has also been conceptualized at a higher level of abstraction, as a
persisting personal predisposition to innovate. This perspective recognizes that complex
influences and communication processes (e.g. marketing and interpersonal contact) within a social system may intervene and determine a unit’s final adoption behavior. In other words, people high in innovativeness might not always be among the first to actually adopt an innovation because of these intervening factors. This notion of personal innovativeness has gained wide acceptance in consumer marketing research in terms of explaining the adoption of innovations (e.g. Hirschman 1980; Venkatraman and Price 1990; Steenkamp et al. 1999; Gatignon and Robertson 1985; Midgley and Dowling 1978 and 1993; Hurt et al. 1977). Because this conception of personal innovativeness is more appropriate for our research purposes (i.e. explaining actual acceptance behavior), we also adhere to the latter definition of innovativeness.
Based on the reasoning that general attitudes are often poor predictors of specific behavior (Bem 1970), a distinction is made between global and domain (or product category)-specific innovativeness. Domain-specific innovativeness should explain acceptance more accurately within a precise set of products, as opposed to global innovativeness which has low predictive power when applied to a specific innovation (Goldsmith and Hofacker 1991; Flynn and Goldsmith 1993). Leonard-Barton and Deschamps (1988) and Agarwal and Prasad (1998) adopted a similar perspective and used personal innovativeness for explaining individual acceptance in a business setting. Also, organizational members’ “receptivity towards change” has shown to be an important determinant of innovation success (Zmud 1984; Zaltman et al. 1973). Building on these conceptualizations and studies, we define the personal innovativeness of a salesperson with respect to information technology as a salesperson’s attitude which reflects his/her tendency to experiment with and adopt new information technologies, independently of the communicated experience of others. Midgley
and Dowling (1978) refer to innovativeness as an unobservable and innate trait of an
individual, without implying that it is genetic. Although we agree with the fact that personal innovativeness is a relatively persistent characteristic, we believe that the label “innate trait” is too strong in the context of our research. Therefore, we define personal innovativeness as
an attitude describing a salesperson’s learned and enduring cognitive evaluations, emotional feelings and action tendencies towards a set of objects (here: adopting information technology) (e.g. Fishbein and Ajzen 1975; Rosenberg and Hovland 1960; Triandis 1971; Kotler 1994). In summary, the innovativeness of a sales person should be seen as an individual characteristic which (s)he “brings along in the job” and that is invariant across different types of information technologies.
We attribute a key role to innovativeness in a sales setting. Actually, there is practical evidence to believe that a lot of salespeople have a natural prejudice or resistance towards information technology (Colombo 1994; Goldenberg 1996; Campbell 1998) and have little experience in using computer technology (Petersen 1997). Similarly, Harris and Pike (1996) report “personal resistance to new technology” as one of the major barriers to use SA. As a result, being compelled to use information technology by the company and having to keep up with technological changes, may increase the already considerable levels of job stress or role complexity of salespeople (Roberts et al. 1997; Boles et al. 1997) and increase the resistance towards information technology innovations. We hypothesize that a sales rep’s personal innovativeness will have indirect as well as a direct effect on acceptance. First, it can be expected that sales reps who are highly innovative in the area of information technology, will exhibit more positive beliefs towards using the SA technology. These technologically oriented reps will have more computer related experience, be more handy in using them and better realize the usefulness of these systems for sales activities. This kind of reasoning is in line with the TAM in that the central beliefs mediate the impact of external variables on acceptance.
Counter to the assertions from TAM, however, we also propose a direct relationship from personal innovativeness to acceptance because highly innovative individuals will use computer applications as a natural reflex and ‘out of habit’. This is consistent with Triandis (1971) who asserts that behavior is also influenced by habits, over and above attitudes. On the other hand, less innovative salespeople will be much more resistant in terms of investing time in using technology for performing tasks that distract them from selling. Thus,
H4: There is a positive relationship between a sales rep’s personal innovativeness for information technology and the perceived usefulness of using SA throughout the sales process
H5: There is a positive relationship between a sales rep’s personal innovativeness for information technology and the perceived ease of use of using SA throughout the sales process
H6: There is a direct positive relationship between a sales rep’s personal innovativeness for information technology and his/her acceptance of IT
Computer Self-Efficacy
The concept of computer self-efficacy is based on the extant literature by Bandura (1986) on general self-efficacy. Bandura (1982, 1986) defined self-efficacy as “the judgments of how well one can execute a course of action required to deal with prospective situations”.
Bandura (1982) proposed that measures of self-efficacy should be adapted to the specific behavior and psychological functioning under consideration. Several studies have found empirical evidence for the fact that self-efficacy in the domain of computer technology is significantly related to the perceptions users hold about these technologies (e.g. Burckhardt and Brass 1990; Gist et al. 1989; Hill et al. 1987 – for detailed overview of studies on computer self-efficacy see Marakas et al. 1998). In a recent study, Compeau and Higgins (1995) build on these findings. The authors define the construct of computer self-efficacy as “an individual’s perceptions of his/her ability to use computer (software) in the accomplishment of a task” (Compeau and Higgins 1995, p. 191) and develop a reliable and
valid measure for it. In light of the TAM, Venkatesh and Davis (1996) used Compeau and Higgins’ (1995) scale and modeled computer self-efficacy as an antecedent of perceived ease of use. The rationale being that a person uses his/her sense of his/her overall computer abilities as an anchor to judge the usability of a computer system, even if a user has little or no knowledge about the ease of use of a specific system. Hence,
H7: There is a positive relationship between a sales person’s computer self-efficacy and his/her perceived ease of use of using the SA-system
Organizational Facilitators
Several studies indicate that individual usage of innovations not only depends upon beliefs and perceptions but also on management strategies, policies and actions (Lucas 1978; Ives and Olson 1984; Leonard-Barton and Deschamps 1988). Organizational facilitators can be considered the flip side of supplier marketing activities, defined in some adoption models at the organizational level (Frambach et al. 1998). We refer to organizational facilitators as the internal marketing and service efforts targeted to the end-users (i.e. internal customers - salespeople) of the SA system. By definition, organizational facilitators are multi-dimensional and in the case of computer technologies they consist of user training, technical user support and implementation effort. Training users how they can effectively apply IT for
specific work problems is a major prerequisite for its usage. Several authors have proposed and provided evidence for the fact that the level of training a user gets, positively influences the beliefs about a system as well as subsequent usage behavior (e.g. Igbaria 1993; Igbaria et al. 1989; Igbaria 1990; Igbaria 1993; Clegg et al. 1997; Venkatesh 1999; Thompson et al. 1991). Technical user support assesses a sales rep’s perceptions about the extent to which the
organization has invested in objective resources which facilitate the usage of IT. It includes the availability of information center support for user assistance and guidance. Technical user support has been proposed as an important facilitator for user attitudes and subsequent acceptance (e.g. Conger 1992; Igbaria and Chakrabarti 1990; Thompson et al. 1991; Trevino and Webster 1992; Igbaria 1990 and 1993; Clegg et al. 1997). The organizational
implementation efforts refer to user perceptions about the internal marketing campaign and
implementation approach (next to training and technical support) on behalf of the organization as a change agent (Rogers 1995). Encouragement and commitment from senior management and active promotion activities for the SA-technology are examples of such implementation efforts. Top management support has been proposed as an important factor
for successful implementation of information systems in general (e.g. Igbaria 1990; 1993). In the case of sales automation top management support, training, pilot testing, project championing and field support have been suggested as important aspects for successful implementation (Colombo 1994; Petersen 1997; Siebel and Malone 1996).
Conform the theoretical assumptions made in TAM (Davis et al. 1989), we propose that organizational facilitators will indirectly influence the acceptance of SA through a sales rep’s beliefs about the SA-technology. The rationale is that training salespeople on how to apply an SA-system in their job, providing them adequate technical support in sync with an adequate implementation program will enhance their awareness of the system operations and it’s usefulness in the sales job. Hence,
H8: There is a positive relationship between the organizational facilitators and perceived usefulness of the SA-system
H9: There is a positive relationship between the organizational facilitators and perceived ease of use of the SA-system
Social Influences
Although many theorists have suggested that acceptance behavior does not occur in a vacuum (e.g. Kraut et al. 1998; Burkhardt 1994), the original TAM does not include social influence processes as determinants for acceptance behavior (Davis et al. 1989). In order to understand the relationship between social influence variables and acceptance behavior we need to turn to studies from the innovation literature and Fishbein and Ajzen’s (1975) TRA, the fundamental theoretical underpinning for TAM. Social influence variables create an impelling force to use an innovation, originating from the social system, which incites a focal individual to conform with these pressures. The social influence on the individual adoption
and use of innovations has two underlying rationales (Kraut et al. 1998). First, the social effects may come from the fact that the intrinsic utility of an innovation increases with the number of users within a focal salesperson’s social environment. Second, social influence may be normative in nature and stem from persuasive communication by other members in a salesperson’s social system (i.e. social persuasion). The increased social utility in relation to
the number of users, has traditionally been labeled as the phenomenon of (network) externalities (Markus 1990; Katz, Shapiro 1994; Rogers 1995; Rice 1990). Furthermore, the usage level of “important others” not only signals its usefulness and importance, but may also be so compelling that the opportunity cost or risk for a sales rep of not complying with their usage becomes too high. Thus, the IT and SA usage of a sales rep’s communication partners, influences both the beliefs about using SA in the selling process and its acceptance over and above the beliefs. Social persuasion concentrates on the interpersonal
communication processes through which recipients learn about innovations and develop attitudes towards them (Kraut et al. 1998; Burkhardt 1994). Research from different fields provides support for the fact that interpersonal communication and persuasion is an important source of influence (Grossbart et al. 1978; Midgley 1983; Katz and Lazarsfeld 1955; Kiel and Layton 1981; Price and Fieck 1984; Arndt 1967) and a crucial factor in the decision to adopt (Mahajan et al. 1984; Rogers 1995; Price and Fieck 1984; Udell 1966). Social persuasion results in behavioral and normative rules that guide actions which are perceived to be appropriate for and approved, by other members of the social system. Hence, social persuasion refers to the use of IT by salespeople as the result of normative statements of “important others”.
These assertions about social influences are similar to the effects of subjective norms in attitude theories (e.g. Triandis 1971; Fishbein and Ajzen 1975). Subjective norms are a “person’s perceptions that most people who are important to him think he should or should not perform the behavior in question” (Fishbein and Ajzen 1975). Such perceptions are
indicative of others’ beliefs and allows the focal individual to learn about technology and adapt his/her own belief structure. However, subjective norms may also exert a direct effect on a person’s acceptance behavior if the person is motivated to comply. Both mechanisms are referred to as (1) internalization and/or identification and (2) compliance, respectively (Kelman 1958; Warshaw 1980; Davis et al. 1989).
In TAM, social subjective norms are assessed in a general sense. In a sales setting, we believe it is important to disentangle the potential effect of different sources of social influence. Since salespeople are boundary spanners, salespeople associate with their supervisors, peers, customers and competitors. Hence, the social influences may stem from within the organization (i.e. usage and encouragement of supervisors and peers) as well as from the outside market (i.e. customers’ usage and encouragement and competitor’s use -- institutional pressures). Consequently, we have defined four social influence variables:
supervisor influence, peer usage, customer influence and competitive pressure.
Supervisor influence refers to the extent to which sales reps’ immediate supervisors directly encourage and stimulate their subordinates to use the SA-tools (Leonard-Barton and Deschamps 1988). Several research studies lend support for the supposition that supervisors influence, both in terms of usage (Igbaria et al. 1996; Karahanna and Straub 1999) as in
terms of persuasive communication (Salancik and Pfeffer 1978; Zmud 1984; Leonard-Barton and Deschamps 1988), affects individual acceptance. Supervisors are an important source of power and a means for salespeople to obtain extrinsic rewards and recognition. Indeed, supervisory feedback has shown to shape salespeople’s work orientation and performance (Kohli et al. 1998). So, through the process of internalization and compliance we hypothesize that the actions and statements of a sales rep’s supervisor will play a crucial role in the acceptance of SA-technology. Hence, we suggest the following:
H10: Supervisor Influence has a positive effect on a sales rep’s beliefs about usefulness of using IT throughout the sales process
H11: There is a direct positive relationship between supervisor influence and a sales rep’s acceptance of SA
Co-workers influence an individual’s beliefs and behaviors by supplying information about an object or situation (Salancik and Pfeffer 1978; Burkhardt 1994). Hence, the adoption behavior of potential users can be influenced by advice of peers and how many others use the innovation (Igbaria et al. 1996; Thompson et al. 1991; Rogers 1995; Leonard-Barton 1985). Similarly, Leonard-Barton and Deschamps (1988) control for the effect of "acquaintance with users” on acceptance behavior. The influence of peers’ usage can also take the form of “vicarious learning” from observing others use the system (Bandura 1979). In summary, the observation of the widespread use of sales automation by co-workers could demonstrate its usefulness and ease of use. Hence, we suggest the following:
H12: Peer Usage has a positive effect on a sales rep’s beliefs about the usefulness of using IT throughout the sales process
H13: Peer Usage has a positive effect on a sales rep’s beliefs about the ease of use of using SA throughout the sales process
Organization studies suggest that companies adopt innovative technology due to institutional pressures from the external environment (DiMaggio and Powell 1991; Salancik and Pfeffer 1978). The theoretical argument is that by adhering to these forces, companies gain legitimacy among stakeholders. Recently, Srinivasan et al. (1999) found support for the fact that institutional pressures had an impact on organizational technology adoption. The two external social influences comprised in our model (i.e. customer influence and competitive pressure) are institutional pressures that may be relevant at the level of the individual salesperson.
Customer influence refers to the extent to which a sales rep’s customer base demonstrates
interest and gratification with IT usage of the focal sales executive. In other words, it is the impression a sales rep has that his customer base encourages him/her to use any form of IT. This buyer influence is not specific for the focal SA application but refers to customers’ general level of IT proficiency, e.g. in terms of usage, expectations, liking of IT usage by salespeople.
H15: Customer Influence has a positive effect on a sales rep’s beliefs about usefulness of using IT throughout the sales process
H16: There is a direct positive relationship between customer influence and a sales rep’s acceptance of SA
Competitive pressure relates to the extent to which the focal sales rep perceives that his
competitors’ sales executives actively apply similar SA-applications in their sales and customer approach. We hypothesize that the usage of IT by competing salespeople will spur acceptance through imitation (O’Callaghan et al. 1992), the threat of losing competitive advantage (Abrahamson and Rosenkopf 1993) and signaling (Gatignon and Robertson 1989). Thus,
H17: Competitive pressure has a positive effect on a sales rep’s beliefs about usefulness of using IT throughout the sales process
H18: There is a direct positive relationship between competitive pressure and a sales rep’s acceptance of SA
Method
Our study began with an extensive literature review combined with an exploratory qualitative study. The qualitative study consisted of five interviews with sales reps from different industries and companies as well six industry experts (i.e. sales automation experts). All interviews where transcribed and content analyzed using established coding and qualitative data analysis techniques (Miles and Huberman 1994; Strauss and Corbin 1990). The overarching objective of this preliminary investigation was to specify construct domains, generate sample items for new constructs, check the face validity of existing measures in a sales setting and assess the nomological ‘sense’ of our conceptual model (see e.g. Churchill 1979; DeVellis 1991). Based on this study a draft questionnaire was constructed and pre-tested with seven academics and two industry experts. For testing our research hypothesis we used a cross sectional survey design.
Sample and data acquisition.
A selection of executives in sales (field) management functions from the subscription list of the Sales and Field Force Automation-magazine (CurtCo Freedom Group--NY/CA1) was
used to construct our sampling frame of salespeople. Using a convenience sampling procedure these sales managers were approached by telephone. Sales managers, who were
1 See http:\\www.smamag.com
willing to participate, were screened by asking whether or not there was a SA-system in place in their sales organization2. In addition, the contact persons were informed about the purpose of the research and asked to participate in the study by identifying four of their subordinate sales representatives. 233 sales management executives from as many companies classified for our research and agreed to participate. Using this procedure our sample frame consisted of 787 sales representatives. Subsequently, a first questionnaire was sent directly to the identified participants. A number of specific efforts in terms of technique (e.g. survey length, sponsorship) and timing (e.g. follow-up efforts) were made to increase the response rate (Dillman 1978; Lanuk and Berenson 1975; Fowler 1993). The mailing included (1) a personalized and hand-signed letter on official university letterhead, explaining the purpose of the study and ensuring confidentiality, (2) the questionnaire (with special care taken for a user friendly lay out), (3) a $1 bill and (4) a pre-paid reply envelope addressed to the researchers. After one week, a reminder letter was sent to non-respondents and after two and a half weeks a second reminder, was sent out, containing a replacement survey. Of the 787 mailings sent out, 7 returned because of insufficient addresses and 257 as completed surveys, generating a response rate of 33%. 33 cases were eliminated from our analysis because of either misclassification or incomplete data, resulting in 224 usable data points (a usable response rate of approximately 29%).
Our sample contained salespeople employed in a broad range of industries (e.g. manufacturing, services, trade, finance and information). The sample was predominantly male (76%) and the median age of our sample lies between 36 and 45 years. The average experience in a sales job was 13.4 years and average company tenure 6.8 years.
2 Note that this screening question was a necessary condition to be able to study the acceptance of SA technology at the individual level in an organizational setting.
Measures
Appendix A lists all the items used in this study as well as their source. The response format used for all items where 7 point Likert scales. Our measurement approach of the ultimate criterion variable, ‘acceptance’, warrants some additional explanation at this point. Salesperson technology acceptance was measured using both a direct and an unobtrusive measure of acceptance. More specifically, acceptance was assessed using two judges. One respondent was the sales representative (i.e. direct measure), who reported on his/her usage of the sales automation system. The other informant was the focal rep’s sales manager (i.e. unobtrusive measure), who rated the level of acceptance for each of the subordinate sales reps (s)he identified for participation in the study. Both judges rated three identical facets of acceptance3.
The most straightforward and commonly used approach to model acceptance is to ask respondents about their own acceptance behavior. The arguments in favor of using self-reported acceptance are that salespeople best know the details of their daily sales activities and that some of their efforts may not be directly observable by their manager. A possible concern with self-ratings, however, is that salespeople may describe their behavior in an overly positive manner and/or socially desirable way (Behrman and Perreault 1982). Furthermore, measuring self-reported acceptance and its determinants on a single questionnaire may introduce common method variance as an explanation of the relationships discovered (Venkatesh and Davis 2000; Anderson and Robertson 1995). Therefore, we collected additional data about a sales rep’s acceptance by assessing the criterion variable
with the focal rep’s (field) sales manager4. There are several reasons why such an unobtrusive measure of acceptance may be valuable in complement to the direct acceptance measure. Despite the fact that the managerial assessment may confront us with the problem of perceptual disagreements and “informant” bias (cf. infra), sales managers are knowledgeable and competent informants to report on salespeople’s acceptance behavior (Kumar et al. 1993). In fact, because of their organizational role, sales managers evaluate the behavior and performance of the salesperson (Behrman and Perreault 1982). Furthermore, many sales automation systems also contain management applications that can not work “stand-alone” from the applications used by field salespeople (Moriarty and Swartz 1991). Moreover, the acceptance of sales technology is a contingent innovation5, which implies that the organization-wide acceptance of sales technology in the field, can be considered as a company objective as well as an indication of successful implementation (e.g. Rogers 1995; DeLone and McLean 1992). Considering their organizational position, sales managers share this organizational responsibility for – or are involved with – successfully implementing technology into their sales force. Further, the unobtrusive managerial assessment may convey additional perspectives on the same phenomenon. In fact, the manager’s appraisal also taps into the comparative aspects of a salesperson’s technology acceptance. Such an assessment of an individual’s acceptance compared to his/her peers is a dimension that is supposedly more difficult to capture for the boundary spanning salesperson. Finally, the unobtrusive
4 The acceptance with managers was measured at the same point in time where managers were solicited to identify 4 of their subordinate sales reps.
5 Once the organizational decision makers have decided to adopt a new technology, the focus shifts to putting the innovation into use. Hence, the success of the innovation process is assessed by the extent to which the innovation is used and integrated into the organization (Rogers 1995; Gopalakrishnan, Damanpour 1997; Zaltman, Duncan and Holbek 1973). Indeed, organizational innovations which have to be incorporated in the work processes of organizational members, are of little value if they are not used. A new technology must be accepted by its target “user” group in order to achieve the objectives and reap the benefits the organization intends to realize (e.g. Leonard-Barton and Deschamps 1988; Srinivasan 1985; Bhattacherjee 1998).
measure reduces common method bias and, thus, adds confidence to the robustness of our findings.
Rather than using both measures of acceptance separately, we preferred to use both sources in combination, for testing our research hypotheses. Studies using multiple respondents have often showed considerable levels perceptual disagreement, however (Kumar et al. 1993). One of the approaches, frequently used in past research, for dealing with discrepant responses is
aggregation (Kumar et al. 1993). The aggregation procedure pools the reports of multiple
respondents to create indicators of the phenomenon under investigation. Prior to aggregating responses, however, some level of perceptual agreement must exist. Consequently, we assessed the level of agreement between both judges. James et al. (1984) provide a procedure to estimate such interrater reliability. The indices of interrater reliability were calculated for each of the three indicators of the acceptance. In calculating these estimates, 57 cases were identified with unacceptable degrees of disagreement and 4 observations with an interrater reliability lower than the modest value .5 (James et al. 1984). Similar to Chatterjee et al.’s (1992) procedure for dealing with the perceptual agreement problem, we discarded those observations from our further analyses. This reduced the final sample from 229 to 168 records. The final estimates of interrater reliability averaged .87, had a median of .92 and ranged from .5 to 1. Furhtermore, 76% of the cases in our final sample have interrater reliabilities higher than .80. An alternate statistical assessment of perceptual agreement was provided by the correlations between the reports of the two raters on each item of acceptance (Jones et al. 1983; Kumar et al. 1993). The correlations between the identical measures of acceptance, rated by both judges, were significant and substantial ranging between .53 and .58. The other inter-item correlations among the six acceptance measures were minimum .38.
Hence, we provided evidence for adequate interrater agreement and the basics are present to form a reliable measure of acceptance (Hair et al. 1998). In preparation of our further analyses and consistent with empirical studies using multiple respondents (Chatterjee et al. 1992; Kumar et al. 1993; James et al. 1984), the items on which the two raters did not fundamentally disagree were averaged to form three scores, one per facet of acceptance. These three indicators were used as indicators in the subsequent tests of our structural models.
Results
Confirmatory factor analysis
The psychometric properties of our measures were tested by means of confirmatory factor analysis procedures in Lisrel8.30 (Jöreskog and Sörbom, 1999), using the Maximum Likelihood estimation procedure and the covariance matrix as input. We used a multi-step approach for testing structural models similar to the procedures suggested by Anderson and Gerbing (1988). Considering the fact that our model contains a large number of constructs and items, the sources of misspecification where isolated by fitting smaller confirmatory models step by step (Costner and Schoenberg 1973; Bentler and Chou 1987). Hence, we conducted our measurement analyses on separate sets of related constructs prior to estimating an overall model. Once the reliability, validity and model fit within each of the categories was established, an overall confirmatory factor analysis on the entire set of constructs was
conducted6. Altogether, the results of the confirmatory factor analysis show that our factor model fist the data very well and that all measures have high-quality psychometric properties (see Appendix B for a summary of these results). First, the factor solution is proper and the multiple goodness-of-fit indices meet the recommended cut off values (Hu and Bentler 1999; Bollen 1989; Marsh and Hovecar 1985; Hair et al. 1998). The χ²-statistic was 833.75 (d.f. = 620; P = 0.00) 7, the RMSEA equal to 0.045, the SRMR was 0.058, the NNFI was equal to 0.93 and the CFI 0.94.. Second, all factor loadings where significant and substantial, the construct reliabilities were large (i.e. composite reliability >.82 and average variance extracted >.51; Bagozzi and Yi 1988), altogether indicating good convergent validity (Steenkamp and van Trijp 1991; Bagozzi and Baumgartner 1994). Finally, the model outputs provide evidence for adequate discriminant validity. For all constructs, the average variance extracted by the underlying construct is larger than the shared variance (i.e. the squared intercorrelation) with other latent constructs (Fornell and Larcker 1991).
Hypothesis testing
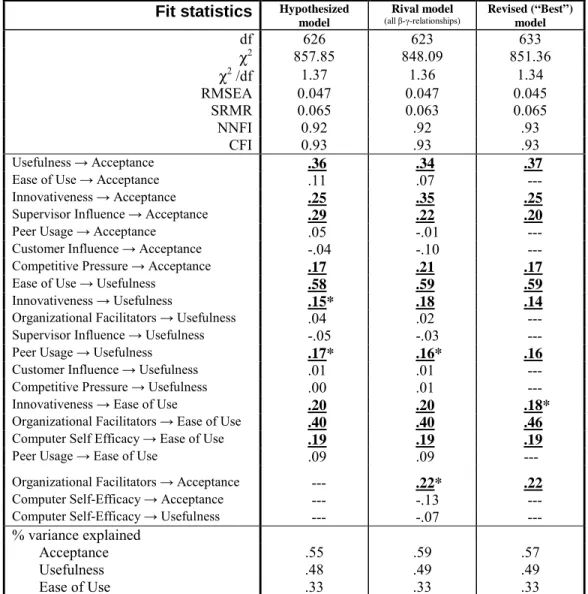
Once the proposed measurement model was consistent with the data, the hypothesized structural paths where estimated. The “hypothesized model”-column of Table 1 contains the standardized parameter estimates, the goodness-of-fit statistics and the coefficients of determination of the hypothesized model. As appears from this table, the hypothesized model fits the data well and all significant relationships are in the hypothesized direction, thus providing evidence for the nomological validity of our model (Steenkamp and van Trijp
6 Due to space limitations we do not report the detailed results for each step of the analysis. The entire description is available from the first author.
7 Although the χ² goodness-of-fit statistic is significant, indicating inadequate fit, the test is considered to be of limited use due to its sensitivity to sample size (Baumgartner and Homburg 1996; Bentler 1990; Bagozzi and Baumgartner 1994; Cudeck and Browne 1983). Thus, we assess model fit based on the alternative fit indices.
1991). Also, the independent variables account for a substantial proportion in the variance of the criterion variables (R²easeofuse=.33; R²usefulness=.49 and R²acceptance=.55).
Many of our hypothesized relationships are supported. We find support for a direct relationship of usefulness, personal innovativeness, supervisor influence and competitive pressure on a salesperson’s acceptance of SA (H1; H6; H11 and H18 supported). In contrast, the direct paths from ease of use, peer usage and customer influence to acceptance were not significant (H2, H14 and H16 not supported). The effect of ease of use on usefulness was significant as hypothesized (H3 supported), while the effect of personal innovativeness was borderline significant (i.e. t-value = 1.95) (H4 partially supported). The impact of peer usage on usefulness was borderline significant (i.e. t-value = 1.86) (H12 partially supported). No support was found for the effect of peer usage on ease of use (H13 not supported). Personal innovativenss and organizational facilitators had a significant effect on ease of use (H5 and H9 supported). The effect of computer self-efficacy on ease of use was borderline significant (i.e. t-value = 1.93) (H7 partially supported). No support was found for the effect of organizational facilitators, supervisor influence, competitive pressure and customer influence on usefulness (H8; H10; H2.15 and H2.17 not supported).
(Table 1 about here)
Model evaluation
Because it is recommended that researchers compare the performance and robustness of their hypothesized model against “plausible” alternative models (Bollen and Long 1992; Hair et al. 1998; Morgan and Hunt 1994), a rival and “revised” model where tested. The rival model allowed additional direct paths from computer self-efficacy and organizational facilitators
(i.e. estimating all β and γ-relationships). In the “revised” model, all non-significant paths were removed from the preferred model and the model was re-estimated (“best”/revised model).
The rival model is compared with the hypothesized model by means of a χ² difference test. A non-significant difference between both models would suggest that the hypothesized model is preferred. By conducting the χ² difference test (i.e. ∆χ² = 9.16 with 3 df -- ∆χ²-value compared to critical value 7.81) one can conclude that there is a significant difference between both models. This means that the rival model fits the data better than our hypothesized model. Checking the coefficients of the additional paths estimated, shows that the direct path coefficient from organizational facilitators to acceptance is 0.22 and close to significance at the p = .05 level (t-value = 1.95). This direct path may be the reason for the enhanced fit of the alternative model. In fact, the LISREL modification indices (provided in the hypothesized model) also suggest that the model fit could be significantly improved by freeing up the same path. Although a direct effect of the external variable organizational facilitators runs counter to the theoretical assertions of TAM, this additional path has a theoretical explanation (Hair et al. 1998). Such a direct path suggests that the organizational efforts for implementing sales automation in the sales force, contributes positively to individual acceptance through other means than enhanced beliefs of usefulness and ease of use. Consequently, the path was added to the model.
The final step in our estimation procedure was to remove all non-significant paths from our hypothesized models. The rationale for doing so is to provide a more parsimonious representation of the data: it is better to have more degrees of freedom, all else being equal.
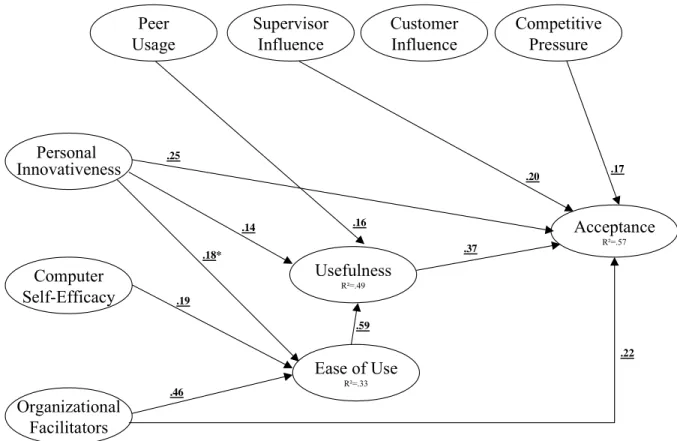
The end result of this procedure can therefore be labeled as the “best” model. As reported in Table 1 the “best” model has very good fit statistics: χ² equal to 851.36 (d.f. = 633), a RMSEA = 0.045, a SRMR equal to 0.065, the NNFI = 0.93 and a CFI of 0.93. By comparing the “best” with the rival model, one notices that the χ² difference test is not significant. Still, the revised model is preferred compared to the rival model because: (1) the other alternative fit indices are similar for both models, (2) the rival model is less parsimonious, (3) in the rival model a lower percentage of estimated paths was significant (55%) as opposed to the revised model (100%) and (4) the revised model only sacrifices little explanatory power (Morgan and Hunt 1994). Thus, although not hypothesized, the direct path from organizational facilitators to acceptance remained in the model. Note also that by removing all non-significant paths, the paths from peer usage and personal innovativenss to usefulness and the direct path from organizational facilitators to acceptance become significant (p < .05). Similarly, the path from computer self-efficacy to ease of use becomes significant. On the other hand, the effect of personal innovativeness on ease of use becomes borderline significant. Hence, we conclude that H4, H9 and H12 are supported and that H5 is partially supported. The revised model is visualized in Figure 2.
(Figure 2 about here)
General Discussion and Conclusions
When planning the introduction of new sales technology, a prominent problem in many sales organizations is how information technology can be successfully implemented in the sales force. With the development and test of an integrated model of salesperson technology
acceptance we took a first step in advancing our knowledge of the seemingly challenging link between sales reps and computer technology. Several theoretically and practically important findings resulted from this study.
Theoretical Implications
Technology Acceptance Model. Our study shows that the TAM is strongly supported in a
personal selling context. The results are in line with the overall findings across several studies in the information systems area (e.g. Davis et al. 1989; Adams et al. 1992; Venkatesh and Davis 2000). The results reinforced the role of perceived usefulness as the fundamental driver for sales technology acceptance. Similar to previous findings, perceived ease of use is an important, yet secondary driver of acceptance (Davis et al. 1989; Venkatesh and Davis 2000). It was found to affect acceptance only indirectly through perceived usefulness.
Personal Innovativeness. By going beyond the traditional TAM and including important
external variables such as personal innovativeness, this study provides a broader and richer understanding of salespeople’s technology acceptance. Although the issue of personal innovativeness has garnered interest among consumer marketing researchers (e.g. Midgley and Dowling 1978; Steenkamp et al. 1999), empirical work focusing on the role of innovativeness in an organizational (sales) setting is scarce. Our study contributes to this gap and shows that the personal innovativeness of an individual salesperson in the domain of information technology plays a key role in the acceptance of sales technology. The direct effect of personal innovativeness on acceptance is interesting because our findings run counter to the theoretical assertions of TAM: our findings indicate that the effect of the
personal characteristic and external variable “innovativeness” on acceptance is not fully mediated by the key beliefs perceived usefulness and ease of use. This implies that salespeople’s technology acceptance behavior is not only determined by their instrumental beliefs, but also by their habits and general attitudes towards information technology which they bring along in their job. The central position of a sales person’s innovativeness in terms of information technology is particularly noteworthy in the personal selling context because daily management practice learns that salespeople seem to have a natural prejudice against technology. This reality seems to be confirmed by our data.
In addition, our findings confirmed the direct relationship between innovativeness and usefulness. This indicates that innovative salespeople better realize the benefits of a sales technology. However, the influence on ease of use was only found to be marginal next to a sales rep’s computer self-efficacy and the organizational facilitators.
Social Influences. The role of the different social influence variables included in our model,
provide some useful insights into the technology acceptance process of salespeople. Supervisors seem to have an important direct impact on the acceptance behavior of their subordinates. This effect is indicative for the fact that supervisors are able to make their subordinates comply with their persuasions. In other words, a sales rep’s immediate supervisor who is an advocate of sales automation, is able to persuade his/her subordinate reps to embrace sales technology over and above the rep’s beliefs about the system and regardless of his/her personal characteristics. Similarly, the finding of a significant direct relationship from competitive pressure on acceptance suggests that the competitive institutional pressures, which have been suggested to affect innovation adoption at the
organizational level (e.g. DiMaggio and Powell 1991; Srinivasan et al. 1999), also prevail at the level of the individual sales rep. However, the fact that both variables only have a direct impact on acceptance, indicates that the a sales rep’s motivation to accept due to these influences is based on other things than the intrinsic utility of the technology itself (e.g. threat of losing competitive edge, supervisors’ power exertion).
Peer usage has shown to be of secondary importance: our findings indicate only a direct relationship from peer usage to usefulness. Hence, sales reps learn from their colleagues about the benefits of a sales technology. Still, this is an important finding because it shows that the intra-organizational innovation process also works through the mechanism of current users. This suggests that achieving an adequate user base among salespeople can help other salespeople learn about a system’s usefulness and spurs diffusion throughout the organization.
Our results provide no evidence for the fact that customer influence plays an important role in the individual acceptance of sales technology. This may indicate that customers do not care about the tools salespeople use in their job and whether or not they use information technology to serve them. Next to the fact this variable is simply not important, this may also suggest that the effect of customer influence is more complex at the individual level and only holds under specific circumstances. For example, some sales situations may not be suitable for using information technology for data gathering or in front of customers and, hence, make it less useful. Or, general market and customer relationship characteristics may moderate this relationship.
Other External Variables. The effect of the two other exogenous variables (i.e.
organizational facilitators and computer self-efficacy) in our model are consistent with TAM in that both variables affect ease of use. In the case of computer self-efficacy, this finding is in line with our hypothesis and the assertion that the concept is closely related to perceptions of ease of use. Our data show that the organizational efforts are also important for sales reps to learn about the usability and usefulness of sales technology. Still, the impact of organizational facilitators on usefulness was fully mediated by ease of use. Plausible explanations for this finding may be that organizational efforts are primarily geared towards usability and/or shape perceptions of usefulness only in the initial stages of implementation.
However, a discrepancy between the hypothesized model, as well as the assertions of TAM and the findings is that the proposed model posited that the effects of organizational efforts on technology acceptance would be completely mediated by the central TAM beliefs. Nevertheless, the data indicate that usefulness and ease of use only partially mediated this effect. Organizational facilitators occupy a central role in our model as they also had a direct effect on acceptance. Thus, it appears that TAM does not capture all the internal psychological variables through which external variables achieve their influence on user acceptance (Davis et al. 1989). In other words, there might be other mediators for the relationship between organizational facilitators and acceptance than the TAM variables. The adoption literature may provide such mediators, like compatibility, mandatoriness and (salesperson) image (Rogers 1995; Moore and Benbasat 1991). However, given the numerous previous empirical tests of TAM (e.g. Davis et al. 1989; Venkatesh and Davis
2000), this finding may point to the specific importance of organizational commitment to the innovation in a sales setting (Scott and Bruce 1994). A firm signals commitment to an innovation by means of its investments related to information technology, the importance given to the innovation in human resource practices and the status of managers involved in the innovation process (Atuahene-Gima 1997).
Managerial Implications
What do our results imply for (sales) management practice? In implementing information systems for sales, technology suppliers and innovating companies would like to diagnose the reasons why a technology is (not) accepted by users and what corrective actions can be taken. Which system characteristics make technology acceptable to salespeople? Which salespeople can be expected to accept sales technology more easily and thoroughly? Subsequently, what should companies do to improve the acceptance of sales technology among its field salespeople? The logic of these issues has been followed in this research and, hence, the results are relevant to all of these concerns.
Our data suggest that a system’s usefulness is the key to salespeople’s acceptance. Although technical usability and user friendliness are important for acceptance, the primary concern in a sales environment should be on how sales technology enhances performance and effectiveness. Salespeople will embrace technology much more easily if it improves their job performance. This is an important issue given the fact that many salespeople hold performance oriented goals which motivate their work behavior (Sujan et al. 1994).
The results indicate that targeting salespeople who have a general innovative attitude in the domain of information technology, would greatly benefit the technology implementation process within the firm. Not only will these salespeople accept sales technology more thoroughly, they are important advocates and will spur the intra-firm adoption process of the sales technology among their peers (Agarwal and Prasad 1998). In addition, innovative salespeople appear to understand the benefits and master the use of information systems more quickly than salespeople who are resistant to information technology. Technology suppliers and companies implementing sales technology, could use the innovativeness variable in several phases throughout the implementation process: e.g. during pilot and usability tests, to segment the sales organization and approach these potential users differently.
The finding of a direct relationship from organizational facilitators to acceptance, indicates that perceptions of organizational commitment to the innovation are of utmost importance. In fact, the results suggest that the internal marketing and service efforts (e.g. user training, technical user support and management commitment) are highly effective in influencing acceptance, both directly and in terms of learning salespeople the benefits and usage of technology in the sales job. Furthermore, the use of state of the art sales technology by competitive reps appears to provoke imitation or a threat for competitive advantage among salespeople. This suggests that organizational implementation efforts and training should be designed such that they incorporate the above mentioned arguments: stress the technology’s benefits and usability, the competitive usage of information technology and target innovative users.
Active support from salespeople’s supervisors complements these organizational facilitators in inspiring salespeople to use technology throughout their sales job. Supervisors as advocates of sales technology are able to make their subordinate salespeople comply with their persuasions and use technology. This is a powerful example of how companies can make salespeople use sales technology regardless of their held beliefs about the technology (e.g. trial usage, applications which have mainly managerial benefits). This finding may not be surprising considering the fact that supervisory feedback literature has addressed how sales managers can influence sales behavior (Kohli 1985; Kohli et al. 1998). The influence of supervisors on acceptance behavior also implies that companies need to inspire multiple layers of the sales organization during the implementation process. In other words, organizations and technology suppliers do not only need to focus their efforts on end users, but also on first-line supervisors. Similarly, Anderson and Robertson (1995) have indicated that training expenditures complemented with supervisor attention are key to salespeople’s adoption of house brands.
Limitations and Suggestions for Future Research
As with all research, this study also had limitations. First, perceived acceptance was used as opposed to measures of actual behavior (e.g. objective usage measures). There is an ongoing debate in the information systems literature as to whether objective usage indicators are superior to perceptual measures (e.g. Venkatesh and Davis 2000; Hartwick and Barki 1994; Ajzen 1987). However, we have tried to alleviate the effect of common method bias in explaining acceptance, by combining a direct and an unobtrusive measure of acceptance obtained from multiple informants (i.e. the focal sales rep and his/her sales manager). In
addition, the respondents were ensured anonymity, at no point reference was made to their managers as participants in the study and the completed questionnaires were send directly to the researchers. These procedures likely reduced eventual biases even more. Furthermore, studying actual acceptance behaviors involves practical constraints. These include that in order to obtain company records (e.g. computer logs) a study would have to be conducted within a single research site. This would limit the generalizability of the study results, however.
Second, the determinants of acceptance included in our model were measured by means of the same survey instrument. Hence, the interrelationships between these variables may be partially explained by common source variance. Ideally, the measurement of these variables would be separate in time and longitudinal research designs could be used to overcome this obstacle in future research.
A third and related limitation is that the use of cross-sectional data reduces the ability to make actual causal assertions which are implied in the research hypotheses. Again, to determine such causal relationships empirically, experimental or longitudinal research designs would be needed.
The limitations mentioned above, suggest fruitful directions for future research to extend our findings. However, some additional contributions in future research can be made.
Even though we have attempted to include a wide range of variables to explain a sales rep’s technology acceptance behavior, other potentially influential variables where not incorporated in our model. The finding of the direct relationships relations of external variables over and above the TAM variables, may be illustrative for the fact that, in a sales
setting, TAM needs to be extended and comprise other mediating beliefs. Future research may try to elicit these additional salient beliefs that are idiosyncratic to a personal selling context (Ajzen and Fishbein 1980) or use innovation characteristics from the adoption literature (e.g. image and compatibility). Future research could also seek to further extend models of sales technology acceptance to encompass other theoretical constructs germane in personal selling. It would be interesting, for example, to explore the role of sales experience, goal orientation (Sujan et al. 1994), personal trait competitiveness and competitive climate (Brown et al. 1998) on the acceptance of salesperson technology.
Our results also show that the personal innovativeness of a sales rep is an important driver of sales technology acceptance. However, due to the cross sectional research design we used, we have no insights into the stability of the personal innovativeness variable over time (i.e. during the implementation process). Hence, future research, using longitudinal research, could assess the temporal dynamics of a sales rep’s personal innovativeness.