Online Appendix:
Are Universities Becoming More Unequal?
Yan Lau
∗
Harvey S. Rosen
†
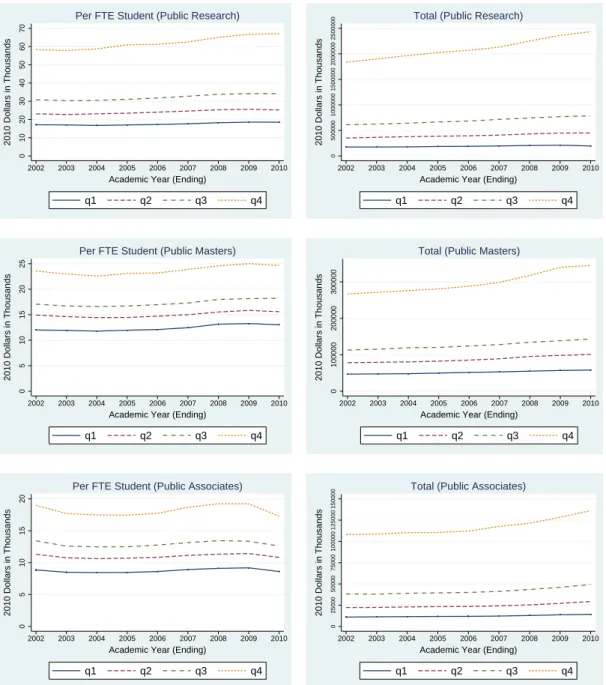
Figure A1: Income by Quartile for Public Carnegie Classifications
0 10 20 30 40 50 60 702010 Dollars in Thousands
2002 2003 2004 2005 2006 2007 2008 2009 2010Academic Year (Ending)
q1
q2
q3
q4
Per FTE Student (Public Research)
0 500000 1000000 1500000 2000000 2500000
2010 Dollars in Thousands
2002 2003 2004 2005 2006 2007 2008 2009 2010Academic Year (Ending)
q1
q2
q3
q4
Total (Public Research)
0 5 10 15 20 25
2010 Dollars in Thousands
2002 2003 2004 2005 2006 2007 2008 2009 2010Academic Year (Ending)
q1
q2
q3
q4
Per FTE Student (Public Masters)
0 100000 200000 300000 400000
2010 Dollars in Thousands
2002 2003 2004 2005 2006 2007 2008 2009 2010Academic Year (Ending)
q1
q2
q3
q4
Total (Public Masters)
0 5 10 15 20
2010 Dollars in Thousands
2002 2003 2004 2005 2006 2007 2008 2009 2010Academic Year (Ending)
q1
q2
q3
q4
Per FTE Student (Public Associates)
0 25000 50000 75000 100000 125000
2010 Dollars in Thousands
2002 2003 2004 2005 2006 2007 2008 2009 2010Academic Year (Ending)
q1
q2
q3
q4
Total (Public Associates)
Note: Income is defined as the sum of tuition, government grants, private gifts and investment income, and
other sources. See the text for details. All dollar amounts are expressed in 2010 dollars; the CPI for Urban
Consumers is used to account for changes in the price level.
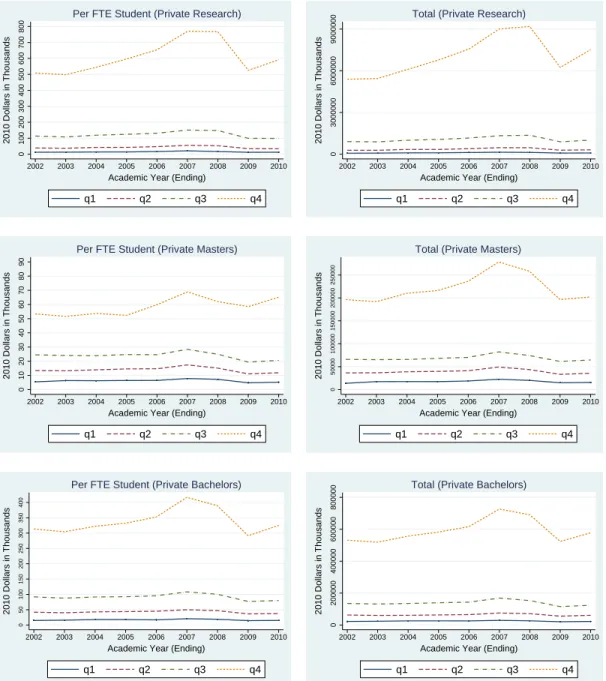
Figure A2: Income by Quartile for Private Carnegie Classifications
−50 0 50 100 150 200 250 3002010 Dollars in Thousands
2002 2003 2004 2005 2006 2007 2008 2009 2010Academic Year (Ending)
q1
q2
q3
q4
Per FTE Student (Private Research)
−1000000 0 1000000 2000000 3000000
2010 Dollars in Thousands
2002 2003 2004 2005 2006 2007 2008 2009 2010Academic Year (Ending)
q1
q2
q3
q4
Total (Private Research)
0 10 20 30 40 50
2010 Dollars in Thousands
2002 2003 2004 2005 2006 2007 2008 2009 2010Academic Year (Ending)
q1
q2
q3
q4
Per FTE Student (Private Masters)
0 50000 100000 150000 200000
2010 Dollars in Thousands
2002 2003 2004 2005 2006 2007 2008 2009 2010Academic Year (Ending)
q1
q2
q3
q4
Total (Private Masters)
−20 0 20 40 60 80
2010 Dollars in Thousands
2002 2003 2004 2005 2006 2007 2008 2009 2010Academic Year (Ending)
q1
q2
q3
q4
Per FTE Student (Private Bachelors)
0 50000 100000 150000
2010 Dollars in Thousands
2002 2003 2004 2005 2006 2007 2008 2009 2010Academic Year (Ending)
q1
q2
q3
q4
Total (Private Bachelors)
Note: Income is defined as the sum of tuition, government grants, private gifts and investment income, and
other sources. See the text for details. All dollar amounts are expressed in 2010 dollars; the CPI for Urban
Consumers is used to account for changes in the price level.
Figure A3: Expenditure by Quartile for Public Carnegie Classifications
0 10 20 30 40 50 60 702010 Dollars in Thousands
2002 2003 2004 2005 2006 2007 2008 2009 2010Academic Year (Ending)
q1
q2
q3
q4
Per FTE Student (Public Research)
0 500000 1000000 1500000 2000000 2500000
2010 Dollars in Thousands
2002 2003 2004 2005 2006 2007 2008 2009 2010Academic Year (Ending)
q1
q2
q3
q4
Total (Public Research)
0 5 10 15 20 25
2010 Dollars in Thousands
2002 2003 2004 2005 2006 2007 2008 2009 2010Academic Year (Ending)
q1
q2
q3
q4
Per FTE Student (Public Masters)
0 100000 200000 300000
2010 Dollars in Thousands
2002 2003 2004 2005 2006 2007 2008 2009 2010Academic Year (Ending)
q1
q2
q3
q4
Total (Public Masters)
0 5 10 15 20
2010 Dollars in Thousands
2002 2003 2004 2005 2006 2007 2008 2009 2010Academic Year (Ending)
q1
q2
q3
q4
Per FTE Student (Public Associates)
0 25000 50000 75000 100000 125000 150000
2010 Dollars in Thousands
2002 2003 2004 2005 2006 2007 2008 2009 2010Academic Year (Ending)
q1
q2
q3
q4
Total (Public Associates)
Note: Expenditures are the sum of spending on instruction, research, academic support, student services, and
other items. Further details are provided in the text. All dollar amounts are expressed in 2010 dollars; the
CPI for Urban Consumers is used to account for changes in the price level.
Figure A4: Expenditure by Quartile for Private Carnegie Classifications
0 25 50 75 100 125 150 175 2002010 Dollars in Thousands
2002 2003 2004 2005 2006 2007 2008 2009 2010Academic Year (Ending)
q1
q2
q3
q4
Per FTE Student (Private Research)
0 500000 1000000 1500000 2000000 2500000
2010 Dollars in Thousands
2002 2003 2004 2005 2006 2007 2008 2009 2010Academic Year (Ending)
q1
q2
q3
q4
Total (Private Research)
0 5 10 15 20 25 30 35
2010 Dollars in Thousands
2002 2003 2004 2005 2006 2007 2008 2009 2010Academic Year (Ending)
q1
q2
q3
q4
Per FTE Student (Private Masters)
0 25000 50000 75000 100000 125000 150000
2010 Dollars in Thousands
2002 2003 2004 2005 2006 2007 2008 2009 2010Academic Year (Ending)
q1
q2
q3
q4
Total (Private Masters)
0 10 20 30 40 50
2010 Dollars in Thousands
2002 2003 2004 2005 2006 2007 2008 2009 2010Academic Year (Ending)
q1
q2
q3
q4
Per FTE Student (Private Bachelors)
0 15000 30000 45000 60000 75000 90000
2010 Dollars in Thousands
2002 2003 2004 2005 2006 2007 2008 2009 2010Academic Year (Ending)
q1
q2
q3
q4
Total (Private Bachelors)
Note: Expenditures are the sum of spending on instruction, research, academic support, student services, and
other items. Further details are provided in the text. All dollar amounts are expressed in 2010 dollars; the
CPI for Urban Consumers is used to account for changes in the price level.
Figure A5: Endowment by Quartile for Public Carnegie Classifications
0 10 20 30 40 50 60 70 802010 Dollars in Thousands
2002 2003 2004 2005 2006 2007 2008 2009 2010Academic Year (Ending)
q1
q2
q3
q4
Per FTE Student (Public Research)
0 500000 1000000 1500000 2000000 2500000
2010 Dollars in Thousands
2002 2003 2004 2005 2006 2007 2008 2009 2010Academic Year (Ending)
q1
q2
q3
q4
Total (Public Research)
0 5 10 15 20
2010 Dollars in Thousands
2002 2003 2004 2005 2006 2007 2008 2009 2010Academic Year (Ending)
q1
q2
q3
q4
Per FTE Student (Public Masters)
0 25000 50000 75000 100000 125000 150000
2010 Dollars in Thousands
2002 2003 2004 2005 2006 2007 2008 2009 2010Academic Year (Ending)
q1
q2
q3
q4
Total (Public Masters)
0 1 2 3 4 5 6
2010 Dollars in Thousands
2002 2003 2004 2005 2006 2007 2008 2009 2010Academic Year (Ending)
q1
q2
q3
q4
Per FTE Student (Public Associates*)
0 20000 40000 60000 80000
2010 Dollars in Thousands
2002 2003 2004 2005 2006 2007 2008 2009 2010Academic Year (Ending)
q1
q2
q3
q4
Total (Public Associates*)
Note: *The quartiles for public associates institutions are imprecise because of low sample size. Each year, only
around 16 institutions participated in the NACUBO endowment survey, from which the endowment data is
obtained. All dollar amounts are expressed in 2010 dollars; the CPI for Urban Consumers is used to account
for changes in the price level.
Figure A6: Endowment by Quartile for Private Carnegie Classifications
0 100 200 300 400 500 600 700 8002010 Dollars in Thousands
2002 2003 2004 2005 2006 2007 2008 2009 2010Academic Year (Ending)
q1
q2
q3
q4
Per FTE Student (Private Research)
0 3000000 6000000 9000000
2010 Dollars in Thousands
2002 2003 2004 2005 2006 2007 2008 2009 2010Academic Year (Ending)
q1
q2
q3
q4
Total (Private Research)
0 10 20 30 40 50 60 70 80 90
2010 Dollars in Thousands
2002 2003 2004 2005 2006 2007 2008 2009 2010Academic Year (Ending)
q1
q2
q3
q4
Per FTE Student (Private Masters)
0 50000 100000 150000 200000 250000
2010 Dollars in Thousands
2002 2003 2004 2005 2006 2007 2008 2009 2010Academic Year (Ending)
q1
q2
q3
q4
Total (Private Masters)
0 50 100 150 200 250 300 350 400
2010 Dollars in Thousands
2002 2003 2004 2005 2006 2007 2008 2009 2010Academic Year (Ending)
q1
q2
q3
q4
Per FTE Student (Private Bachelors)
0 200000 400000 600000 800000
2010 Dollars in Thousands
2002 2003 2004 2005 2006 2007 2008 2009 2010Academic Year (Ending)
q1
q2
q3
q4
Total (Private Bachelors)
Note: All dollar amounts are expressed in 2010 dollars; the CPI for Urban Consumers is used to account for
changes in the price level.
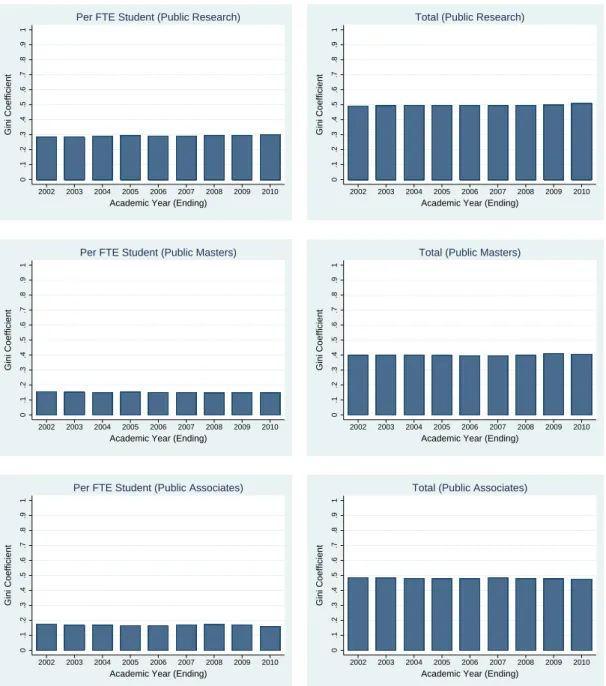
Figure A7: Income Gini Coefficients for Public Carnegie Classifications
0 .1 .2 .3 .4 .5 .6 .7 .8 .9 1Gini Coefficient
2002 2003 2004 2005 2006 2007 2008 2009 2010Academic Year (Ending)
Per FTE Student (Public Research)
0 .1 .2 .3 .4 .5 .6 .7 .8 .9 1
Gini Coefficient
2002 2003 2004 2005 2006 2007 2008 2009 2010Academic Year (Ending)
Total (Public Research)
0 .1 .2 .3 .4 .5 .6 .7 .8 .9 1
Gini Coefficient
2002 2003 2004 2005 2006 2007 2008 2009 2010Academic Year (Ending)
Per FTE Student (Public Masters)
0 .1 .2 .3 .4 .5 .6 .7 .8 .9 1
Gini Coefficient
2002 2003 2004 2005 2006 2007 2008 2009 2010Academic Year (Ending)
Total (Public Masters)
0 .1 .2 .3 .4 .5 .6 .7 .8 .9 1
Gini Coefficient
2002 2003 2004 2005 2006 2007 2008 2009 2010Academic Year (Ending)
Per FTE Student (Public Associates)
0 .1 .2 .3 .4 .5 .6 .7 .8 .9 1
Gini Coefficient
2002 2003 2004 2005 2006 2007 2008 2009 2010Academic Year (Ending)
Figure A8: Income Gini Coefficients for Private Carnegie Classifications
1.28 0 .1 .2 .3 .4 .5 .6 .7 .8 .9 1Gini Coefficient
2002 2003 2004 2005 2006 2007 2008 2009 2010Academic Year (Ending)
Per FTE Student (Private Research)
1.73 0 .1 .2 .3 .4 .5 .6 .7 .8 .9 1
Gini Coefficient
2002 2003 2004 2005 2006 2007 2008 2009 2010Academic Year (Ending)
Total (Private Research)
0 .1 .2 .3 .4 .5 .6 .7 .8 .9 1
Gini Coefficient
2002 2003 2004 2005 2006 2007 2008 2009 2010Academic Year (Ending)
Per FTE Student (Private Masters)
0 .1 .2 .3 .4 .5 .6 .7 .8 .9 1
Gini Coefficient
2002 2003 2004 2005 2006 2007 2008 2009 2010Academic Year (Ending)
Total (Private Masters)
0 .1 .2 .3 .4 .5 .6 .7 .8 .9 1
Gini Coefficient
2002 2003 2004 2005 2006 2007 2008 2009 2010Academic Year (Ending)
Per FTE Student (Private Bachelors)
0 .1 .2 .3 .4 .5 .6 .7 .8 .9 1
Gini Coefficient
2002 2003 2004 2005 2006 2007 2008 2009 2010Academic Year (Ending)
Total (Private Bachelors)
Note: The Gini coefficients among private research and private bachelors institutions for 2009 experienced
sig-nificant increases because of negative incomes. Gini coefficients can exceed one when some observations have
negative incomes. In the graphs, we have capped Gini coefficient values at 1.
Figure A9: Expenditure Gini Coefficients for Public Carnegie Classifications
0 .1 .2 .3 .4 .5 .6 .7 .8 .9 1Gini Coefficient
2002 2003 2004 2005 2006 2007 2008 2009 2010Academic Year (Ending)
Per FTE Student (Public Research)
0 .1 .2 .3 .4 .5 .6 .7 .8 .9 1
Gini Coefficient
2002 2003 2004 2005 2006 2007 2008 2009 2010Academic Year (Ending)
Total (Public Research)
0 .1 .2 .3 .4 .5 .6 .7 .8 .9 1
Gini Coefficient
2002 2003 2004 2005 2006 2007 2008 2009 2010Academic Year (Ending)
Per FTE Student (Public Masters)
0 .1 .2 .3 .4 .5 .6 .7 .8 .9 1
Gini Coefficient
2002 2003 2004 2005 2006 2007 2008 2009 2010Academic Year (Ending)
Total (Public Masters)
0 .1 .2 .3 .4 .5 .6 .7 .8 .9 1
Gini Coefficient
2002 2003 2004 2005 2006 2007 2008 2009 2010Academic Year (Ending)
Per FTE Student (Public Associates)
0 .1 .2 .3 .4 .5 .6 .7 .8 .9 1
Gini Coefficient
2002 2003 2004 2005 2006 2007 2008 2009 2010Academic Year (Ending)
Figure A10: Expenditure Gini Coefficients for Private Carnegie Classifications
0 .1 .2 .3 .4 .5 .6 .7 .8 .9 1Gini Coefficient
2002 2003 2004 2005 2006 2007 2008 2009 2010Academic Year (Ending)
Per FTE Student (Private Research)
0 .1 .2 .3 .4 .5 .6 .7 .8 .9 1
Gini Coefficient
2002 2003 2004 2005 2006 2007 2008 2009 2010Academic Year (Ending)
Total (Private Research)
0 .1 .2 .3 .4 .5 .6 .7 .8 .9 1
Gini Coefficient
2002 2003 2004 2005 2006 2007 2008 2009 2010Academic Year (Ending)
Per FTE Student (Private Masters)
0 .1 .2 .3 .4 .5 .6 .7 .8 .9 1
Gini Coefficient
2002 2003 2004 2005 2006 2007 2008 2009 2010Academic Year (Ending)
Total (Private Masters)
0 .1 .2 .3 .4 .5 .6 .7 .8 .9 1
Gini Coefficient
2002 2003 2004 2005 2006 2007 2008 2009 2010Academic Year (Ending)
Per FTE Student (Private Bachelors)
0 .1 .2 .3 .4 .5 .6 .7 .8 .9 1
Gini Coefficient
2002 2003 2004 2005 2006 2007 2008 2009 2010Academic Year (Ending)
Figure A11: Endowment Gini Coefficients for Public Carnegie Classifications
0 .1 .2 .3 .4 .5 .6 .7 .8 .9 1Gini Coefficient
2002 2003 2004 2005 2006 2007 2008 2009 2010Academic Year (Ending)
Per FTE Student (Public Research)
0 .1 .2 .3 .4 .5 .6 .7 .8 .9 1
Gini Coefficient
2002 2003 2004 2005 2006 2007 2008 2009 2010Academic Year (Ending)
Total (Public Research)
0 .1 .2 .3 .4 .5 .6 .7 .8 .9 1
Gini Coefficient
2002 2003 2004 2005 2006 2007 2008 2009 2010Academic Year (Ending)
Per FTE Student (Public Masters)
0 .1 .2 .3 .4 .5 .6 .7 .8 .9 1
Gini Coefficient
2002 2003 2004 2005 2006 2007 2008 2009 2010Academic Year (Ending)
Total (Public Masters)
0 .1 .2 .3 .4 .5 .6 .7 .8 .9 1
Gini Coefficient
2002 2003 2004 2005 2006 2007 2008 2009 2010Academic Year (Ending)
Per FTE Student (Public Associates*)
0 .1 .2 .3 .4 .5 .6 .7 .8 .9 1
Gini Coefficient
2002 2003 2004 2005 2006 2007 2008 2009 2010Academic Year (Ending)
Total (Public Associates*)
Note: *The Gini coefficients for public associates institutions are imprecise because of low sample size. Each year,
only around 16 institutions participated in the NACUBO endowment survey, from which the endowment data
is obtained.
Figure A12: Endowment Gini Coefficients for Private Carnegie Classifications
0 .1 .2 .3 .4 .5 .6 .7 .8 .9 1Gini Coefficient
2002 2003 2004 2005 2006 2007 2008 2009 2010Academic Year (Ending)
Per FTE Student (Private Research)
0 .1 .2 .3 .4 .5 .6 .7 .8 .9 1
Gini Coefficient
2002 2003 2004 2005 2006 2007 2008 2009 2010Academic Year (Ending)
Total (Private Research)
0 .1 .2 .3 .4 .5 .6 .7 .8 .9 1
Gini Coefficient
2002 2003 2004 2005 2006 2007 2008 2009 2010Academic Year (Ending)
Per FTE Student (Private Masters)
0 .1 .2 .3 .4 .5 .6 .7 .8 .9 1
Gini Coefficient
2002 2003 2004 2005 2006 2007 2008 2009 2010Academic Year (Ending)
Total (Private Masters)
0 .1 .2 .3 .4 .5 .6 .7 .8 .9 1
Gini Coefficient
2002 2003 2004 2005 2006 2007 2008 2009 2010Academic Year (Ending)
Per FTE Student (Private Bachelors)
0 .1 .2 .3 .4 .5 .6 .7 .8 .9 1
Gini Coefficient
2002 2003 2004 2005 2006 2007 2008 2009 2010Academic Year (Ending)
Figure A13: Income, Expenditure and Endowment by Quartile among Research Universities
(a) Income by Quartile
0 50 100 150 200
2010 Dollars in Thousands
2002 2003 2004 2005 2006 2007 2008 2009 2010Academic Year (Ending)
q1
q2
q3
q4
Per FTE Student (Research Pub & Pri)
0 1000000 2000000 3000000
2010 Dollars in Thousands
2002 2003 2004 2005 2006 2007 2008 2009 2010Academic Year (Ending)
q1
q2
q3
q4
Total (Research Pub & Pri)
(b) Expenditure by Quartile
0 20 40 60 80 100 1202010 Dollars in Thousands
2002 2003 2004 2005 2006 2007 2008 2009 2010Academic Year (Ending)
q1
q2
q3
q4
Per FTE Student (Research Pub & Pri)
0 500000 1000000 1500000 2000000 2500000
2010 Dollars in Thousands
2002 2003 2004 2005 2006 2007 2008 2009 2010Academic Year (Ending)
q1
q2
q3
q4
Total (Research Pub & Pri)
(c) Endowment by Quartile
0 100 200 300 4002010 Dollars in Thousands
2002 2003 2004 2005 2006 2007 2008 2009 2010Academic Year (Ending)
q1
q2
q3
q4
Per FTE Student (Research Pub & Pri)
0 1500000 3000000 4500000 6000000
2010 Dollars in Thousands
2002 2003 2004 2005 2006 2007 2008 2009 2010Academic Year (Ending)
q1
q2
q3
q4
Total (Research Pub & Pri)
Note: Averages for research universities both public and private as defined by Carnegie Classification. All dollar
amounts are expressed in 2010 dollars; the CPI for Urban Consumers is used to account for changes in the
Figure A14: Income, Expenditure and Endowment Gini Coefficients among Research Universities
(a) Income Gini
0 .1 .2 .3 .4 .5 .6 .7 .8 .9 1
Gini Coefficient
2002 2003 2004 2005 2006 2007 2008 2009 2010Academic Year (Ending)
Per FTE Student (Research Pub & Pri)
0 .1 .2 .3 .4 .5 .6 .7 .8 .9 1
Gini Coefficient
2002 2003 2004 2005 2006 2007 2008 2009 2010Academic Year (Ending)
Total (Research Pub & Pri)
(b) Expenditure Gini
0 .1 .2 .3 .4 .5 .6 .7 .8 .9 1Gini Coefficient
2002 2003 2004 2005 2006 2007 2008 2009 2010Academic Year (Ending)
Per FTE Student (Research Pub & Pri)
0 .1 .2 .3 .4 .5 .6 .7 .8 .9 1
Gini Coefficient
2002 2003 2004 2005 2006 2007 2008 2009 2010Academic Year (Ending)
Total (Research Pub & Pri)
(c) Endowment Gini
0 .1 .2 .3 .4 .5 .6 .7 .8 .9 1Gini Coefficient
2002 2003 2004 2005 2006 2007 2008 2009 2010Academic Year (Ending)
Per FTE Student (Research Pub & Pri)
0 .1 .2 .3 .4 .5 .6 .7 .8 .9 1