Thomson Lear
ning
TM
C H A P T E R3
DOCUMENTING
INFORMATION SYSTEMS
LEARNING OBJECTIVESTo read and evaluate data flow diagrams. To read and evaluate systems flowcharts. To read and evaluate entity-relationship dia-grams.
To prepare data flow diagrams from a narra-tive.
To prepare systems flowcharts from a narra-tive.
A few months ago we sat down and spoke with a recent graduate of our program. We asked him how he has used flowcharting and other documentation techniques in his job. His response follows.
“Auditors and consultants at Pricewaterhouse-Coopers LLP use flowcharts and systems narratives in a variety of engagements, including financial audits, busi-ness process reengineering, and security reviews. During financial audits, auditors review business appli-cations—such as sales, billing, and purchasing—and the processes associated with those applications. To docu-ment each process, the auditor conducts interviews with the process owner, writes a narrative, and ppares accompanying flowcharts. Then, the auditor re-views the narrative with the process owner for accu-racy and completeness. These documents allow an auditor to design the audit, identify areas where con-trols may be needed, and prepare audit findings and recommendations.
“With computer use a necessity in business today, flowcharting is essential in financial audits to allow the auditor—as well as consultants and the business process owners—to see information flows and identify areas where information may be changed, manipulated, or even lost. In addition, with the reliance on automated processing systems for financial information, the IRS now requires flowcharts and narratives to be created and maintained for all automated processing systems used by
businesses.1
“In public accounting, individuals may work on many different types of jobs at many different clients. It is rare that auditors and consultants work with the same sys-tems year after year. This has made it necessary for in-formation systems documentation to be created and maintained for all clients serviced by public accounting firms and carried forward for each subsequent audit or
Thomson Lear
ning
TM
other engagement. Such documentation is usually kept as part of the audit bundle and on
disk, or in the automated working papers.”2
SYNOPSIS
This chapter teaches you to read and prepare documentation to portray aspects of busi-ness processes including their operations and information processes. We show you how to read data flow diagrams, systems flowcharts, and entity-relationship diagrams and to prepare
data flow diagrams and systems flowcharts. In Chapters 4 and 5 we show you how to
pre-pare entity-relationship diagrams. Proficiency with these tools should help you to read and prepare systems documentation, which will help you understand and evaluate business processes, operations activities, and information systems.
Auditors, systems analysts, students, and others use documentation to understand, ex-plain, and improve complex business processes, operations, and information systems, such as an enterprise resource planning (ERP) system. First, consider a typical ERP system.This system probably includes all of the activities associated with receiving a customer order, picking the goods off a warehouse shelf, packing and shipping the goods, and billing the customer. Further, the information system supporting this business process is likely computer-based, has a number of terminals connected to it via telecommunications links, is used by dozens of people within and outside the organization, has hundreds of programs that perform func-tions for virtually every department in the organization, processes thousands of business events and hundreds of requests for management information, and has people throughout the organization preparing inputs and receiving system outputs.
For such a system, we require “pictures,” rather than a narrative description, to “see” and analyze all the activities, inputs, and outputs. Being able to draw these diagrams demonstrates that we understand the system and can explain the system to someone else. For example, with a systems flowchart we can understand and analyze document flows (electronic and paper) through the operations, management, and information processes. Perhaps our analy-sis will lead to system improvements. We are convinced that, after preparing and using sys-tems documentation, you will agree that data flow diagrams, syssys-tems flowcharts, and entity-relationship diagrams are much more efficient (and effective) than narratives for working with complex systems. The application of these tools, even to the relatively simple systems depicted in this textbook, should convince you of this.
In addition to using documentation to understand and improve a system, an organiza-tion can use it for other important purposes. For example, documentaorganiza-tion is used to explain systems and to train personnel. Also, auditors use documentation to describe systems so as to understand the systems and to evaluate the systems’ controls.
INTRODUCTION
We will begin by showing you how to read data flow diagrams, systems flow-charts, and entity-relationship diagrams. Next, we will show you how to prepare data flow diagrams and systems flowcharts. These documentation tools will be used throughout the remainder of the textbook. If you invest time now to study and practice using these tools, your improved understanding of the following chapters will reward your effort. You cannot achieve this chapter’s learning ob-jectives with traditional study methods; you cannot be a passive observer in these
2 Jeffrey S. Trent, PricewaterhouseCoopers LLP, prepared this section. Jeff graduated from Bentley College with a BS in Accountancy.
E R P
Thomson Lear
ning
TM
Chapter 3 Documenting Information Systems 67
proceedings. You must work along with us as we demonstrate these tools. Further, you must practice these tools to develop your skills.
READING SYSTEMS DOCUMENTATION
We will look at three types of systems documentation, data flow diagrams, sys-tems flowcharts, and entity-relationship diagrams. In the following section we will show you how to read and interpret this documentation. First we will look at data flow diagrams.
Reading Data Flow Diagrams
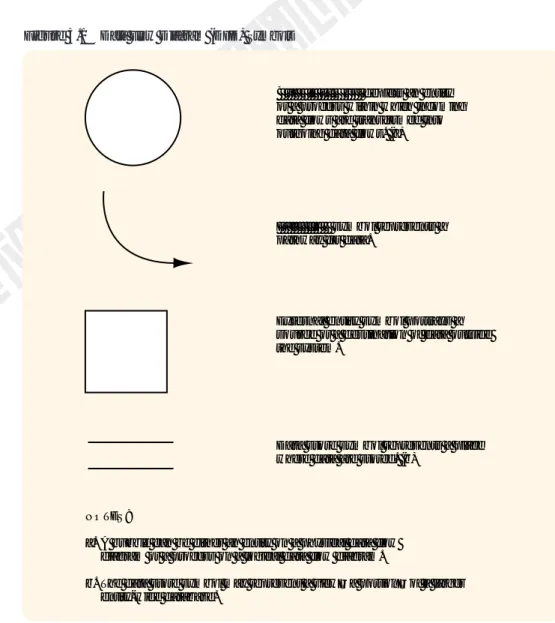
A data flow diagram (DFD) is a graphical representation of a system. A DFD de-picts a system’s components; the data flows among the components; and the sources, destinations, and storage of data. Figure 3.1 shows the four symbols used in a DFD. Study these symbols and their definitions before reading on.
Figure 3.1 Data Flow Diagram (DFD) Symbols
depicts an entity or a process within which incoming data flows are transformed into outgoing data flows. (a) Bubble symbol
symbol represents a pathway for data.
Data flow
External entity symbol portrays a source or a destination of data outside the system.
Data store symbol represents a place where data are stored. (b)
NOTES: a.
b.
A bubble can be either an entity on a physical data flow diagram or a process on a logical data flow diagram.
The data store symbol may represent a view—a portion—of a larger entity-wide database.
Thomson Lear
ning
TM
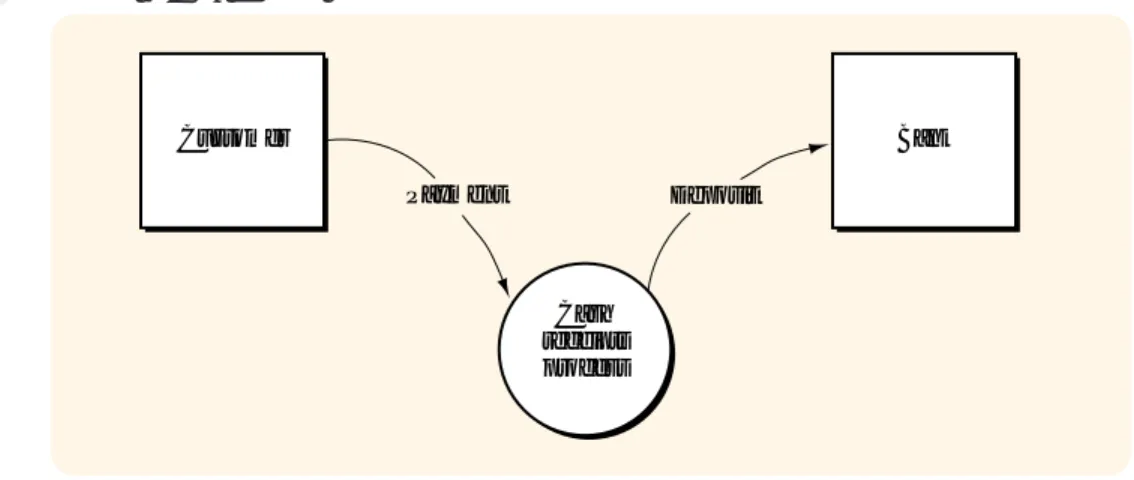
CONTEXT DIAGRAMFigure 3.2 is an example of our first type of DFD, the context diagram. A context diagram is a top-level, or least detailed, diagram of an information system that depicts the system and all of its activities as a single bubble, and shows the data flows into and out of the system and into and out of the external entities. External entities are those entities (i.e., persons, places, or things) outside the system that send data to, or receive data from, the system.3
PHYSICAL DATA FLOW DIAGRAM
A physical data flow diagram is a graphical representation of a system showing the system’s internal and external entities, and the flows of data into and out of these entities. An internal entity is an entity (i.e., person, place, or thing) within the system that transforms data.4Internal entities include, for example,
account-ing clerks (persons), departments (places), and computers (thaccount-ings). Therefore, physical DFDs specify where, how, and by whom a system’s processes are accom-plished. A physical DFD does not tell us what is being accomaccom-plished. For exam-ple, in Figure 3.3 we see that the sales clerk receives cash from the customer and sends cash, along with a register tape, to the cashier. So, we see where the cash goes and how the cash receipts data are captured (that is, on the register tape), but we don’t know exactly what was done by the sales clerk.
Note that the physical DFD’s bubbles are labeled with nouns and that the data flows are labeled so as to indicate how data are transmitted between bubbles. For example, the sales clerk sends Form 66W to bookkeeping. Note that a data store’s location indicates exactly where (in bookkeeping) and a data store’s label indicates
how (in a blue sales book) a system maintains sales records. Finally, whereas the
entity boxes on the context diagram define the external entities in the relevant en-vironment, the bubbles in the physical DFD define the internal entities.
LOGICAL DATA FLOW DIAGRAM
A logical data flow diagram is a graphical representation of a system showing the system’s processes and the flows of data into and out of the processes. We use
log-Figure 3.2 A Context Diagram
Customer Cash receipts process Bank Payment Deposit
3 Used in this manner, entities is a narrower concept than that used in Chapter 1. External entities must be able to send or receive data.
4 Used in this manner, entities is a narrower concept than that used in Chapter 1. Internal entities must be able to transform data.
Thomson Lear
ning
TM
Chapter 3 Documenting Information Systems 69
ical DFDs to document information systems because we can represent the logical nature of a system—what tasks the system is doing—without having to specify
how, where, or by whom the tasks are accomplished. What a system is doing will
change less over time than will how it is doing it. For example, a cash receipts sys-tem will typically receive customer payments and post them to the customer’s ac-count. Over time, however, the form of the payment—cash, check, or electronic funds—and the method of recording—manual or computer—may change.
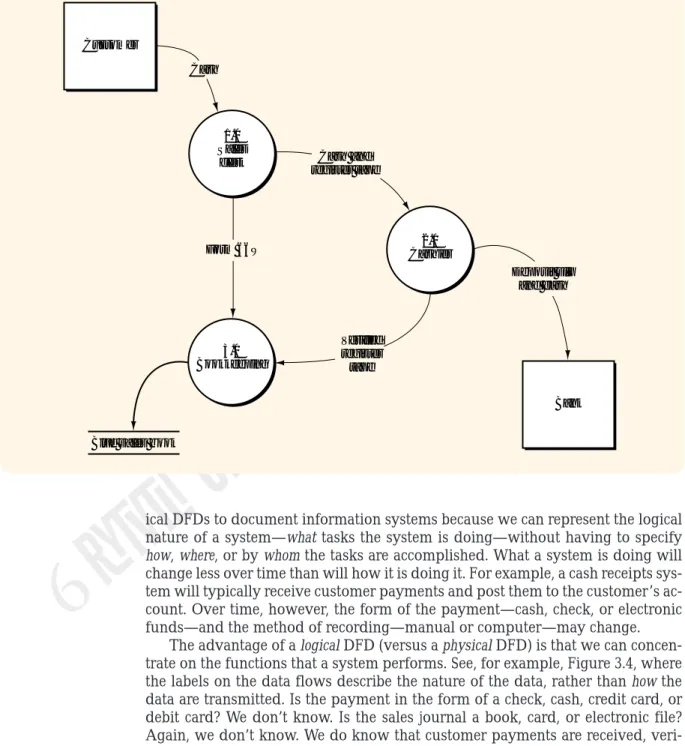
The advantage of a logical DFD (versus a physical DFD) is that we can concen-trate on the functions that a system performs. See, for example, Figure 3.4, where the labels on the data flows describe the nature of the data, rather than how the data are transmitted. Is the payment in the form of a check, cash, credit card, or debit card? We don’t know. Is the sales journal a book, card, or electronic file? Again, we don’t know. We do know that customer payments are received, veri-fied for accuracy, recorded in a sales journal, and deposited in the bank. So, a log-ical DFD portrays a system’s activities, whereas a physlog-ical DFD depicts a sys-tem’s infrastructure. We need both pictures to understand a system completely.
Finally, note that the processes in Figure 3.4 are labeled with verbs that de-scribe the actions being performed, rather than with the nouns as we saw in the physical DFD.
Figure 3.4 is a top-level view of the single bubble in Figure 3.2, the context di-agram. Because all of the bubbles in Figure 3.4 contain numbers followed by a
Figure 3.3 A Physical Data Flow Diagram
Customer 1.0 Sales clerk 2.0 Cashier 3.0 Bookkeeping Bank Cash Cash and register tape Deposit slip and cash Verified register tape Form 66W
Thomson Lear
ning
TM
decimal point and a zero, this diagram is often called a “level 0” diagram.5Notice
that each of the data flows into and out of the context bubble in Figure 3.2 (p. 68) also flow into and out of the bubbles in Figure 3.4 (except for the flows between bubbles, such as “Sales record,” which were contained within the bubble in Figure 3.2). When two DFDs—in this case, the context and the level 0—have equivalent external data flows, we say that the DFDs are balanced. Only balanced sets of DFDs (that is, a context diagram, a logical DFD, and a physical DFD) are correct. To derive Figure 3.4, we have “exploded” the context diagram in Figure 3.2 into its top-level components. We have looked inside the context diagram bubble to see the major subdivisions of the cash receipts process. The successive
subdi-Figure 3.4 A Logical Data Flow Diagram (Level 0 Diagram)
Customer 1.0 Receive payment 2.0 Compare cash and tape 4.0 Record sale Bank Payment Receipts and receipts summary Verified receipts summary Sales record Sales journal 3.0 Prepare deposit Validated receipts Deposit
5 Even though physical DFDs are similarly numbered, we do not use the term “level 0” when referring to a phys-ical DFD because there are no lower-level DFDs.
Thomson Lear
ning
TM
Chapter 3 Documenting Information Systems 71
viding, or “exploding,” of logical DFDs is called top-down partitioning and, when properly performed, leads to a set of balanced DFDs.
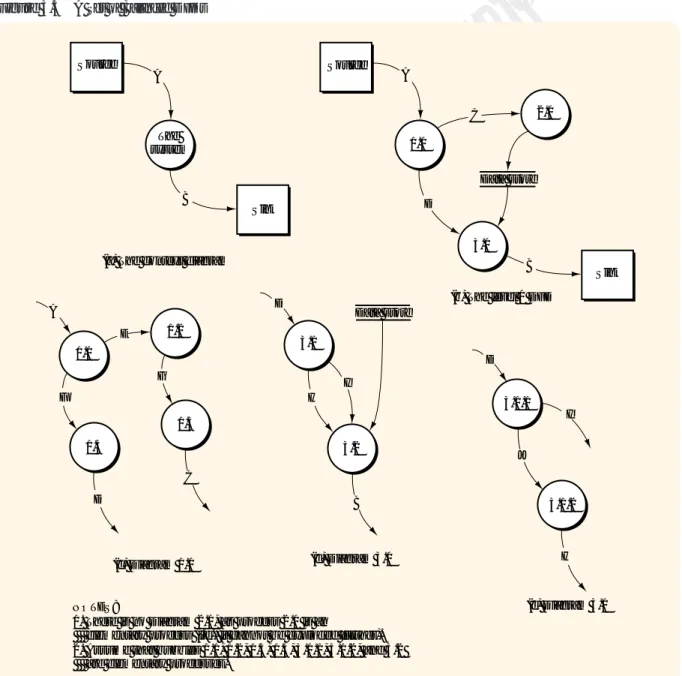
We will use Figure 3.5, which depicts a generic set of balanced DFDs, to study partitioning and balancing. Notice that the level 0 DFD (part b) has the same input “A” and the same output “B” as the context diagram (part a). Now look at part c, an explosion of bubble 1.0. Part c has the same input “A” and the same out-puts “C” and “D” as part b. This relationship must exist because diagram 1.0 (part c) is an explosion of bubble 1.0 in part b. The same can be said for part d, the par-titioning of bubble 3.0. Finally, part e shows Diagram 3.1, a parpar-titioning of bubble 3.1 in part d. Study Figure 3.5 and make sure you understand the relationships among levels in this set of DFDs. While you are studying the figure, you might
Figure 3.5 A Set of Balanced DFDs
Source The system Sink A B Source 1.0 A 2.0 3.0 Sink C D Data store B 1.1 1.4 1.2 1.3 3.1 3.2 3.1.1 3.1.2 A E G C D F H D I Data store B J I D
(a) The context diagram
(b) The level 0 DFD
(c) Diagram 1.0 (d) Diagram 3.0
(e) Diagram 3.1 H
NOTES:
1. There is no Diagram 2.0, as process 2.0 is an
elementary process (i.e., it cannot be exploded further). 2. Assume that bubbles 1.1, 1.2, 1.3, 1.4, 3.1.1, 3.1.2, and 3.2 are elementary processes.
Thomson Lear
ning
TM
also note the convention used to number the bubbles at each level. Also, note that the entity boxes which appear in the context and level 0 diagrams do not usually appear in diagrams below level 0.
Reading Systems Flowcharts
A systems flowchart is a graphical representation of information processes (activi-ties, logic flows, inputs, outputs, and data storage), as well as the related
opera-tions processes (entities, physical flows, and operaopera-tions activities). Containing
manual and computer activities, the systems flowchart presents a logical and physical rendering of the who, what, how, and where of operations and information processes.
The systems flowchart gives us a complete picture of a system by combining the physical and logical aspects of the system. Physical and logical DFDs each de-pict different aspects of a system. In addition, the systems flowchart includes the operations process and management context for a system. These aspects are ig-nored in the DFDs. In addition to DFDs, auditors use systems flowcharts to un-derstand a system and to analyze a system’s controls. In this text, we use systems flowcharts for a similar purpose. Taken together, DFDs and flowcharts provide us with multiple, complementary methods for describing a system.
SYSTEMS FLOWCHARTING SYMBOLS
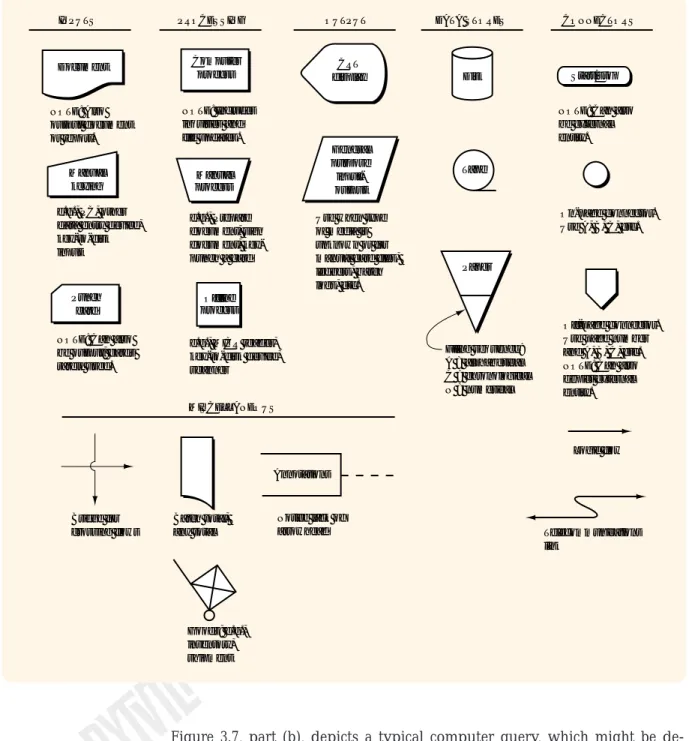
Figure 3.6 shows the systems flowcharting symbols that we will use in this text-book. We have intentionally limited this set to reduce your work in learning the symbols. You should take some time now to study the symbols in Figure 3.6.
COMMON SYSTEMS FLOWCHARTING ROUTINES
Figure 3.7 (pp. 74–75) contains routines often found on systems flowcharts. Follow along with us as we describe each of these routines.
Figure 3.7, part (a), depicts a typical two-step data entry process which might be described as follows:
The data entry clerk keys an input document into a computer terminal. The computer accesses data in data store 1 (perhaps a table of valid codes, such as customer codes) and in data store 2 (perhaps a table of open sales orders) to edit/validate the input. The computer displays the input, including any errors. The clerk compares the input document to the display, keys corrections as necessary, and accepts the input. The computer updates the table in data store 2 and notifies the clerk that the input has been recorded.
Notice the following about Figure 3.7, part (a):
• The edit or validate step may be performed with one or more data stores. • The display is implied with most, if not all, data entry processes.
• By combining the “Edit/validate input” rectangle with the “Record input” rectangle, we could depict this input process in one step without losing much detail about the activities being performed.
• The manual processes undertaken by the clerk are isolated in a separate col-umn to distinguish them from the automated processes undertaken by the computer.
• We show the input document at the bottom of the column to indicate that the document “flows” through the input process.
Thomson Lear
ning
TM
Chapter 3 Documenting Information Systems 73
Figure 3.7, part (b), depicts a typical computer query, which might be de-scribed as follows:
A user keys a query request into a computer terminal. The computer ac-cesses the table(s) in one or more data stores and presents a response to the user.
Notice the following about Figure 3.7, part (b):
• The user and computer activities are again isolated in separate columns. • The display is an implied element of the computer terminal.
Figure 3.6 Systems Flowcharting Symbols
Document Manual keying CRT display Computer process Manual process
INPUTS PROCESSING OUTPUT DATA STORES CONNECTORS
NOTE: Also output document or report.
e.g., PC, other data entry device, key-to-disk input
Punch card
NOTE: Can also be output; cards rarely used. Batch total, any total Bridge for crossing flows NOTE: Includes inquiries and file updates. e.g., Prepare document, sign document, key-punch a card Offline process
e.g., MICR reader, key-to-disk device, scanner General purpose input-output
Use when type of media is unknown or for manual card files, ledgers, batch logs, etc. Disk Tape Paper Filing sequence: A = alphabetical C = chronological N = numerical Start/stop
NOTE: Can also be external entity.
On-page connector. Use A, B, C, etc.
Off-page connector. Use page number and A, B, C, etc. NOTE: Can also depict external entity. Logic flow Telecommunications link MISCELLANEOUS Annotations Notice lack of arrowhead Goods; e.g., inventory, shipment
P
ar
t 1
AIS Foundations
Figure 3.7 Common Systems Flowcharting Routines
Input document Key input Display input or error Edit/validate input Resolve discrepancies if any CLERK COMPUTER Data store 2 Key corrections/ accept input Accepted input Record input USER COMPUTER
Query input Processquery Data store(s) Display Input data Old master data Update New master data
Enter document into computer via keyboard, edit input, record input
NOTE:
The dashed line indicates the master data succession.
(a)
(b) User queries the computer
(c) Update sequential data store Data store 1 COMPUTER Input document Document Accepted input Record input Prepare batch totals USER COMPUTER Trans-action data Key document (d) Documents Exception and summary report Batch totals N NOTE:
The dashed line indicates manual reconciliation of the batch totals.
Preparation and later manual reconciliation of control totals
Prepare exception and summary report At end of batch
Thomson Lear
ning
TM
Chapter 3
Documenting Inf
or
mation Systems
75
Figure 3.7 Common Systems Flowcharting Routines (continued)
Documents Accepted input Record input Input data Key enter Documents Rekey inputs Verified input Verify input
(e) Key and key verify inputs DATA ENTRY CLERK 1 NETWORKED PCs A Documents A DATA ENTRY CLERK 2 Error routine not shown Input document Update data SCANNING CLERK COMPUTER Data store(s) Key data Document image Input document Record image SCANNING CLERK COMPUTER Input image Scan document
(f) Enter document into computer using scanner
Scan document Record data Display image of document DATA ENTRY CLERK
(g) Enter document into computer using scanner and manual keying
Thomson Lear
ning
Thomson Lear
ning
TM
Figure 3.7, part (c), depicts the update of master data stored in a sequential data store and might be described as follows:
Inputs (cash receipts, for example) that had previously been recorded on a magnetic disk are input to the computer, along with the existing (old) master data (accounts receivable master data, for example). The com-puter updates the existing master data and creates a new version of the master data.
Notice the following about Figure 3.7, part (c):
• When sequential master data are updated, we show two data store symbols on a flowchart. One symbol represents the existing (old) version and the other represents the new version.
• A dashed line connects the new with the old master data version to show that the new becomes the old version during the next update process.
Figure 3.7, part (d), depicts the input and reconciliation of computer inputs and might be described as follows:
The user batches the input documents, prepares batch totals, and keys the documents into the computer. The computer records the inputs on a disk and notifies the user as each input is accepted. The user files the input documents in numerical sequence. At the end of the batch, the computer prepares an exception and summary report that includes batch totals. The user compares the computer batch totals to those pre-pared prior to entry of the documents.
Notice the following about Figure 3.7, part (d):
• The annotation makes it clear that the computer prepares the exception and summary report after the user has completed entry of the batch.
• The user’s comparison of the batch totals is depicted with a dashed line in-stead of the manual process symbol.
• If the batch totals had been input with the batch, the computer—rather than the user—could compare the batch totals.
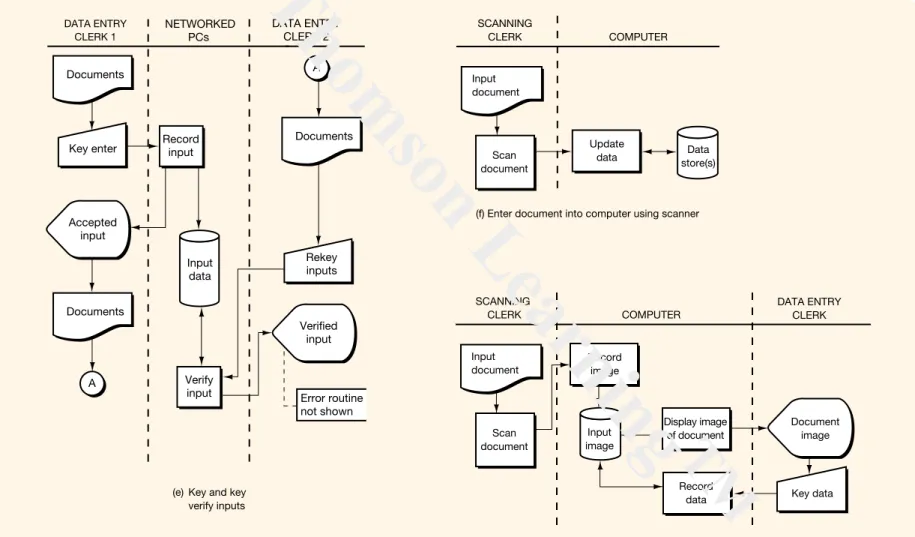
Figure 3.7, part (e), depicts the entry and key verification of inputs into a net-worked personal computers system and might be described as follows:
A data entry clerk (perhaps clerk 1) enters documents into a networked PC system. The system records the inputs on a disk and notifies the user of the acceptance of each input. The documents are then forwarded to a different clerk (say clerk 2) who keys the documents again.6Differences
are resolved and the event data are updated to reflect the verifications and corrections.
Notice the following about Figure 3.7, part (e):
• The networked PCs are an offline device and should be depicted with a square—rather than a rectangle—and in a column separate from the com-puter.
• We show the data entry clerks in two columns to emphasize that the keying and verification are performed by two different clerks.
C O N T R O L S
C O N T R O L S
6 The majority of data processing errors occur at the data entry stage and the majority of those errors can be at-tributed to misreading or miskeying the input. Because it is unlikely that two different clerks will make the same reading or keying mistake, the re-keying by a different clerk will discover the majority of these errors.
Thomson Lear
ning
TM
Chapter 3 Documenting Information Systems 77
• Clerk 2 probably follows an established procedure to reconcile differences found during the verification step. We use the annotation to suggest the exis-tence of these procedures.
Figure 3.7, part (f), depicts the entry and recording of an input using a scan-ner and might be described as follows:
A clerk scans a document into the computer. Using the data from the scanned document, the computer updates the data located on one or more data stores.
Notice the following about Figure 3.7, part (f):
• We represent the scanner with the offline process symbol.
• We could include a display coming from the scanner, showing the clerk the document that had just been scanned.
• To be able to read data from the document, the scanner must have optical character recognition (OCR) capabilities.7
Figure 3.7, part (g), depicts the entry and recording of an input using a scan-ner and a keyboard and might be described as follows:
A clerk scans a document into the computer. The computer routes an image of the scanned input to a data entry clerk, who keys data from the document’s image into the computer. The computer records the keyed data with the scanned document.
You should quickly become reasonably proficient in reading flowcharts if you learn these routines. You may encounter many different flowcharting meth-ods during your career, but the principles you learn here will carry over to those techniques.
Reading Entity-Relationship Diagrams
As we mentioned in the preface to this book, as an accountant you will likely be performing one or more of three functions. You might be (1) an auditor of an AIS, (2) a designer of an AIS, or (3) a user (and/or evaluator) of an AIS. To effectively per-form aspects of these roles, you must be aware of the procedures perper-formed to de-velop and install an AIS. Systems dede-velopment procedures include two concur-rent, and often inseparable, processes: the development of the system functions and the development of the database. Specifications for the system functions are often portrayed using DFDs, while specifications for the database are often de-picted using entity-relationship diagrams.
As we will learn in Chapters 4 and 5, a data model depicts user requirements for data in the database. The model is expressed as a structure of entities and
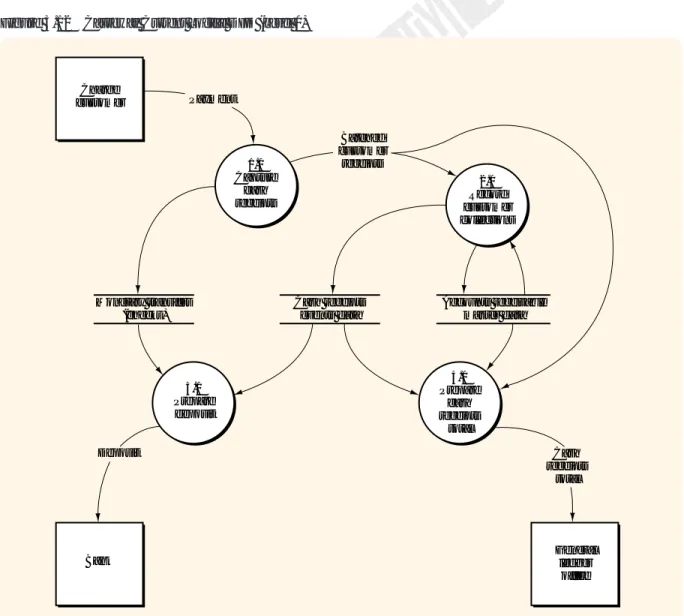
relationships among those entities. Figure 3.8 depicts a data model expressed as
an entity-relationship diagram. An entity-relationship diagram (also called an E-R diagram) reflects the system’s key entities and the relationships among those entities and is commonly used to represent a data model. The rectangles are called “entities” and the diamonds are called “relationships.” We use the E-R diagram because it helps us develop a logical model of the data—the entities
Thomson Lear
ning
TM
and relationships—in a way that is independent of the way that we will physi-cally implement the database.8
The diamond (i.e., relationship) on the left side of this diagram tells us that an order is received from a customer. The formal notation is ORDER received from CUSTOMER. We might be confused by the diagram and want to say “CUS-TOMER received from ORDER.” But we can usually interpret the diagram correctly by knowing the sense of the relationship.
In Figure 3.8, the “N” beneath the ORDER rectangle tells us that each cus-tomer may have more than one order; the “1” above the CUSTOMER rectangle tells us that each order is from only one customer. This, the first of three relation-ship categories, is called “one to N,’’ and the notation is 1:N (or “N to one” and noted as N:1).
The second relationship category is called “M to N,” and the notation is M:N. In Figure 3.8, we see that each INVENTORY item has many ORDERs, and each ORDER has many INVENTORY items (a many to many relationship). Figure 3.8 also tells us that there are many SALEs (shipments) for each inventory item and that each SALE (shipment) consists of many line items of inventory.
There is a third relationship category, called “one to one,” and it uses the nota-tion 1:1. If, in Figure 3.8, only one SALE (shipment) filled an ORDER, there would be a 1:1 relationship between ORDER and SALE. In Chapters 4 and 5, we explore how to prepare an E-R diagram.
Figure 3.8 Entity-Relationship (E-R) Diagram
ORDER INVENTORY
CUSTOMER SALE
line item
received
from itemline
made to fills M N N M N N N 1 1 1
8 Logical versus physical is a common theme in systems work. Earlier we introduced logical and physical DFDs. In Chapters 4–5 and Chapters 15–18 (systems development), we emphasize the notion that to develop good sys-tems—including good databases—logical design must precede physical design and implementation.
Thomson Lear
ning
TM
Chapter 3 Documenting Information Systems 79
PREPARING SYSTEMS DOCUMENTATION
In this section we show you how to prepare data flow diagrams and systems flowcharts. The DFDs we will be creating are context diagrams, physical DFDs, and logical DFDs. We will also give you our own tried and true guidelines for cre-ating DFDs and systems flowcharts. As we mentioned earlier in this chapter, you will learn these concepts best by studying and practicing these steps as you go along.
Preparing Data Flow Diagrams
We use DFDs in two main ways. We may draw them to document an existing sys-tem, or we may create them from scratch when developing a new system. Construction of DFDs for new systems will be described in the systems develop-ment chapters (Chapters 15 through 18). In this section, we explain a process for deriving a set of DFDs from a narrative that describes an existing system.
THE NARRATIVE
Figure 3.9 contains a narrative describing the cash receipts system for Causeway Company. The first column indicates the paragraph number; the second column contains the line number for the text of the narrative. We describe here an orderly method for drawing the DFDs for the Causeway system. You will get the most benefit from this section if you follow the instructions carefully, perform each step as directed, and don’t read ahead. As you follow along with us, you may want to draw your diagrams by hand or use the software package of your choice.
TABLE OF ENTITIES AND ACTIVITIES
Our first step is to create a table of entities and activities. In the long run, this list will lead to quicker and more accurate preparation of DFDs and a systems flow-chart because it clarifies the information contained in a narrative and helps us to document the system correctly.
To begin your table, go through the narrative line by line and circle each ac-tivity being performed. An acac-tivity is any action being performed by an internal or external entity. Activities can include actions related to data (originate, trans-form, file, or receive) or to an operations process. Operations process activities might include picking goods in the warehouse, inspecting goods at the receiving dock, or counting cash. For each activity there must be an entity that performs the activity. As you circle each activity, put a box around the entity that performs the activity.
Now you are ready to prepare your table. List each activity in the order that it
is performed, regardless of the sequence in which it appears in the narrative. List the
ac-tivity, along with the name of the entity that performs the activity and the para-graph number indicating the location of the activity in the narrative. After you have listed all activities, consecutively number each activity.
Compare your table to Table 3.1 (p. 81). Notice that the narrative refers to some entities in more than one way. For example, we have “accounts receivable” and the “clerk” on line 15. Why do we list the “online terminal” with the com-puter? Because the terminal does not appear to be performing any processing but seems to be part of the central computer. Notice that we listed both activity 7 and activity 8. It might be that activity 7 describes activity 8 and does not need to be
Thomson Lear
ning
TM
listed itself. However, it is better to list doubtful activities than to miss an activity. See how we listed activity 11, found on lines 22 and 23. We changed to the active form of the verb “notify” so that we could show the activity next to the entity that performs the action. Before reading on, resolve any differences between your list of entities and activities and those in Table 3.1.
DRAWING THE CONTEXT DIAGRAM
We are now ready to draw the context diagram. Since a context diagram consists of only one circle, we begin our context diagram by drawing one circle in the
cen-Figure 3.9 Narrative of the Causeway Cash Receipts System Para Line Text
1 1 Causeway Company uses the following 2 procedures to process the cash received from 3 credit sales. Customers send checks and 4 remittance advices to Causeway. The 5 mailroom clerk at Causeway endorses the 6 checks and writes the amount paid and the 7 check number on the remittance advice. 8 Periodically, the mailroom clerk prepares a 9 batch total of the remittance advices and 10 sends the batch of remittance advices to 11 accounts receivable, along with a copy of 12 the batch total. At the same time, the 13 clerk sends the corresponding batch of 14 checks to the cashier.
2 15 In accounts receivable, a clerk enters 16 the batch into an online terminal by keying 17 the batch total, the customer number, the 18 invoice number, the amount paid, and the 19 check number. After verifying that the 20 invoice is open and that the correct amount 21 is being paid, the computer updates the 22 accounts receivable master data. If there 23 are any discrepancies, the clerk is notified. 3 24 At the end of each batch (or at the
25 end of the day), the computer prints a 26 deposit slip in duplicate on the terminal 27 in the cashier's office. The cashier 28 compares the deposit slip to the 29 corresponding batch of checks and then 30 takes the deposit to the bank.
4 31 As they are entered, the check number 32 and the amount paid for each receipt are 33 logged on disk. This event data is used to 34 create a cash receipts listing at the end of 35 each day. A summary of customer accounts 36 paid that day is also printed at this time. The 37 accounts receivable clerk compares these 38 reports to the remittance advices and batch 39 totals and sends the total of the cash 40 receipts to the general ledger office.
Thomson Lear
ning
TM
Chapter 3 Documenting Information Systems 81
ter of our paper. Next, we must draw the external entity boxes. To do this, we must decide which of the entities in Table 3.1 are external and which are internal to the system.
DFD guideline 1:
Include within the system context (bubble) any entity that performs one or more information processing activities.
Information processing activities are those activities that retrieve data from storage, transform data, or file data. Information processing activities include document preparation, data entry, verification, classification, arrangement or sorting, calculation, summarization, and filing—both manual and automated. The sending and receiving of data between entities are not information process-ing activities because they do not transform data. If we send data to another en-tity, we do not process data. If, however, we file data, we do perform an informa-tion processing activity. Likewise, if we receive data from another entity, we do not perform an information processing activity. However, if we retrieve data from a file or table, we do perform an information processing activity. Operations process activities are not information processing activities.
To discover which entities perform no information processing activities, we must inspect the table of entities and activities and mark those activities that are not information processing activities. Any entities that do not perform any infor-mation processing activities will be external entities; the remaining entities will be
internal. Review your table of entities and activities and mark all activities that do
not perform information processing activities. These marked activities—mostly sends and receives—indicate your data flows.
Table 3.1 Table of Entities and Activities for Causeway Cash Receipts System
Entities Para Activities
Customers 1 1. Send checks and remittance advices. Mailroom (clerk) 1 2. Endorses checks.
Mailroom (clerk) 1 3. Writes the amount paid and the check number on the remittance advice.
Mailroom (clerk) 1 4. Prepares a batch total of the remittance advices.
Mailroom (clerk) 1 5. Sends the batch of remittance advices and a copy of the batch total to the accounts receivable clerk.
Mailroom (clerk) 1 6. Sends the batch of checks to the cashier. Accounts receivable (clerk) 2 7. Enters the batch into the online terminal.
Accounts receivable (clerk) 2 8. Keys the batch total, the customer number, the invoice number, the amount paid, and the check number.
Computer (online terminal) 2 9. Verifies that the invoice is open and that the correct amount is being paid.
Computer (online terminal) 2 10. Updates the accounts receivable master data. Computer (online terminal) 2 11. Notifies the clerk of errors.
Computer (online terminal) 4 12. Logs events. Computer (online terminal) 3 13. Prints a deposit slip.
Cashier 3 14. Compares the deposit slip with the batch of checks. Cashier 3 15. Takes the deposit to the bank.
Computer (online terminal) 4 16. Creates a cash receipts listing.
Computer (online terminal) 4 17. Prints a summary of customer accounts paid.
Accounts receivable (clerk) 4 18. Compares the computer reports with the remittance advices and batch totals.
Thomson Lear
ning
TM
You should have indicated activities 1, 5, 6, 15, and 19 because these activities only send or receive data. As we mentioned earlier, activity 7 only describes ac-tivity 8 and can also be marked. Finally, acac-tivity 11 can be marked because of the following guideline:
DFD guideline 2:
For now, include only normal processing routines, not exception routines or error routines, on context diagrams, physical DFDs, and level 0 logical DFDs.
Because activity 11 occurs only when the payment data contain an error, we will not consider this activity for now.
Your table of entities and activities, with certain noninformation processing activities marked, should indicate that the mailroom, accounts receivable, cashier, and computer perform information processing activities and will be included in our diagrams as internal entities. The customer, on the other hand, does not per-form any such activities and will be an external entity.
Are there other external entities to be included in our diagrams? To answer this question you must go through the narrative one more time and put a box around those entities not yet marked. You should find that the bank (line 30) and the general ledger office (line 40), in this system, do not perform information pro-cessing activities. These entities, along with the customer, are external entities and are included in the context diagram as sources or destinations of data. We now have three external entities, four internal entities and nineteen activities. No other
entities or activities are to be added because of the following guideline: DFD guideline 3:
Include in the systems documentation all (and only) activities and entities described in the system narrative—no more, no less.
When we say narrative, we are talking about the narratives that you will find as problem material in this book. You are to assume, in those cases, that the nar-rative is complete and accurate. However, when you prepare a narnar-rative to docu-ment a real-world case, you cannot assume that your narrative is perfect. When you have verified that your narrative is complete and that it accurately reflects re-ality, you must then follow DFD guideline 3.
Because there are three entities external to the Causeway cash receipts sys-tem—the customer, the bank, and the general ledger office—you must draw on your paper three boxes surrounding the one context bubble. Next, draw and label the data flows that connect the external entities with the bubble. Since logical (versus physical) labels are normally used on a context diagram, you should do your best to derive logical labels for the flows. The final step is to label the con-text bubble. Write a descriptive label that encompasses the processing taking place within the system. Our label in Figure 3.10 indicates the scope of the Causeway system—namely, cash receipts from charge customers. The Causeway system does not include cash receipts from any other source.
Figure 3.10 is the completed Causeway context diagram. Compare it to your context diagram and resolve any differences. Notice that we include a single square for many customers. Likewise, although we may use several banks, we have a single bank square. The following guideline applies:
DFD guideline 4:
Thomson Lear
ning
TM
Chapter 3 Documenting Information Systems 83
DRAWING THE CURRENT PHYSICAL DATA FLOW DIAGRAM
To keep the current physical DFD balanced with the context diagram, start your current physical DFD by drawing the three external entities from the context dia-gram near the edges of a piece of paper. Next, draw and label each data flow going into the two destinations and coming out of the single source. Leave the center of the page, into which we will sketch the rest of the diagram, blank. Since this is a physical DFD, the data flows should have labels that describe the means by which the flow is accomplished. For example, the “Payment” from the cus-tomer should now be labeled “Checks and remittance advices,” and the “Deposit” should now be labeled “Deposit slip and checks.”
Because each internal entity listed in Table 3.1 (p. 81) becomes a bubble in our physical DFD, we know that our current physical DFD will contain four bubbles: one each for the mailroom, cashier, accounts receivable, and computer. We will add these four bubbles by first drawing the bubbles on our diagram that are con-nected to the sources and destinations. During this process, you must consider all send and receive activities and the implied reciprocal activities. (Many of these were marked earlier to indicate that they were not data processing activities.) For example, activity 1 indicates that the customer sends the checks and remittance advices. Draw and label a mailroom bubble, an accounts receivable bubble, and a cashier bubble. Use a data flow symbol to connect these bubbles to their related external entities.
To complete the physical DFD, we must go through the table of entities and ac-tivities once again and draw all the remaining entities and flows. Follow along with us as we complete the diagram. Activity 5 indicates a connection between the mailroom and accounts receivable. Activity 6 indicates a connection between the mailroom and the cashier. Activity 8 tells us that the accounts receivable clerk en-ters data into the computer. Draw the computer bubble, label it “4.0,” and connect
Figure 3.10 Causeway Context Diagram
Charge customer Cash receipts on account system
Bank Generalledger
office Payment
Deposit Cash
receipts total
Thomson Lear
ning
TM
it to accounts receivable. To perform activity 18, accounts receivable must receive the reports from the computer. Draw and label one or two flows (we chose two flows) from the computer to accounts receivable. To perform activity 14, the cashier must receive the deposit slip from the computer. Activity 16 implies that the table of accounts receivable master data must be read so that the open invoice record can be retrieved. Draw the data store for the accounts receivable master table and a flow from the data store to the computer bubble. Notice that the label on the data store shows that the physical storage medium is a disk. We draw a flow only from the data store because a data request is not a flow of data. Therefore, we do not show the request for the open invoice record. The movement of the record out of the data store in response to this request is a flow of data and is shown. Notice that we did not show a flow from the accounts receivable data store di-rectly to the accounts receivable bubble. Because the accounts receivable data store is on a computer disk, only the computer can read from or write to that disk. This also excludes any direct connection between computerized data stores. To update the data on one computerized data store from another, you must go through a computer bubble.
Because the open invoice record must be read into the computer, updated, and then written back to the accounts receivable master table, activity 10 requires a data flow from and a data flow to the accounts receivable data store. Because we already drew a flow from the data store for activity 9, we need only draw a flow back to the data store. Activity 12 requires that we draw a data store for the cash receipts log and that we draw a data flow from the computer into that data store, whereas activity 13 requires that we draw a flow from the data store. Finally, to depict the flow of data required to print the reports indicated in activities 16 and 17, we need to draw flows from both data stores into the computer. You may think that all the flows into and out of the data stores aren’t necessary. We offer a sug-gestion in the form of a guideline:
DFD guideline 5:
For clarity, draw a data flow for each flow into and out of a data store. You may, also for clarity and to help you determine that you have included all necessary flows, label each flow with the activity number that gives rise to the flow or with a description of the flow (e.g., “retrieve accounts receiv-able master data”).
Figure 3.11 is the completed Causeway current physical DFD. Compare it to your diagram and, before reading on, resolve any differences. You should notice that there is a data store of endorsed checks connected to the cashier. This file, not mentioned in the narrative, was added to show that the cashier must retain batches of checks until the deposit slip is printed on the computer terminal. We offer the following guideline:
DFD guideline 6:
If a data store is logically necessary (that is, because of a delay between processes), include a data store in the diagrams, whether or not it is men-tioned in the narrative.
Should we draw a data store to show that the remittance advice batches and batch totals are retained in accounts receivable until the computer reports are re-ceived? We could. You must use DFD guideline 6 carefully, however, so that you don’t draw DFDs that are cluttered with data stores and are therefore difficult to read. You will need to use your judgment. Does this guideline contradict DFD
Thomson Lear
ning
TM
Chapter 3 Documenting Information Systems 85
guideline 3? No. DFD guideline 3 tells you to include in your diagrams only those activities included in your narrative, while DFD guideline 6 tells you to com-pletely describe those activities. So, if the narrative implies an activity or data store, include it in the diagrams. How about an example that would violate DFD guideline 6? Because they are outside the context of this particular system, the fol-lowing activities are not described in the narrative (Figure 3.9, p. 80) and should not be included in the diagrams:
• The actual update of the general ledger data • Cash receipts from cash sales
• Customer billing
DRAWING THE CURRENT LOGICAL DATA FLOW DIAGRAM
The current logical DFD portrays the logical activities performed within the sys-tem. Level 0 DFDs depict a particular grouping of the logical activities, so we start the level 0 DFD by enumerating the activities in the system and then group those activities. If you have been following along with us, you already have a list of the activities to be included in the level 0 DFD. Do you know what that list is? The ac-tivities to be included in the level 0 DFD are the unmarked acac-tivities on the table of entities and activities, Table 3.1 (p. 81). Our list includes activities 2, 3, 4, 8, 9,
Figure 3.11 Causeway Current Physical DFD
Charge customer 1.0 Mailroom Checks and remittance advices Endorsed checks 3.0 Cashier 2.0 Accounts receivable 4.0 Computer
Bank Generalledger
office Deposit slip and checks Annotated remittance advices and copy of batch total Cash receipts listings Summary of customer
accounts paid Batch total, customer number,
invoice number, amount paid, and
check number Cash receipts total Accounts receivable master data—disk Cash receipts log—disk Deposit slip Endorsed checks
Thomson Lear
ning
TM
10, 12, 13, 14, 16, 17, and 18. Recall that, at this time, we don’t consider any other activities because the other activities either are actions performed in other-than-normal situations and therefore not included on a level 0 DFD, are actions that merely send or receive data rather than transform data, or are operations process activities, such as picking goods. Several guidelines will help us to group the ac-tivities remaining in our list:
DFD guideline 7:
Group activities if they occur in the same place and at the same time. For example, the clerk performs activities 2 and 3 in the mailroom as each pay-ment is received.
DFD guideline 8:
Group activities if they occur at the same time but in different places. For example, the cashier performs activity 14 “immediately” after the com-puter prints the deposit slip in activity 13.
DFD guideline 9:
Group activities that seem to be logically related. DFD guideline 10:
To make the DFD readable, use between five and seven bubbles.9
To start preparing your logical DFD, try bracketing the activities in Table 3.1 (p. 81) as you believe they should be grouped (do not consider the marked activ-ities). For example, if we apply DFD guideline 7 (that is, same time and same place), we could combine activities 2 and 3; activities 9, 10, and 12; and activities 16 and 17. Although this would provide a satisfactory solution, there would be eight bubbles, and there would be several bubbles containing only one activity. Since we prefer not to have too many single-activity bubbles until we get to the lowest-level DFDs, we proceed with further groupings.
If we apply DFD guideline 8 (that is, same time but different place) to the pre-ceding grouping, we could combine activity 8 with 9, 10, and 12; 13 with 14; and 16 and 17 with 18. This solution is also fine, and is better than our first solution because we now have five bubbles and only one single-activity bubble.
If we apply DFD guideline 9 (that is, logically related activities), we can com-bine activities 2, 3, and 4. Although this leaves us with only four bubbles, this so-lution is superior to the first two because we have no single-activity bubbles.
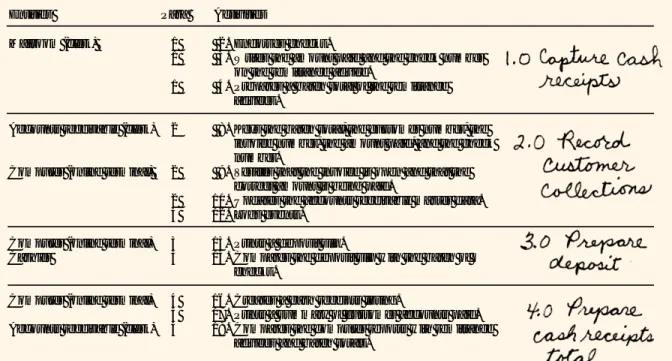
In summary, our groups are: • Group 1: activities 2, 3, 4 • Group 2: activities 8, 9, 10, 12 • Group 3: activities 13, 14 • Group 4: activities 16, 17, 18
After we choose our groupings, we must give each group a name that de-scribes the logical activities within the group. For Causeway, we chose the fol-lowing labels:
• Group 1 (activities 2, 3, 4) is bubble 1.0 and is labeled “Capture cash receipts” because that bubble comprises all the activities after the payment is sent by the customer until the payment is keyed into the computer.
9 For very simple systems, such as those described in the narratives in this textbook, your solutions may have fewer than five bubbles.
Thomson Lear
ning
TM
Chapter 3 Documenting Information Systems 87
• Group 2 (activities 8, 9, 10, 12) is bubble 2.0 and is labeled “Record customer collections” because the activities in bubble 2.0 record the payment in the cash receipts events table and the accounts receivable master table.
• Group 3 (activities 13 and 14) is bubble 3.0 and is labeled “Prepare deposit” because the activities generate a deposit slip and send the deposit to the bank. • Group 4 (activities 16, 17, 18) is bubble 4.0 and is labeled “Prepare cash re-ceipts total” because that is the main purpose of the reporting and compari-son that takes place.
Mark these groups and labels on Table 3.1 (p. 81).
Table 3.2 demonstrates how you should annotate your table of entities and tivities. (Notice that we have not carried forward from Table 3.1 the marked ac-tivities.) Follow along with us now as we draw the current logical DFD for Causeway. You’ll need paper and pencil (or your computer), the Causeway con-text diagram (Figure 3.10, p. 83), the Causeway current physical DFD (Figure 3.11, p. 85), your annotated table of entities and activities (Table 3.2), and your original table of entities and activities (Table 3.1). To draw the logical DFD, you should begin in the same manner that you began to draw the current physical DFD. Draw the external entities near the edges of a piece of paper. Draw and label flows to and from the external entities, while leaving the center of the page blank to re-ceive the remainder of the diagram. Because this is a logical DFD, the data flows to and from the entities must have logical descriptions (for example, the descrip-tions used on the context diagram).
After we have completed the external flows, we can begin to draw the inter-nal bubbles and flows. The “Payment” from the “Charge customer” is the input to bubble 1.0. Activities 2, 3, and 4 happen within the bubble. What are the outputs? The endorsed checks leave bubble 1.0 (see activity 6 in Table 3.1). For the logical
Table 3.2 Entities and Activities for Causeway Cash Receipts System (Annotated)
Entities Para Activities
Mailroom (clerk) 1 2. Endorses checks.
1 3. Writes the amount paid and the check number on the remittance advice.
1 4. Prepares a batch total of the remittance advices.
Accounts receivable (clerk) 2 8. Keys the batch total, the customer number, the invoice number, the amount paid, and the check number.
Computer (online terminal) 2 9. Verifies that the invoice is open and that the correct amount is being paid.
2 10. Updates the accounts receivable master data. 4 12. Logs events.
Computer (online terminal) 3 13. Prints a deposit slip.
Cashier 3 14. Compares the deposit slip with the batch of checks.
Computer (online terminal) 4 16. Creates a cash receipts listing.
4 17. Prints a summary of customer accounts paid. Accounts receivable (clerk) 4 18. Compares the computer reports with remittance
Thomson Lear
ning
TM
DFD, we’ll call this flow “Monetary transfers.” The other data flow out from bub-ble 1.0 was called “Annotated remittance advices and copy of batch total” (see ac-tivity 5 in Table 3.1, p. 81). For the logical DFD, let’s call it “Batched customer re-ceipts.” Before moving on, compare your drawing to bubble 1.0 in Figure 3.12.
The batched customer receipts are the input to bubble 2.0. In response to the keying action (activity 8), a record is read from the accounts receivable master table. Draw the data store for this table (remember, use a logical label) and a flow
from the data store into bubble 2.0. Activity 9 occurs within the bubble. What are
the outputs? Activity 10 indicates a flow to the accounts receivable master table, and activity 12 indicates a flow to the cash receipts events table. Draw the data store for the events data and the flows into that data store and into the accounts receivable data store. Before moving on, compare your drawing to bubble 2.0, Figure 3.12.
Now we must draw bubble 3.0. To accomplish activity 13, bubble 3.0 must ob-tain the records conob-tained in the cash receipts events table. Draw a flow from that
Figure 3.12 Causeway Current Logical DFD (Level 0)
Charge customer 1.0 Capture cash receipts 2.0 Record customer collections 4.0 Prepare cash receipts total 3.0 Prepare deposit Monetary transfers (checks) Cash receipts events data Accounts receivable master data Payment Deposit
Bank Generalledger
office Cash receipts total Batched customer receipts
Thomson Lear
ning
TM
Chapter 3 Documenting Information Systems 89
table’s data store into bubble 3.0. To perform activity 14, bubble 3.0 must obtain the records stored in the monetary transfers data store. Draw a flow from that data store into bubble 3.0. What are the outputs from bubble 3.0? Activity 15 in Table 3.1 (p. 81) indicates that bubble 3.0 should be connected to the flow “Deposit” going into the bank. Before moving on, compare your drawing to bub-ble 3.0 in Figure 3.12.
Finally, let’s draw bubble 4.0. To create a cash receipts listing (activity 16), bub-ble 4.0 must obtain the records contained in the cash receipts events tabub-ble. Draw a flow from that table’s data store into bubble 4.0. To print a summary of customer accounts paid (activity 17), bubble 4.0 must obtain the records stored in the ac-counts receivable master table. Draw a flow from that table’s data store into bub-ble 4.0. To perform activity 18, bubbub-ble 4.0 must obtain the data contained on the remittance advices and batch totals. Where are those data? They are in the flow “Batched customer receipts” that went into bubble 2.0. Since bubble 4.0 must also obtain those data, we must split that flow and connect it to both bubble 2.0 and to bubble 4.0.
We have finished drawing the Causeway current logical DFD. Compare your diagram to the solution in Figure 3.12. Resolve any discrepancies. Your diagram should look like that in Figure 3.12 if you use the groupings we described. Many other groupings are possible within the guidelines. Each different grouping should lead to a different logical DFD.
SUMMARY OF DRAWING DATA FLOW DIAGRAMS
First and foremost, don’t let the rigor of the documentation get in the way of using the diagrams to understand the system. We have presented many guide-lines, hints, and instructions to help you draw DFDs. Use your judgment in ap-plying this information.
There will be times when an operations process function performs information processing activities. Here are a few new DFD guidelines and examples that didn’t come up when we drew the Causeway DFDs. For example, when the re-ceiving department (primarily an operations process unit) prepares a document indicating how many widgets have been received, it is performing an information processing activity. The warehouse and the shipping department are other oper-ations process units that often perform information processing activities. The fol-lowing guideline applies:
DFD guideline 11:
A data flow should go to an operations process entity square only when op-erations process functions (that is, work-related functions such as storing goods, picking goods from the shelves, packaging the customer’s order, and so on) are to be performed by that entity. A data flow should enter an entity bubble if the operations process entity is to perform an information processing activity.
For example, when an operations process entity is receiving goods, a physical DFD could show either a “receiving” box or a “receiving” bubble, whereas the logical DFD might show either a receiving department box or a “Complete re-ceiving report” bubble.
DFD guideline 12:
On a physical DFD, reading computer data stores and writing to computer data stores must go through a computer bubble.
Thomson Lear
ning
TM
DFD guideline 13:On a logical DFD, data flows cannot go from higher- to lower-numbered bubbles.
If on a logical DFD you have a data flow going back to a previous processing point (that is, to a lower-numbered bubble), you have a physical representation of the flow or process. Flows may, however, flow backwards to a data store.
Aren’t there occasions when processing can’t proceed as planned? Yes, there are—in such cases processes called exception routines or error routines handle the required actions. These are processes for out-of-the-ordinary (exceptional) or erroneous events data. Processing that is performed in other-than-normal situa-tions should be documented below the level 0 DFD with reject stubs that indicate that exceptional processing must be performed. A reject stub is a data flow as-signed the label “Reject” that leaves a bubble but does not go to any other bubble or data store. These reject stubs, which are shown only in lower-level diagrams, may be added without bringing the set of diagrams out of balance.
Preparing Systems Flowcharts
In this section we describe the steps for preparing a systems flowchart. The fol-lowing guidelines outline our basic flowcharting technique. Study each guideline before proceeding.
Systems flowcharting guideline 1:
Divide the flowchart into columns: one column for each internal entity and one for each external entity. Label each column.
Systems flowcharting guideline 2:
Flowchart columns should be laid out so that the flowchart activities flow from left to right, but you should locate columns so as to minimize crossed lines and connectors.
Systems flowcharting guideline 3:
Flowchart logic should flow from top to bottom and from left to right. For clarity, put arrows on all flow lines.
Systems flowcharting guideline 4:
Keep the flowchart on one page. If you can’t, use multiple pages and con-nect the pages with off-page concon-nectors. Do not glue, tape, staple, or oth-erwise “extend” your flowchart page to get the flowchart onto one page. To use an off-page connector, draw the symbol shown in Figure 3.6 (p. 73) at the point where you leave one page and at the corresponding point where you begin again on the next page. If you leave page 1 for the first time and you are going to page 2, then the code inside the symbol should be “P. 2, A” on page 1 and “P. 1, A” on page 2. That is, you point to page 2 from page 1 and you point back to page 1 from page 2. Disciplining yourself to draw flowcharts on paper of lim-ited size is essential when you must draw flowcharts on standardized forms for workpapers and systems documentation. Also, as you might expect, computer-ized flowcharting packages will print your flowcharts only on paper that will fit in your printer!
Systems flowcharting guideline 5:
Within each column, there must be at least one manual process, keying op-eration, or data store between documents. That is, do not directly connect documents within the same column.
Thomson Lear
ning
TM
Chapter 3 Documenting Information Systems 91
This guideline suggests that you show all the processing that is taking place. For example, if two documents are being attached, include a manual process to show the matching and attaching activities.
Systems flowcharting guideline 6:
When crossing organizational lines (i.e., moving from one column to an-other), show a document at both ends of the flow line unless the connec-tion is so short that the intent is unambiguous.
Systems flowcharting guideline 7:
Documents or reports printed in a computer facility should be shown in that facility’s column first. You can then show the document or report going to the destination unit.
Systems flowcharting guideline 8:
Documents or reports printed by a centralized computer facility on equip-ment located in another organizational unit (e.g., a warehouse or a ship-ping department) should not be shown within the computer facility. Systems flowcharting guideline 9:
Processing within an organizational unit on devices such as a PC or com-puterized cash register should be shown within the unit or as a separate column next to that unit, but not in the central computer facility column. Systems flowcharting guideline 10:
Sequential processing steps (either computerized or manual) with no delay between them (and resulting from the same input) can be shown as one process or as a sequence of processes.
Systems flowcharting guideline 11:
The only way to get data into or out of a computer data storage unit is through a computer processing rectangle.
For example, if you key data from a source document, you must show a man-ual keying symbol, a rectangle or square, and then a computer storage unit (see, for example part (a) of Figure 3.7, p. 74).
Systems flowcharting guideline 12:
A manual process is not needed to show the sending of a document. The sending should be apparent from the movement of the document itself. Systems flowcharting guideline 13:
Do not use a manual process to file a document. Just show the document going into the file.
DRAWING SYSTEMS FLOWCHARTS
We are now ready to draw the Causeway flowchart. Get some paper (or your computer) and follow along with us. The entities in our current physical DFD (Figure 3.11, p. 85) should help us to set up and label our columns. Although we set up columns for each entity (systems flowcharting guideline 1), we do not have to include columns for the customer, bank, or general ledger office because these entities do not perform any information processing activities. Because accounts receivable and the cashier both interact with the computer, let’s locate them on ei-ther side of the “Computer” column (see systems flowcharting guideline 2). So, from left to right, your columns should be “Mailroom,” “Accounts Receivable,” “Computer,” and “Cashier.”
Thomson Lear
ning
TM
We usually start a flowchart in the top left corner with a start symbol. Because we have eliminated the Customer column, we must start the flowchart with a start symbol labeled “Customer,” followed by two documents labeled “Remittance advices” (RAs) and “Checks.” To show that they are together, we can place the RAs and the checks on top of each other with the back document a lit-tle above and to the right of the front document. We place all these symbols in the Mailroom column because lines 3 and 4 of the narrative tell us that the customer sends checks and remittance advices. This technique makes it clear where the flowchart starts and the source of the document that starts the process. Draw this portion of your flowchart.
Lines 5 and 6 of the narrative tell us that the mailroom clerk endorses the checks, and lines 6 and 7 tell us that the clerk writes the amount paid and the check number on the RA. “Endorse” and “write” are manual processes that, being performed by the mailroom clerk, should be documented with a manual process
symbol (or two symbols) placed in the Mailroom column. Systems flowcharting
guideline 10 tells us that sequential processes may be documented in one or more process symbols. Because one action is directed at the checks and the other action at the RAs (and because our description of the actions would not fit in one process symbol), we’ll use two processes. Draw these processes.
In lines 8 and 9, we find a process—preparing the batch total—that is per-formed periodically by the mailroom clerk. So, still working in the Mailroom col-umn, draw another manual process for the batch total preparation. Find the
an-notation symbol on Figure 3.6 (p. 73) and annotate the batch total preparation
process to describe the periodic nature of the process.
Lines 10 through 14 describe the three items exiting the mailroom and their destination. All three items should exit the batch total preparation process. Because the RAs and the batch total are going to the next column, they can exit from either the right side or the bottom of the process. Systems flowcharting guideline 6 tells us that we do not need to show the RAs and the batch total in both the Mailroom and the Accounts Receivable columns. Since you’ll probably have more room in the Accounts Receivable column, draw these items at the top of that column. Your flow line will require arrows because your logic flow has gone up, rather than down! Did you find the symbol for batch totals on Figure 3.6?
Send the endorsed checks to the cashier using an on-page connector. Systems flowcharting guideline 6 dictates showing the endorsed checks in the sending and receiving columns. In the Cashier column, the endorsed checks must be filed awaiting the receipt of the deposit slip. We introduced this file when we described the current physical DFD (Figure 3.11, p. 85). Notice that the on-page connector is shown where the process ends and again where the process begins. The same let-ter is shown in both places. Use letlet-ters, starting with the letlet-ter “A,” and restart with A on each page. Review the Mailroom column of Figure 3.13 and compare it to your solution. Resolve any discrepancies.
Let’s return now to drawing Figure 3.13. Narrative paragraph 2 describes the process by which the RAs are entered into the computer by the accounts receiv-able clerk and are edited and posted to the accounts receivreceiv-able master treceiv-able. Figure 3.7 part (a) on p. 74 depicts a method for documenting such a process. Notice that the keying symbols, the manual process symbols, and the display symbols are located in the Clerk column, whereas the computer process and stor-age devices are located in the Computer column. Figure 3.7 part (a), indicates a two-step process in which input errors are displayed on the display screen and a